MM is dusting off its sellers hat (IEM, XRO, CSl, SUN, RHC)
What a difference a day makes for both Sydney’s weather and the Australian stock market - on Friday the ASX200 was thumped over 90-points and then yesterday it soared to its largest one day gain in 2-years. Mondays 104-point / 1.84% rally was primarily attributed to a successful outcome from the G20 meeting between Xi & Trump, any escalation in the US-China trade war now seems to be on the back burner to at least 2019. All 11 sectors in the ASX200 closed strongly but trade facing Energy & Materials (resources) sectors led the pack gaining +4.6% and 3% respectively.
In a nutshell Xi and Trump have given themselves 90-days to make some headway on US – China trade before the US lifts its current tariffs from 10% to 25%, most certainly not a “done & dusted” outcome by any means but clearly a step in the right direction. Theoretically we should not get any bad news on trade until late Q1 2019 so the market can deal around more common fundamentals for the foreseeable future.
The opportunity to increase our resources exposure appears to have passed but with our holdings performing strongly we are not complaining i.e. Western Areas (ASX: WSA) surged over 8% and both Orica (ASX: ORI) and RIO Tinto (ASX: RIO) advanced around +2.5%. Also, the MM Growth Portfolio is 99% committed to stocks making us very long while the more conservative Income Portfolio is only holding 5.5% in cash – we are fully aligned with our bullish outlook into Christmas, it definitely felt better at 4pm yesterday than it did that time on Friday.
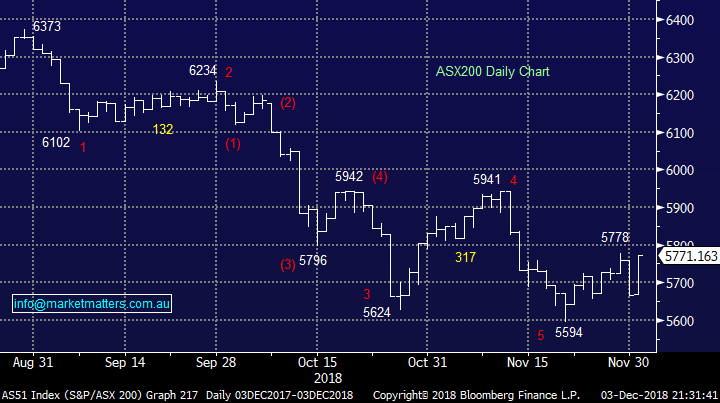
Remember we have been looking for a step like advance towards 5950, as opposed to an explosive breakout with a close above 5800 creating a solid bullish technical picture. Interestingly the average monthly range in what’s been an extremely choppy 2018 is over 260-points which implies that if Mondays 5667 is December’s low a topside target ~5950 is very realistic.
MM remains bullish the ASX200 short-term targeting a “Christmas rally” towards the 5900-6000 area – now only 3% away.
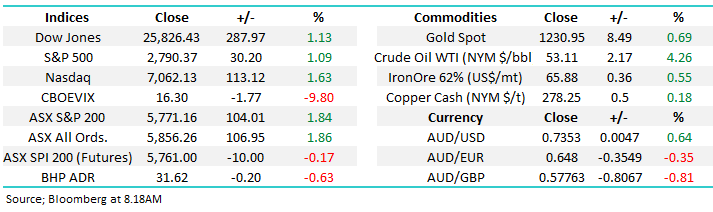
Overnight the Dow rallied just under 300-points not as high as the futures were implying in our time zone but still a solid performance, especially considering it’s now up over 1500-points in 7-trading days. The SPI futures are calling the ASX200 to open down 10-15 points, a good effort after yesterday’s surge and BHP closing down almost 20c in the US currency adjusted relative to our close yesterday.
Today’s report is going to look at 5 of the most likely targets to be sold in the MM Growth Portfolio as we slowly look to increase our cash levels into 2019, remember not all stocks “top out” with the index.
MM is now in “Sell Mode” but ideally at higher levels.
ASX200 Chart
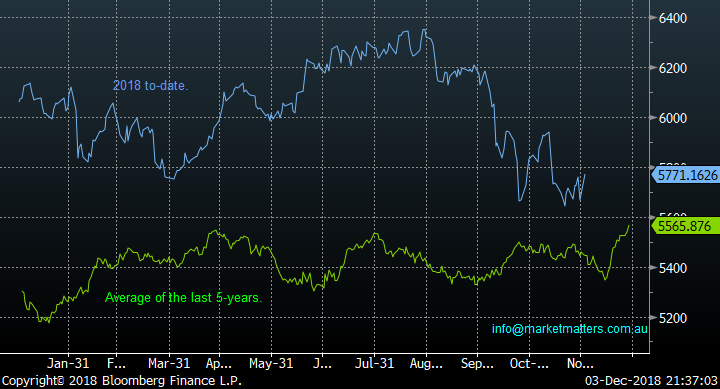
The below chart shows the usual strong December seasonality, the key in our opinion is the upturn usually starts in the first few weeks (relatively large window) but the top is usually in the last 48-hours, hence:
1 – Don’t be surprised if the market struggles to kick ahead over the next week.
2 - We expect to be active between Christmas and New year.
However we do note that 2018 has not been a classic year in terms of following usual seasonal swings so as always investors should remain open-minded.
Also, in the US December is seasonally the strongest month of the year gaining an average of 1.4% with an especially strong bias in the years after US mid-terms (now!).
ASX200 Seasonality Chart
Potential sell targets for MM in the coming weeks
Obviously this is a touch of guess work when we witness 30 stocks rally by over 5% in one day, and 2 fall by a similar degree. Importantly at MM we are very long equities with only a month before the start of 2019 and are planning to increase cash levels into strength so well laid plans are essential.
Today we’ve looked at 5 stocks where our sell levels are relatively close and hence subscribers should be abreast of our thinking which while generally fluid is likely to be relatively constant until our cash levels do start to increase from today’s extremely low levels.
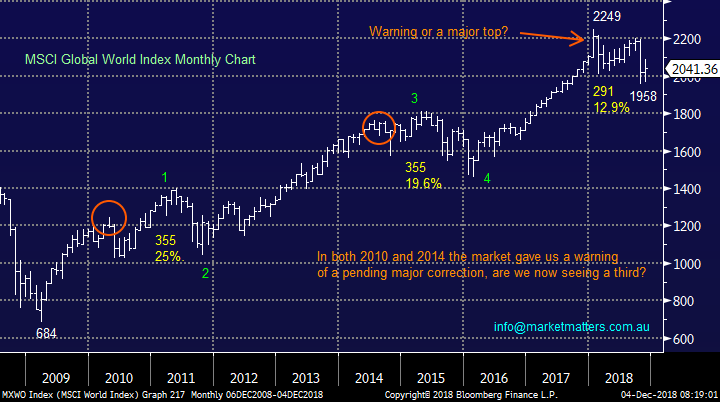
Any ongoing strength in global equities is going to generate a great buy signal with the MSCI World Index targeting ~10% upside.
MSCI World Index Chart
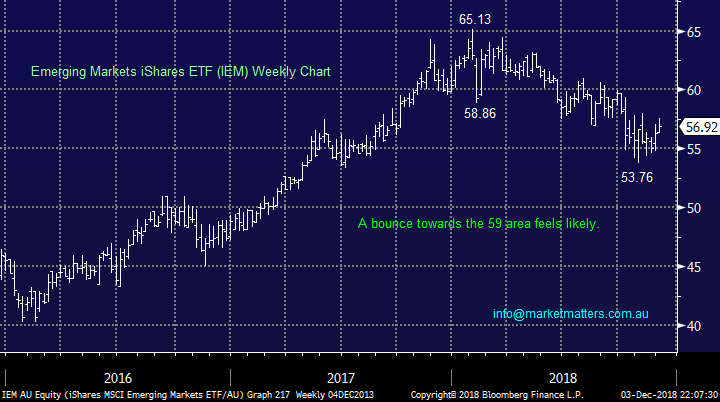
1 Emerging Markets iShares ETF (ASX: IEM) $56.92
We have been long the Emerging Markets (EEM) using a local ETF (ASX: IEM) since late September. This was part of our short US stocks v long Emerging Markets position which was held prior to October’s aggressive decline by the S&P500, we subsequently “lifted a leg” on the position leaving us just long the ETF.
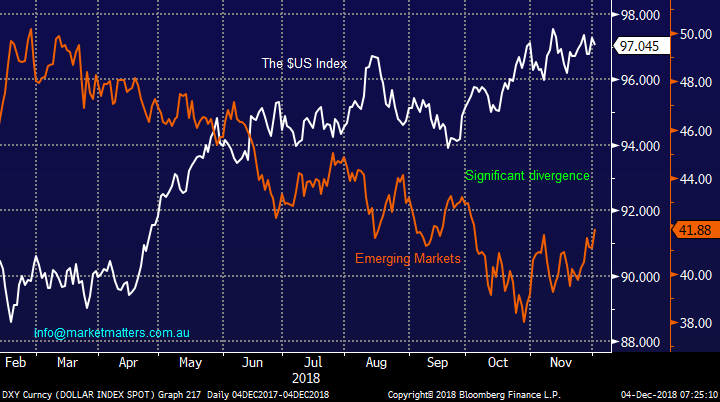
Positive news around US – China trade is great news for EEM, as is a weakening $US, one of our favourite calls over the coming weeks e.g. China and Hong Kong both soared over 2.5% yesterday.
MM is looking to take profit on IEM around the 58.50 area, almost 3% higher.
Emerging Markets iShares ETF (ASX: IEM) Chart
Emerging Markets v $US Chart
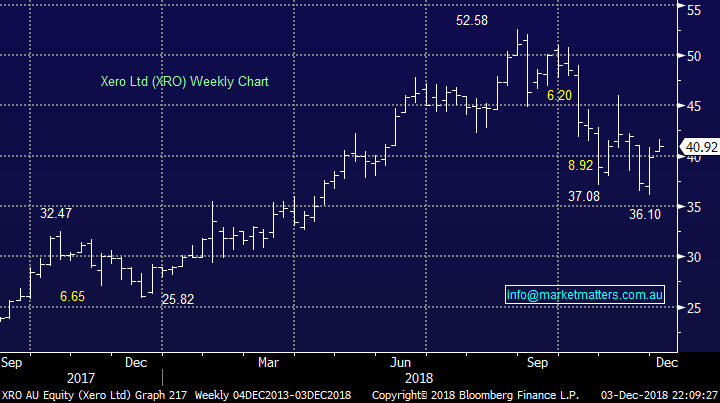
2 Xero Ltd (ASX: XRO) $40.92
XRO was part of the basket of “high growth / value” stocks MM bought on the 21st of November, the group has rallied strongly and picking ideal levels to take some $$ from the table in this volatile sector is almost impossible hence expect us to exit in a staggered manner.
Its important to remember this was always an “active position” and not one that we intended to hold for the long haul. MM still has concerns for the health of these ‘high valuation names’ in 2019/20.
MM is looking to take profit on XRO ~$45, or 10% higher.
Xero Ltd (ASX: XRO) Chart
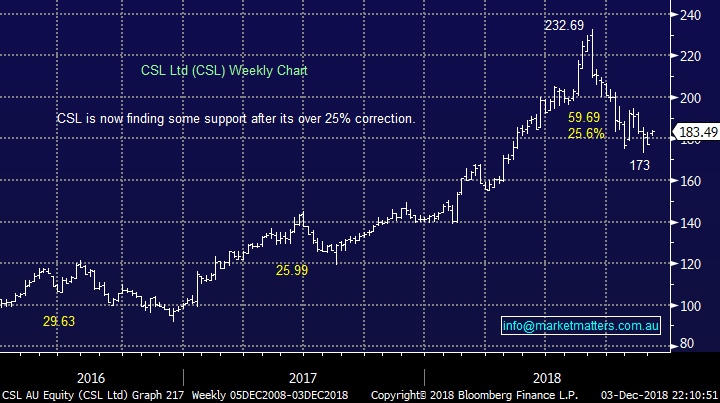
3 CSL Ltd (ASX: CSL) $183.49
MM bought CSL too early when Octobers savage selling actually flowed into late November leaving us holding a small paper loss, and illustrating what can happen when investors are all positioned the same way.
Fortunately CSL looks to have now bottomed with an initial target in the mid-$190 area.
MM is looking to take profit in CSL above $190, around 4% higher.
CSL Ltd (ASX: CSL) Chart
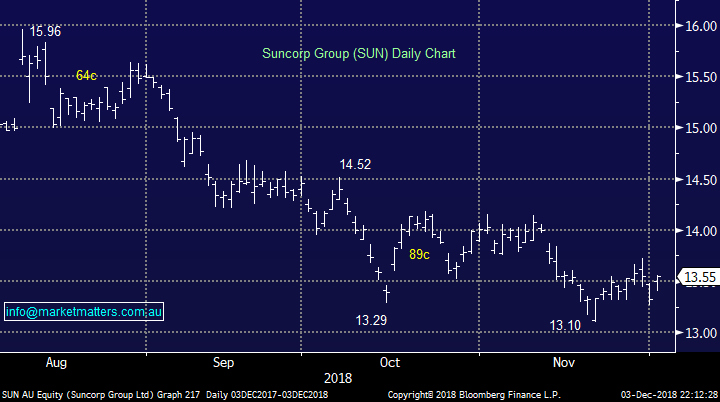
4 Suncorp (ASX: SUN) $13.55
SUN has been our “poster boy” chart for the last few years by reaching our $16 target area and subsequently failing although its important to point out the company has paid out 81c in fully franked dividends in 2018.
MM reduced its large 12% exposure in SUN down to todays 4% during the stocks strength but it now feels the time to fully part company is nigh.
Overall we are now bearish SUN into 2019/20 hence we are looking for an optimal exit level.
MM is looking to sell SUN between $14 and $14.50
Suncorp (ASX: SUN) Chart
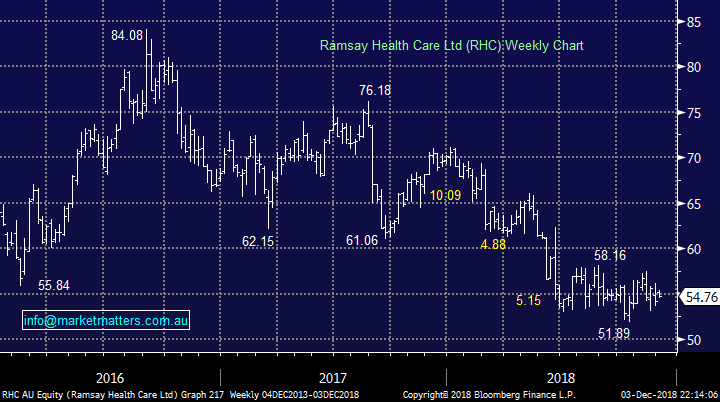
5 Ramsay Healthcare (ASX: RHC) $54.76
RHC has traded sideways for most of 2018 MM and we are slightly behind on our position at present.
The stock has a low Beta to the index i.e. it largely does its own thing. However a pop higher if / when a Christmas rally unfolds would not surprise.
MM is looking to take profit in RHC above $58.
Ramsay Healthcare (ASX: RHC) Chart
Conclusion
MM is dusting off its sellers hat looking to identify levels to increase our cash levels.
We will close out the above 5positions at the levels indicated above over the coming weeks if / when the opportunity arises however markets are fluid and we will look at other positions in future reports.
Overseas Indices
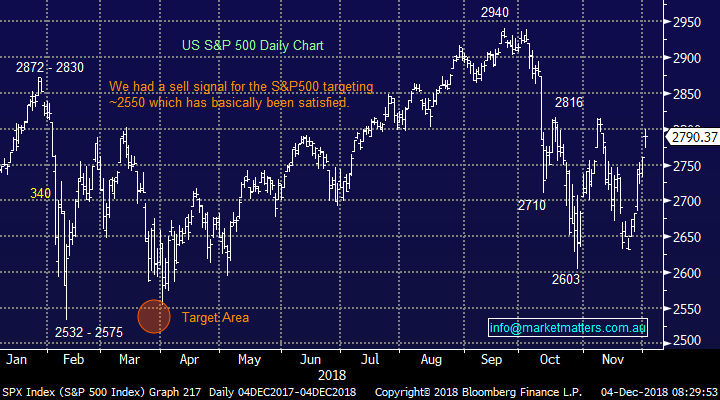
US stocks enjoyed another great night following the G20.
We remain bullish US stocks into Christmas / 2019, initially targeting the 2850 area i.e. now only 2% higher.
US S&P500 Chart
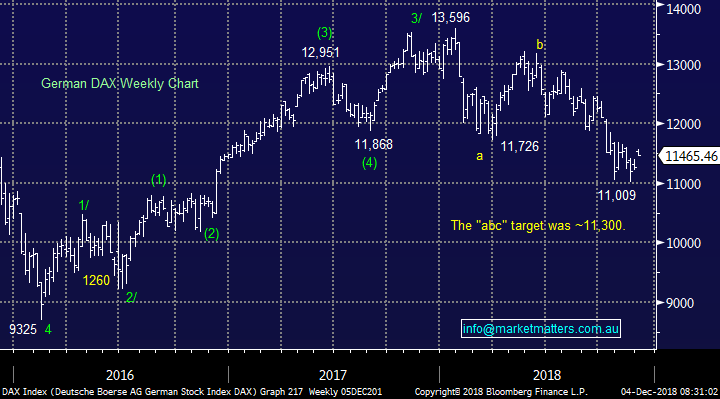
European indices remain neutral with the German DAX hitting our target area which has been in play since January. To turn us bullish we still need to see strength above 11,800.
German DAX Chart
Overnight Market Matters Wrap
· Both the European and US markets welcomed the US-China 90 day trade truce announced last Sunday, as investors clearly placed risk back on.
· On the commodities front, oil rose 4.26% ahead of the OPEC meeting scheduled later this week, while Dr Copper hit a 2 month high early in its session, prior to easing off. Gold also endured a positive close, up towards US$1,230.95/oz.
· BHP is expected to underperform the broader market, after ending its US session down an equivalent of 0.63% from Australia’s previous close.
· The December SPI Futures is indicating the ASX 200 to open 14 points lower, towards the 5755 level this morning.
Have a great day!
James & the Market Matters Team
Disclosure
Market Matters may hold stocks mentioned in this report. Subscribers can view a full list of holdings on the website by clicking here. Positions are updated each Friday, or after the session when positions are traded.
Disclaimer
All figures contained from sources believed to be accurate. Market Matters does not make any representation of warranty as to the accuracy of the figures and disclaims any liability resulting from any inaccuracy. Prices as at 04/12/2018
Reports and other documents published on this website and email (‘Reports’) are authored by Market Matters and the reports represent the views of Market Matters. The MarketMatters Report is based on technical analysis of companies, commodities and the market in general. Technical analysis focuses on interpreting charts and other data to determine what the market sentiment about a particular financial product is, or will be. Unlike fundamental analysis, it does not involve a detailed review of the company’s financial position.
The Reports contain general, as opposed to personal, advice. That means they are prepared for multiple distributions without consideration of your investment objectives, financial situation and needs (‘Personal Circumstances’). Accordingly, any advice given is not a recommendation that a particular course of action is suitable for you and the advice is therefore not to be acted on as investment advice. You must assess whether or not any advice is appropriate for your Personal Circumstances before making any investment decisions. You can either make this assessment yourself, or if you require a personal recommendation, you can seek the assistance of a financial advisor. Market Matters or its author(s) accepts no responsibility for any losses or damages resulting from decisions made from or because of information within this publication. Investing and trading in financial products are always risky, so you should do your own research before buying or selling a financial product.
The Reports are published by Market Matters in good faith based on the facts known to it at the time of their preparation and do not purport to contain all relevant information with respect to the financial products to which they relate. Although the Reports are based on information obtained from sources believed to be reliable, Market Matters does not make any representation or warranty that they are accurate, complete or up to date and Market Matters accepts no obligation to correct or update the information or opinions in the Reports. Market Matters may publish content sourced from external content providers.
If you rely on a Report, you do so at your own risk. Past performance is not an indication of future performance. Any projections are estimates only and may not be realised in the future. Except to the extent that liability under any law cannot be excluded, Market Matters disclaims liability for all loss or damage arising as a result of any opinion, advice, recommendation, representation or information expressly or impliedly published in or in relation to this report notwithstanding any error or omission including negligence.


