Is there an Amazon in the Australian IT sector? (WPL, UNH US, CSL, AMZN US, BVS, XRO, NXT, TNE, APX)
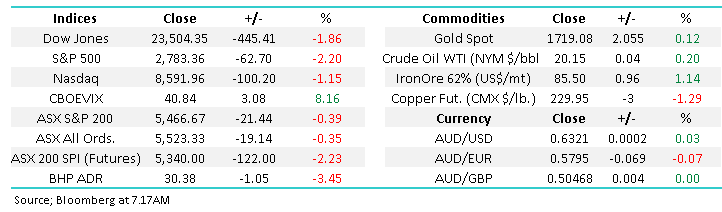
The ASX200 tried to rally yesterday morning but by 11am it was fairly evident that the buying which had taken local stocks up +25% in just a matter of weeks was running out of steam, we finally closed the session down -0.4%. On the surface I can imaging some subscribers felt it was a meek performance compared to the Dows +558-point surge on Tuesday night but during our time zone the S&P500 futures were already rolling over implying US stocks were preparing for some consolidation at best. Under the hood the winners & losers were fairly evenly balanced but when heavyweights CBA, BHP and CSL all decline it’s a big ask for the ASX to continue its advance.
In our Overseas Report on Wednesday we said “the current bounce is almost priced for perfection“ before reiterating our overall bullish stance courtesy of interest rates and governments stimulus, at this stage we’re simply attempting to apply some common sense to the market as we continue to envisage a retracement of recent gains, hence were adopting patience with respect to further stock purchases:
1 – Global stock indices have bounced between 25-30% and yet we’re only just starting to win Phase 1 of the COVID-19 battle, a vaccine remains highly unlikely before 2021.
2 – The economic impact of coronavirus is extremely hard to dissect and at MM we believe it’s easier to consider equities on case by case basis as opposed to becoming married to calls on the underlying index.
3 – The continual flow of capital raisings washing through the ASX has sucked billions of dollars from the buyers coffers as the likes of QBE Insurance (QBE), Invocare (IVC), oOh!media (OML), Oil Search (OSH), Reece (REH ), NEXTDC (NXT) and Cochlear (COH) have already tapped fund managers on the shoulder for cash.
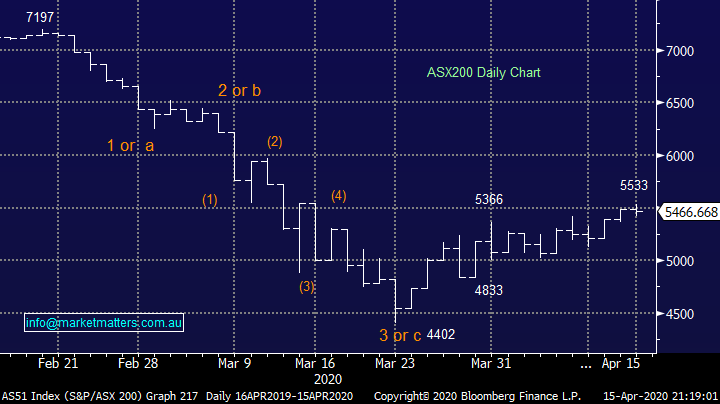
When we saw US stocks only 19% below their all-time high Wednesday morning it rang a short-term alarm bell, they simply felt “rich”, when you combine a US market looking vulnerable to a pullback with the 3 simple points raised above chasing the ASX200 around 5500 made no sense to MM on a risk / reward basis, perhaps it will after a few weeks rest / pullback.
MM remains bullish equities but in a selective and cautious manner at current levels.
ASX200 Index Chart
Since the Coronavirus pandemic swamped the globe in March we’ve all been using some new lingo and acronyms in our day to day language such as COVID-19, Zoom, flattening the curve and WFH (working from home) – no great surprise when about 2.5billion people were living in lockdown about a month ago. On the economic front the focus is switching towards whether we will see a “V” or “U” shaped recovery, people remain optimistic because I’m not hearing any calls of a likely “L” or “W” emerging from these unprecedented times. However, at MM we believe that when the recovery does unfold which is probably going to be fully underway in 2021, when a vaccine should become available, it’s not a simple case of either of these 4 scenarios.
MM’s view is that when the recovery starts from this $25-30 trillion hit to the global economy the world and business will look very different to how it started 2020, can you see yourself booking a cruise any time soon? As a species when we consider the positives our inventiveness and adaptation is unquestionable, but this by definition will lead to an accelerated change of how we do business, there simply will be huge evolution on a number of different fronts. As central banks produce money and credit economies and businesses (stocks) will recover but we must look forward not back in selection of where we want to be invested.
MM believes different sectors and stocks in the ASX will layer across the 4 paths to recovery illustrated below.
Four Potential paths of post-COVID-19 recovery Chart
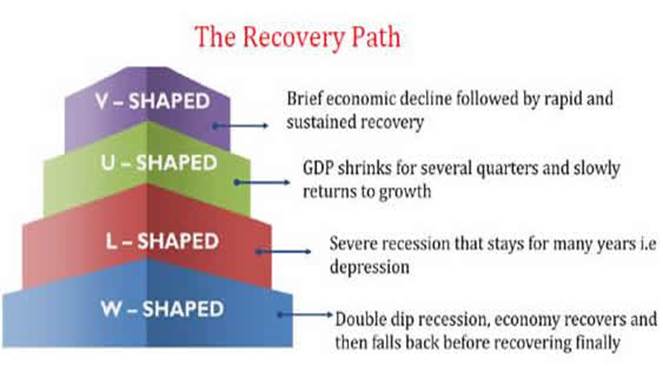
Source: Internet
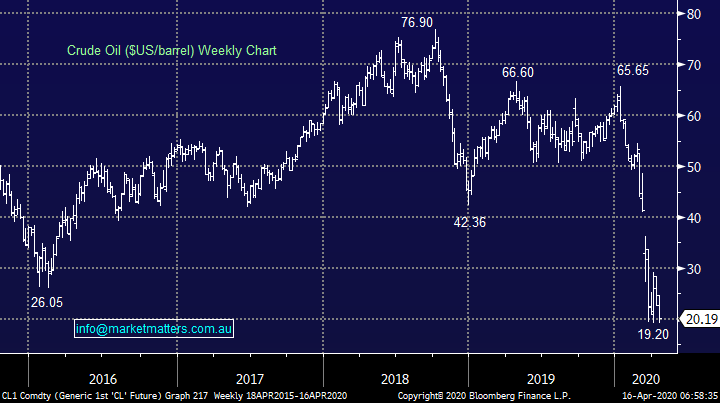
Time to go way out on a limb – MM likes oil stocks into current weakness, at least short-term. Crude oil has plummeted ~70% in 2020 due to the double whammy of the COVID-19 caused demand crush and a supply stoush between Russia and OPEC. However, oil at USD 20/barrel or below is unsustainable for producers hence we see further output cuts relatively soon. An agreement between Saudi Arabia and Russia appears to be in its infancy which should start to support prices. However, only when the global economy recovers from Covid-19 will oil prices rise again to any meaningful degree but as we often point out stocks usually lead fundamentals by around 6-months.
The recent agreed upon 10% cut to supply is nowhere near enough to offset the crash in demand, you only have to drive to the shops to realise this, I cannot remember filling the car up! The fact that we now have positive dialogue between the oil producers we believe can only be taken as a positive.
MM is bullish oil & its related stocks into current weakness.
Crude Oil ($US/barrel) Chart
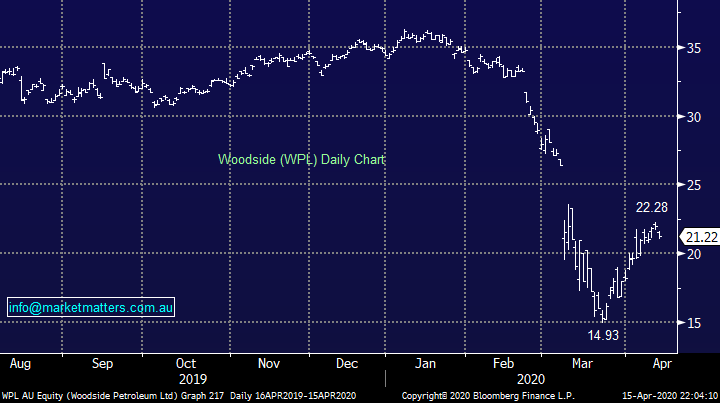
Heavyweight Australian offering Woodside (WPL) bounced almost 50% from its panic March low but the recent OPEC and Russia apparent end to their price war has been a classic case of “buy the rumour & sell the fact”. However we believe a pullback in WPL to ~$20 is an excellent buying opportunity from a risk / reward perspective.
MM is bullish WPL around $20.
Woodside Petroleum (WPL) Chart
Overseas Market Snapshot
Overnight US stocks were whacked with the Financials and Resources leading the decline, the tech sector which MM likes was relatively strong with the NASDAQ only declining -1.1%. We remain keen to buy the quality IT names into a pullback, we anticipate they will continue to outperform during such a correction e.g. overnight the S&P500 fell -2.2% but Apple (AAPL) slipped less than 1%.
MM remains buyers of weakness in some US stocks but we’re now 50-50 at current levels.
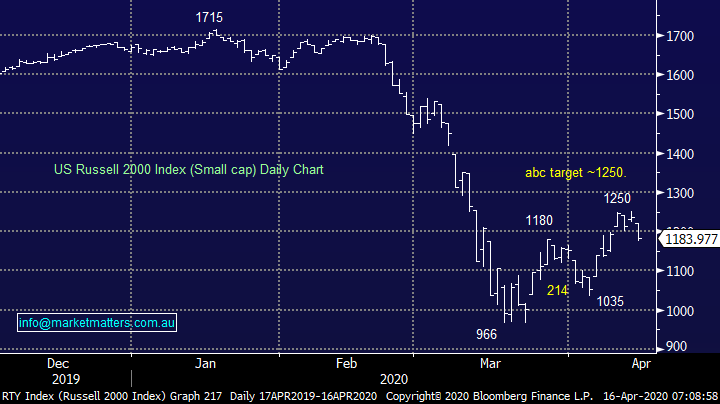
To put things into perspective there are 2 ideal technical target areas for the Russell 2000 to achieve during a pullback, 7-8% or 20% lower (new lows), our preference at MM is the former and on an index perspective we like the concept of accumulating post a 5% pullback.
US Russell 2000 (small cap) Index Chart
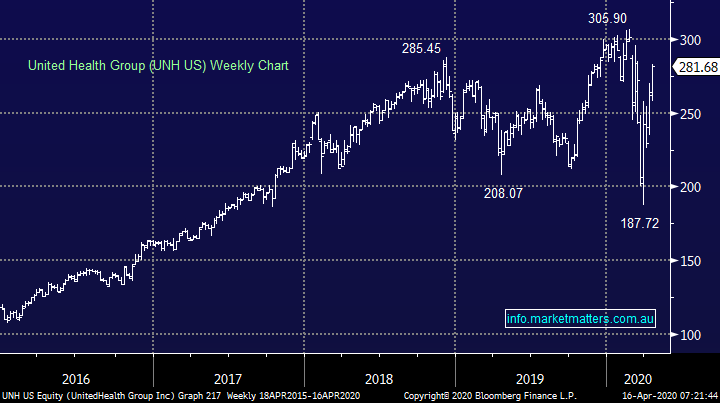
Overnight we saw another example of the quality polarisation which MM expects to be prevalent in 2020 i.e. the cream will continue to float to the top, it’s not the time to chase “cheap” stocks. United Health (UNH US) beat expectations when it reported sending the stock within 7% of its all-time high – my first thought was Australia’s own CSL Ltd (CSL), the chart patterns are very similar!
MM remains long and bullish United Health targeting fresh all-time highs.
United Health (UNH) Chart
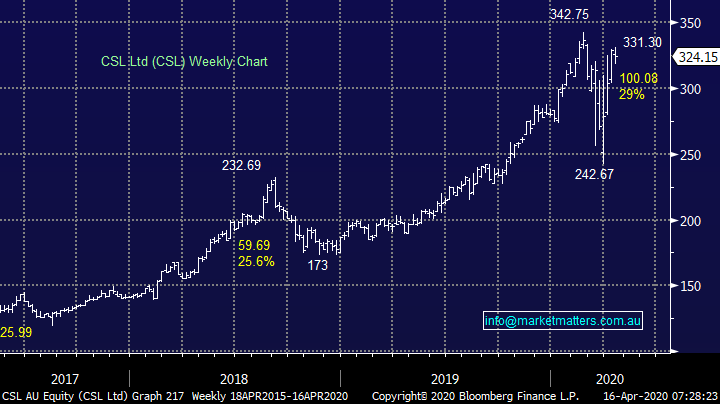
Similar to United Health CSL is now only 5% below its all-time high, any pullback towards $300 will be very tempting for MM.
MM believes CSL will make fresh all-time highs in 2020/21.
CSL Ltd (CSL) Chart
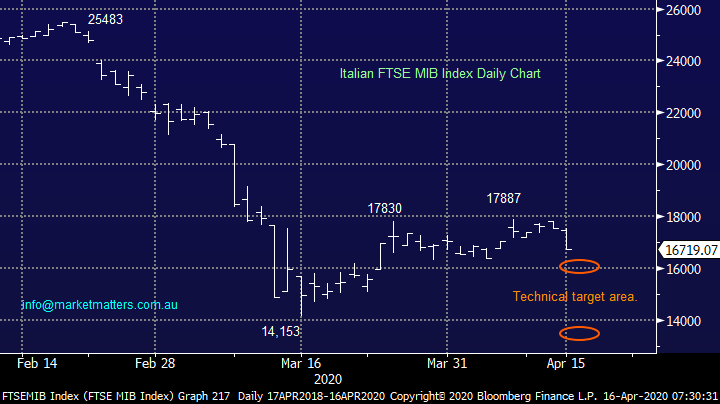
Italian stocks have started to follow the technical path MM have been anticipating with our ideal retracement targets illustrated below, they are currently 4% and 15% lower, at this stage we are 65 : 35 in favour of the more bullish scenario hence for subscribers trading / investing in this virus ravaged country we would advocate accumulation into weakness between our 2 target areas.
MM likes Italian stocks into current weakness.
Italian FTSE MIB Index Chart
Can MM find an Amazon in the Australian tech sector?
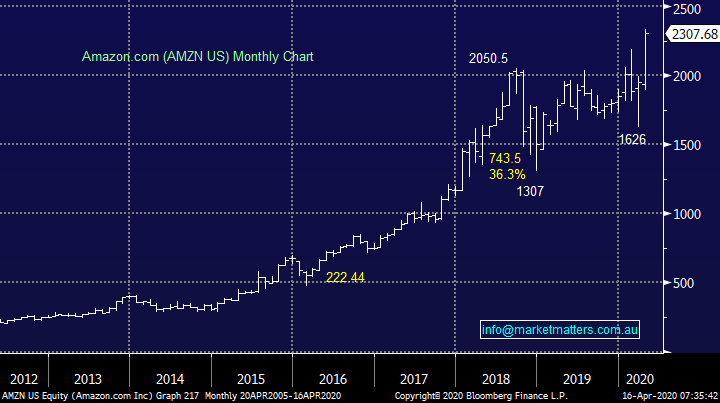
Last night Amazon (AMZN US) the largest global cloud & e-commerce company again made fresh all-time highs as it evolves into a $1.8 trillion monster of a business. As we wrote in our International Report yesterday MM believes this is a train that has only just left the station, we are happy to chase strength here especially on a relative basis. The US company just announced they are now hiring an additional 75,000 people on top of the 100,000 it already just hired, this illustrates impressive expansion during these hugely uncertain times.
I reiterate MM believes it’s important that subscribers focus on where stocks are headed, not just levels they plumbed in March during the mass panic selling i.e. just as we touched on earlier with regards to United Health and CSL.
Hence in today’s rapidly evolving market MM has scrutinised the Australian IT sector looking for quality names which seem destined to make fresh all-time highs in the ensuing months – the obvious clue just like with the US equivalents is they’re already likely to be a top performer.
Amazon (AMZN US) Chart
Hence, we initially started off by filtering the top performers of the 13 IT stocks in the ASX200, looking at both their performance over the last month and 6-months. Only 5 stocks are positive over the longer timeframe hence we have briefly reviewed these looking for a local star performer, or two.
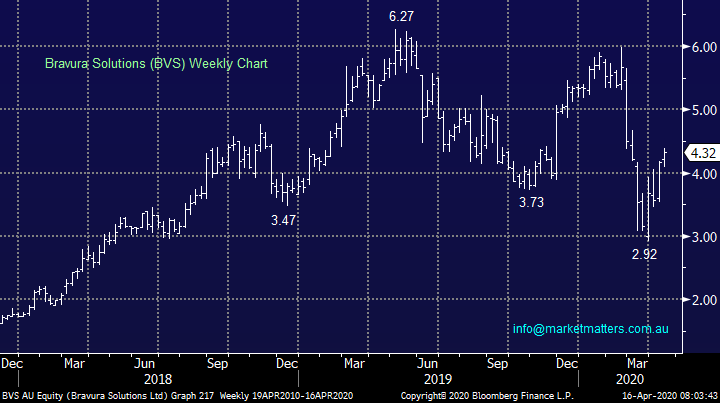
1 Bravura Solutions (BVS) $4.32
BVS provides wealth management applications software, this fintech business is likely to have its growth slowed by COVID-19 but it looks well positioned for the years ahead. Recent acquisitions have expanded the company’s growth possibilities which bodes well. Technically BVS looks bullish while it can hold above the $3.50 area.
MM likes BVS but is unlikely to run out and buy the stock at this point in time.
Bravura Solutions (BVS) Chart
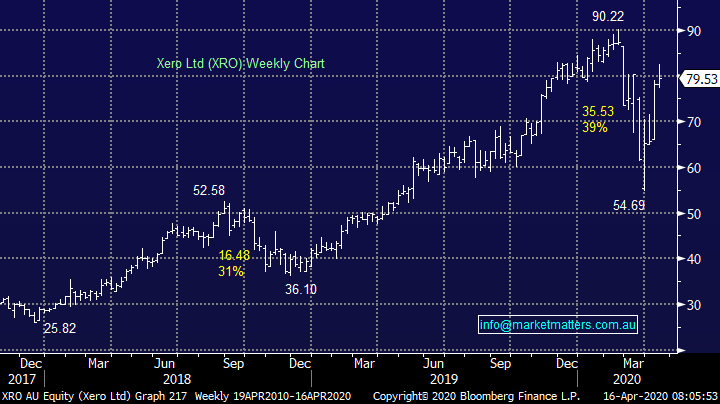
2 Xero (XRO) $79.53
MM already owns online accounting business XRO which we believe is perfectly positioned to grow post COVID-19 – the stock’s performance in 2020 agrees so far. Technically the XRO looks extremely well positioned to make new all-time highs in 2020/2021.
MM is bullish XRO targeting ~25% upside.
Xero (XRO) Chart
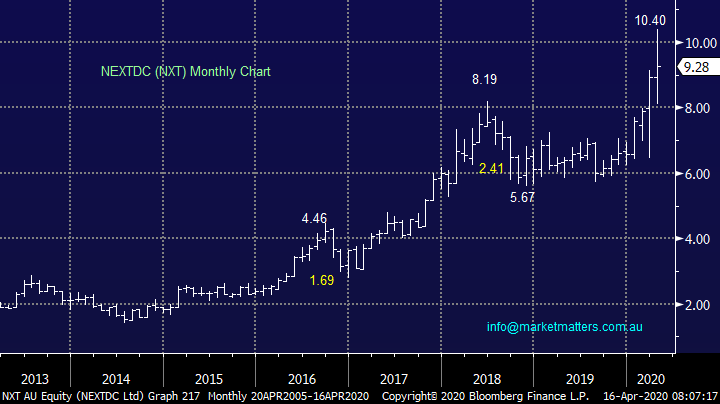
3 NEXTDC (NXT) $9.28
Asia’s leading data centre business NXT offers connectivity and content hubs which certainly is a boom area at present, the company is building an infrastructure platform for the ever-expanding digital economy. The cloud boom should be NXT’s friend and they saw strong demand for to the company’s recent $672m raising to fund its accelerated expansion plans i.e. strike when the irons hot!
The capital raising was undertaken at $7.80 which makes todays levels feel slightly rich in the short-term.
MM likes NXT ~5% lower.
NEXTDC (NXT) Chart
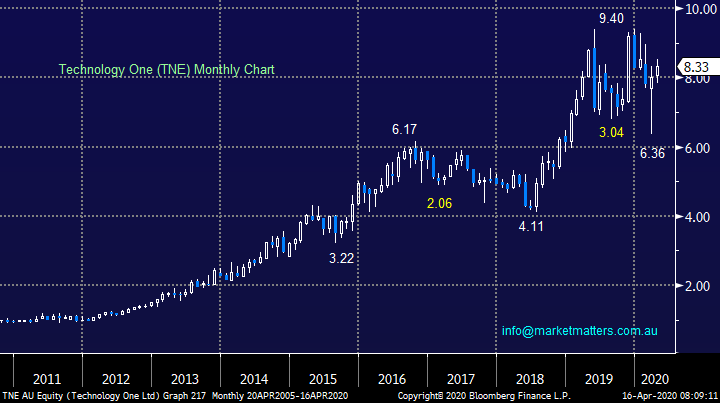
4 Technology One (TNE) $8.33
TNE has been discussed by MM a few times in 2020, the company delivers enterprise software to over 1200 companies and government operations. The Brisbane based company is now Australia’s largest stock in its field, importantly it has a relatively recession proof income stream, no debt plus cash on its balance sheet, what’s not to like in the current environment. MM can see ~20% upside in TNE.
MM likes TNE around $8.
Technology One (TNE) Chart
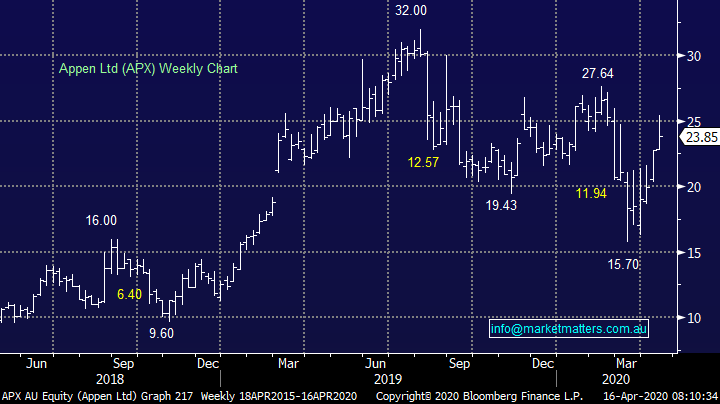
5 Appen (APX) $23.85
Even in today’s economic uncertainty APX has confirmed its 2020 guidance illustrating the recession proof nature of this artificial intelligence (AI) business – they’re on track to deliver ~25% increase in EBITDA +/- a few percent. We like the company and technical stops can be operated below $20, not too far in today’s volatile environment.
MM likes APX around $23.
Appen (APX) Chart
Conclusion :
MM likes the 5 stocks we looked at today with our order of preference being: XRO, TNE, APX, NXT and BVS.
*Watch for alerts.
Overnight Market Matters Wrap
- US equity markets sold off on the back of a weaker retail sales print for March, along with a decline in US industrial production.
- The energy sector continues to lose steam with crude oil demand continuing to plumb to an 18-year low.
- The June SPI Futures is indicating the ASX 200 to open 100 points lower, towards the 5365 level with April index expiry this morning.
Have a great day!
James & the Market Matters Team
Disclosure
Market Matters may hold stocks mentioned in this report. Subscribers can view a full list of holdings on the website by clicking here. Positions are updated each Friday, or after the session when positions are traded.
Disclaimer
All figures contained from sources believed to be accurate. All prices stated are based on the last close price at the time of writing unless otherwise noted. Market Matters does not make any representation of warranty as to the accuracy of the figures or prices and disclaims any liability resulting from any inaccuracy.
Reports and other documents published on this website and email (‘Reports’) are authored by Market Matters and the reports represent the views of Market Matters. The Market Matters Report is based on technical analysis of companies, commodities and the market in general. Technical analysis focuses on interpreting charts and other data to determine what the market sentiment about a particular financial product is, or will be. Unlike fundamental analysis, it does not involve a detailed review of the company’s financial position.
The Reports contain general, as opposed to personal, advice. That means they are prepared for multiple distributions without consideration of your investment objectives, financial situation and needs (‘Personal Circumstances’). Accordingly, any advice given is not a recommendation that a particular course of action is suitable for you and the advice is therefore not to be acted on as investment advice. You must assess whether or not any advice is appropriate for your Personal Circumstances before making any investment decisions. You can either make this assessment yourself, or if you require a personal recommendation, you can seek the assistance of a financial advisor. Market Matters or its author(s) accepts no responsibility for any losses or damages resulting from decisions made from or because of information within this publication. Investing and trading in financial products are always risky, so you should do your own research before buying or selling a financial product.
The Reports are published by Market Matters in good faith based on the facts known to it at the time of their preparation and do not purport to contain all relevant information with respect to the financial products to which they relate. Although the Reports are based on information obtained from sources believed to be reliable, Market Matters does not make any representation or warranty that they are accurate, complete or up to date and Market Matters accepts no obligation to correct or update the information or opinions in the Reports. Market Matters may publish content sourced from external content providers.
If you rely on a Report, you do so at your own risk. Past performance is not an indication of future performance. Any projections are estimates only and may not be realised in the future. Except to the extent that liability under any law cannot be excluded, Market Matters disclaims liability for all loss or damage arising as a result of any opinion, advice, recommendation, representation or information expressly or impliedly published in or in relation to this report notwithstanding any error or omission including negligence.