Is it time to switch resources to banks? (BHP, WBC, CGF, QBE)
Hurricane Irma has thankfully been reduced to a “tropical storm” with forecasts of the damage reduced by up to $50bn from the $20bn initially feared. Also, for good measure America has diluted their proposed sanctions against North Korea – it actually feels like Kim Un-Jong has won this particular round of one upmanship. The net result has been a strong rally overnight by “risk assets” like stocks and an unsurprising fall in perceived safe havens e.g. Gold, bonds and the Yen. This morning the ASX200 is looking set to open up another 30-points to add to yesterday’s 40-point / 0.7% rally, the market continues to have a bullish tone when its devoid of any major scary geo-political news.
On this note, it’s again important to remember the numbers that came out of the recent Bank of America (BOFA) Merrill Lynch’s Fund Manager Survey:
1. 46% of fund managers see US equities as overvalued, the largest number ever.
2. Global investors average cash holdings are 4.9%, above the 10-year average of 4.5%.
3. European investors are holding 5.3% in cash, the highest level since 2003.
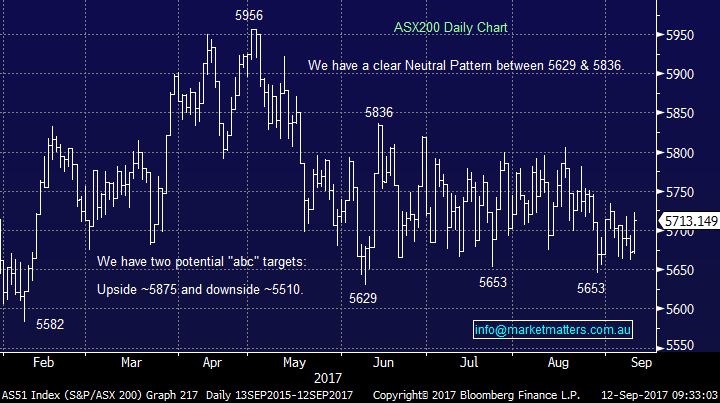
When we consider the above 3 points it remains easy to understand why there are plenty of sellers on strong days and conversely buyers emerge on days of weakness due to raised cash levels, hence we find ourselves in a very defined trading range. As you’d know, on balance we think the range breaks to the downside however if it does, we want cash available to buy weakness given the above stats.
ASX200 Daily Chart
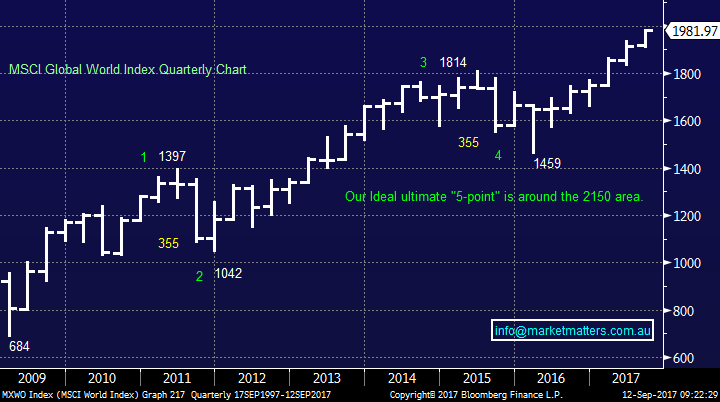
Last night the Global World Index closed only 0.5% below its all-time high, a level we expect will probably be broken in the next 24-48 hours – the ASX200 languishing over 16% below its equivalent milestone unfortunately illustrates the current flaws within our local economy. It remains important to remember at MM we are still targeting around 9% further upside prior to a correction of the whole bull market advance since March 2009. Hence the game remains the same, until further notice:
“Buy weakness, ideally 5% pullbacks, and sell any surges to fresh all-time highs”
MSCI Global World Index Quarterly Chart
US Stocks
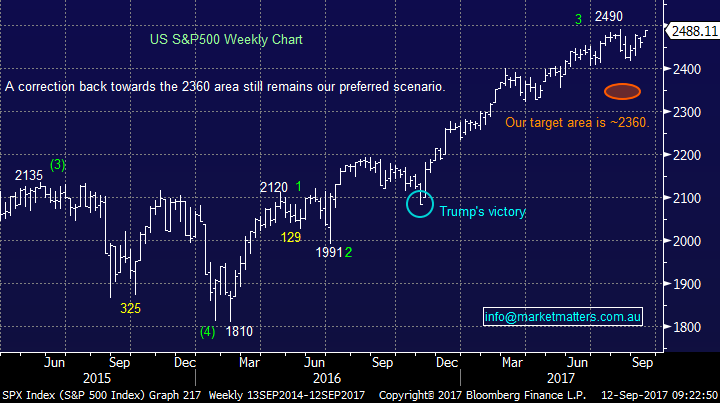
US equities rallied strongly overnight will all 10 sectors of the S&P500 closing in the black, while the financials led the way gaining over 1.7% - almost the exact same advance as by our own banks / financials yesterday. While we expect fresh highs from US indices in the next 24-48 hours on balance we don’t anticipate follow through buying, in fact we would be trading sellers of such a pop higher.
There is no change to our short-term outlook for US stocks, we are targeting a ~5% correction i.e. a around 130-points by the S&P500.
US S&P500 Weekly Chart
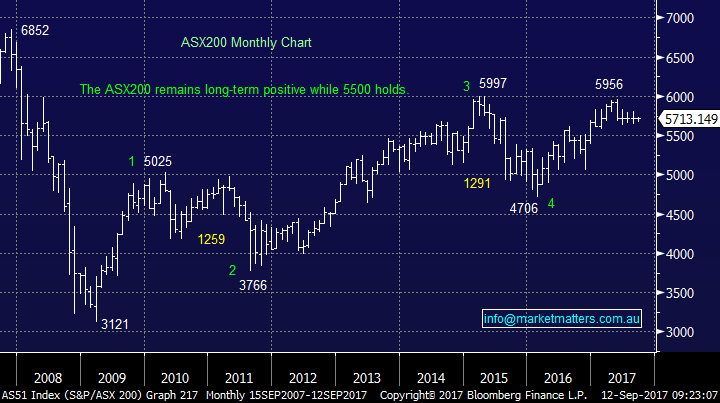
The main story we have been focusing on over the last few weeks is when to switch from resources to banks. Yesterday the markets experienced the first reversion of the trend since mid-2017 with for example BHP Billiton (BHP) falling 49c / 1.8% while Westpac (WBC) rallied 52c / 1.7%. The overnight moves imply both sectors should be strong this morning but obviously time will tell if we’ve seen the extreme in the relative performance / strength between both heavyweight sectors. However we would point out that markets have a habit of needing more than one attempt to break a decent trend, especially bull markets. Two excellent examples are shown below by the ASX200:
- In January 2010 the market formed a high at 4955 and then fell almost 500-points before getting off the floor and rallying to a fresh high for the year at 5025 in April. Just when optimism was rife the market proceeded to then fall 1259-points / 25%.
- Similarly in 2015 the market had 4 attempts, over different weeks between March and May, at cracking over 6000 before correcting 1291-points / 21.5%.
Today we will just stand back and look at the different stocks / sectors to ensure our plan is clear.
ASX200 Monthly Chart
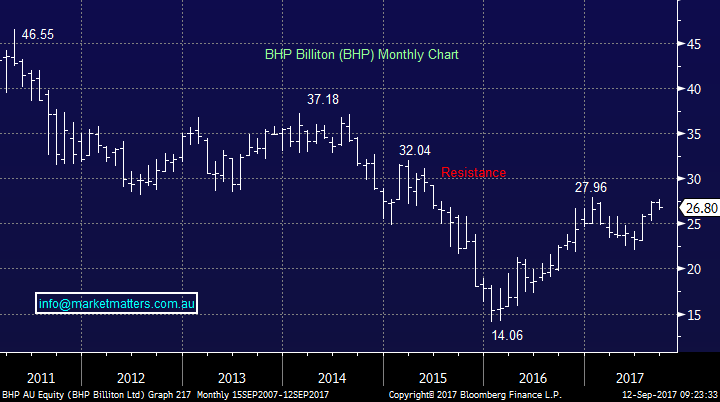
At this stage there is no reason to believe the last 2 days weakness in BHP is the end of its rally from $22.06 in June. Our target remains over $28 although one could argue it traded there last week as the stock went ex. a ~53c fully franked dividend.
While we still see a little further upside from our large cap. mining stocks, we do intend to sell this strength.
BHP Billiton (BHP) Weekly Chart
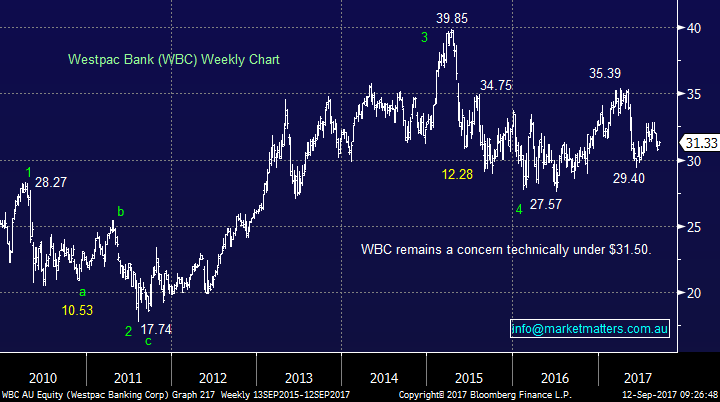
We already have a decent exposure to the banks in the MM Growth Portfolio hence any increase needs to be very much on our terms for both price and timing. Seasonally this is a good time for banks with an average gain of over 4% from the third week of September (next week) until the end of October which makes sense as attractive dividends are looming on the horizon in November for investors from the majority of the sector. Two banks which we own caught our eye yesterday:
- Westpac (WBC) a close back over $31.50 today will look positive technically.
- Bank of Queensland (BOQ) – BOQ made impressive fresh highs since January 2016, a pullback feels due but the stocks looking great.
Overall the banks may have found the low for September but if they haven’t there looking for it and it feels close at hand.
Westpac (WBC) Weekly Chart
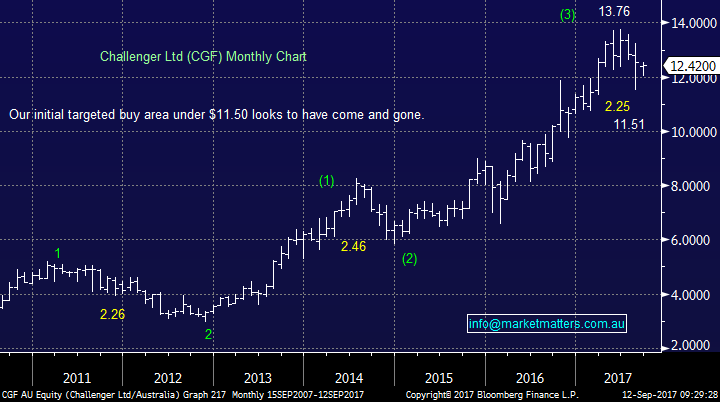
Also, we remind subscribers that we still like the diversified financials into any weakness that may be triggered by an overdue pullback from stocks in the US.
Our preferred choice is currently CGF under $12 but we remain open-minded.
Challenger (CGF) Monthly Chart
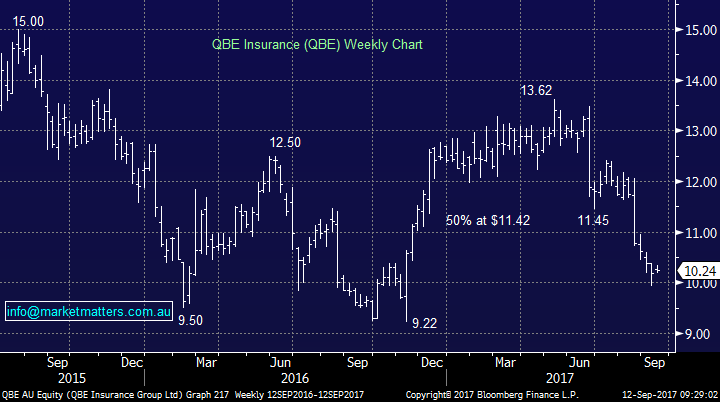
And finally, QBE, a stock we own should be in focus this morning for 3 key reasons – which I covered on SKY Business a few moments ago;
1. A new CEO announced, with Pat Regan (current CFO) taking over from John Neal from the 1st Jan 2018. We expect this to be taken as a positive by the market
2. Hurricane Irma being downgraded overnight
3. A rally in US Bond Yields and some buying in the $US
QBE (QBE) Weekly Chart
Conclusion (s)
We remain on alert to sell all / part of our resources holding into strength with the banks / diversified resources a strong possibility of receiving some of these funds.
At this stage we believe the relative sector performance between banks and resources may have reached an extreme but another final push by resources would not surprise – we believe the resources are looking for a top and the banks a bottom!
Overnight Market Matters Wrap
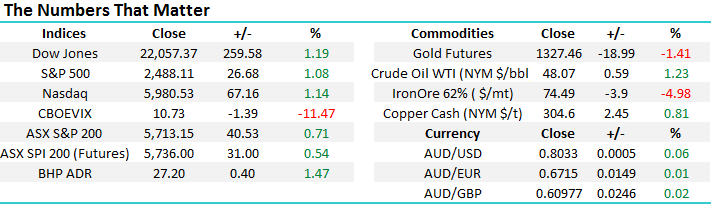
· The US major indices had a relief rally overnight, as the damage estimates of the recent hurricane is lower than anticipated, with the Dow up 1.19% and the broader S&P 500 up 1.08%.
· With the above mentioned and geopolitical tensions easing, the Volatility Index lost 11.47%, retracing back to ultra-low complacency levels. This also ties in with investors reverting back to ‘riskier’ assets, switching out of gold which lost 1.41% overnight.
· BHP is expected to claim some of yesterday’s losses and outperform the broader market after rallying an equivalent of 1.47% from Australia’s previous close.
· The September SPI Futures is indicating the ASX 200 to open 25 points higher, towards the 5740 area this morning.
Disclosure
Market Matters may hold stocks mentioned in this report. Subscribers can view a full list of holdings on the website by clicking here. Positions are updated each Friday.
Disclaimer
All figures contained from sources believed to be accurate. Market Matters does not make any representation of warranty as to the accuracy of the figures and disclaims any liability resulting from any inaccuracy. Prices as at 12/09/2017. 8.00AM.
Reports and other documents published on this website and email (‘Reports’) are authored by Market Matters and the reports represent the views of Market Matters. The MarketMatters Report is based on technical analysis of companies, commodities and the market in general. Technical analysis focuses on interpreting charts and other data to determine what the market sentiment about a particular financial product is, or will be. Unlike fundamental analysis, it does not involve a detailed review of the company’s financial position.
The Reports contain general, as opposed to personal, advice. That means they are prepared for multiple distributions without consideration of your investment objectives, financial situation and needs (‘Personal Circumstances’). Accordingly, any advice given is not a recommendation that a particular course of action is suitable for you and the advice is therefore not to be acted on as investment advice. You must assess whether or not any advice is appropriate for your Personal Circumstances before making any investment decisions. You can either make this assessment yourself, or if you require a personal recommendation, you can seek the assistance of a financial advisor. Market Matters or its author(s) accepts no responsibility for any losses or damages resulting from decisions made from or because of information within this publication. Investing and trading in financial products are always risky, so you should do your own research before buying or selling a financial product.
The Reports are published by Market Matters in good faith based on the facts known to it at the time of their preparation and do not purport to contain all relevant information with respect to the financial products to which they relate. Although the Reports are based on information obtained from sources believed to be reliable, Market Matters does not make any representation or warranty that they are accurate, complete or up to date and Market Matters accepts no obligation to correct or update the information or opinions in the Reports.
If you rely on a Report, you do so at your own risk. Any projections are estimates only and may not be realised in the future. Except to the extent that liability under any law cannot be excluded, Market Matters disclaims liability for all loss or damage arising as a result of any opinion, advice, recommendation, representation or information expressly or impliedly published in or in relation to this report notwithstanding any error or omission including negligence.
To unsubscribe. Click Here


