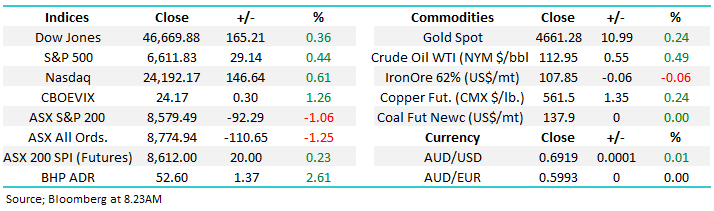
Is it time to re-enter the Telco sector? – (CNU, TLS, TPM, VOC, WEB)
The ASX200 started the week off on the front foot but considering the US futures spiked up over +0.6% first thing in the morning AEST it wasn’t a particularly dynamic performance with less than 4% of the market managing to rally by over 3%. The overall theme was consistent to most of last week, stocks that benefit from falling bond yields are firm as the market appears to position itself for an RBA rate cut on the 1st of October – Bill Evans from Westpac is the hot economist in town at the moment and he’s convinced rates will drop 0.25% next Tuesday, plus another 0.25% in February 2020, in other words Australian official rates are poised to halve.
The Australian index is often more correlated to European indices as opposed to the US, which doesn’t bode well for the local index this week after we saw Euro zone manufacturing and services data disappoint in a major way last night – negative interest rates are clearly not helping the region. Markets received a sudden reminder of how fragile the global economy is, especially with President Trump and Xi continuing to antagonise each other around trade. Central banks are arguably going to have a much tougher time than previously over the last decade, post the GFC, to convince investors that they can maintain economic expansion /growth by whatever means necessary. For the many bears out there a classic sell signal would be equities failing to rally when central banks pump yet more stimulus into their respective economies.
However while we are cautious equities at current levels MM have seen no technical sell signals, just lots of nervousness. We continue to feel like equities are walking along a gymnastics beam with a bullish pull on one side of incredibly low bond yields while a bearish push is on the other side due to a wobbling global economy – for the active investor it’s easier to simply wait until we see stocks topple too far in one direction to correct themselves.
Short-term MM remains comfortable adopting a more conservative stance towards equities around current market levels.
Overnight global stocks were mixed with Europe falling around 1% following the weak economic data while the US closed basically unchanged. The SPI Futures are calling the ASX200 to open down around 10-points with BHP falling ~0.5% in the US not helping early sentiment.
This morning MM has looked at the domestic Telco sector which we’ve avoided for much of 2019.
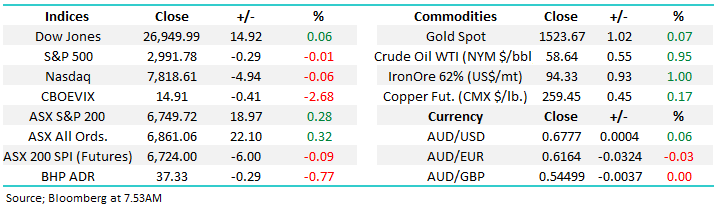
ASX200 Chart
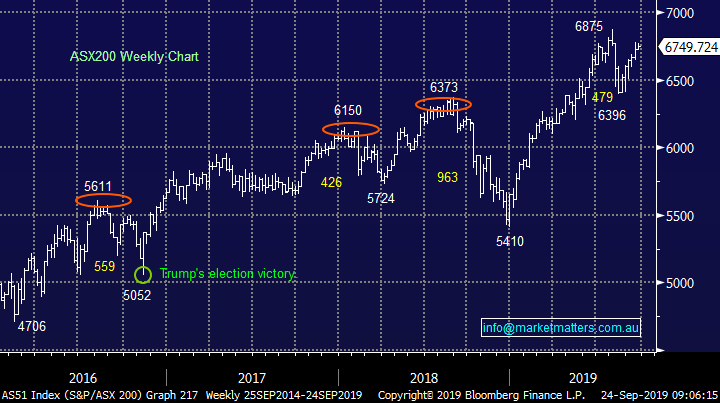
Yesterday we saw confirmation that the ill-fated tie up between Webjet (WEB) and Thomas Cook was over, the world’s oldest travel company went into “compulsory liquidation” on Monday leaving WEB carrying an almost $44m loss – one for the accountants to structure.
The important thing to consider here is the sad demise of Thomas Cook was no surprise, we’ve written about it a number of times over recent months – WEB stock has already fallen 37% since May. We like the business and its cash reserves of over $200m, the question is where does the risk / reward become compelling to step up and buy WEB – we’ve had a few good wins from WEB in the past.
At this stage MM likes WEB below $10 i.e. no hurry just yet.
Webjet (WEB) Chart
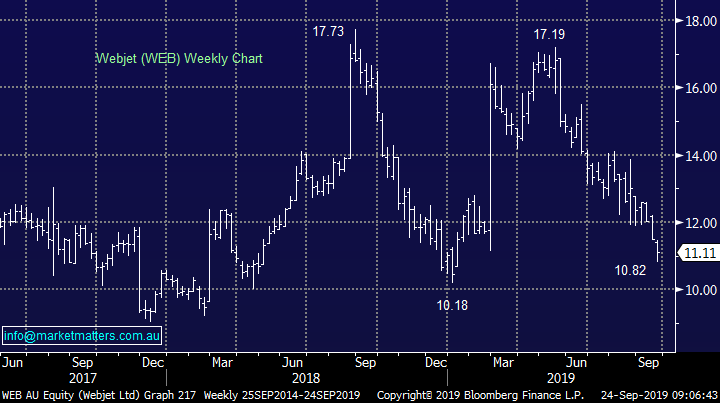
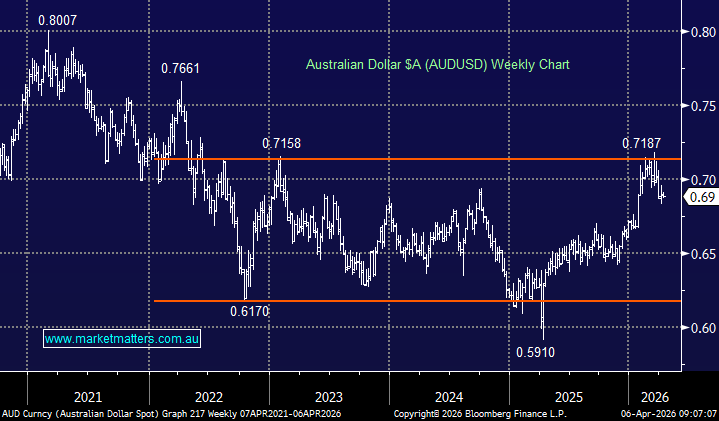
The Australian Dollar following further dovish comments from Bill Evans held its ground and currently looks comfortable close to the 68c area, we like its ability to remain resilient in the face of 2 more rate cuts in less than 6-months, a contrarian bullish sign in our opinion.
MM is looking for a catalyst to buy the $A, this maybe it.
Watch for alerts for our MM Global Macro Portfolio.
Australian Dollar ($A) Chart
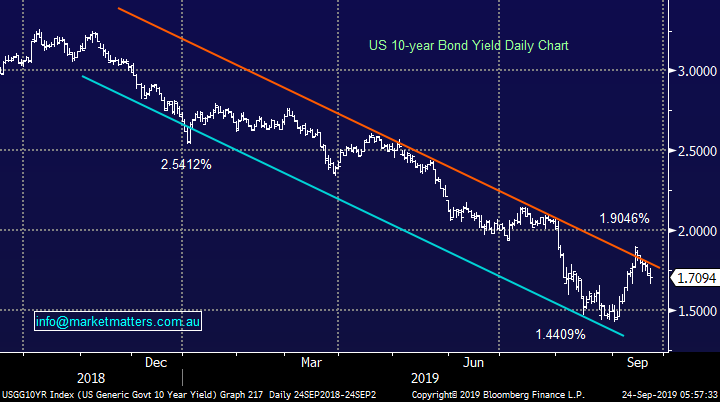
Overnight US bond yields continued their pull back away from the overhead trendline resistance illustrated below. Overall it was a fairly refrained reaction to extremely weak European data, which almost confirmed Germany was in a recession. However some more minor US economic data appeared enough to let the more insular looking American market stabilise and relax a little.
We can see fresh lows in 2019 but not as clearly as with our own bond yields hence the recent renewed weakness in the $A is easy to understand.
MM is neutral / bearish US bond yields at present.
US 10-Year Bond Yield Chart
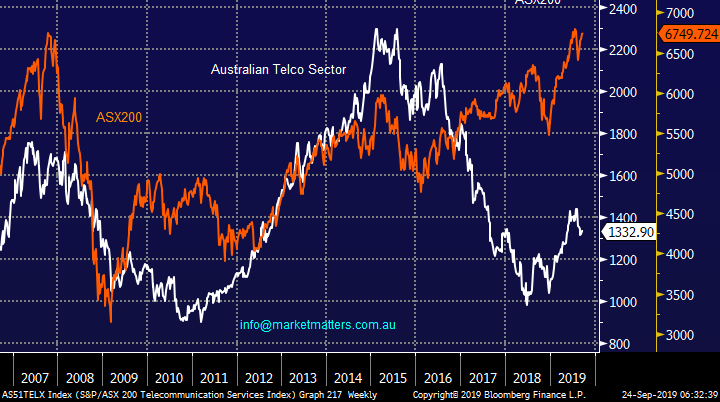
Revisiting the Australian Telco sector
The Australian Telco sector is dominated by Telstra (TLS) with its market cap of $43bn compared to second largest in the space TPG Telecom (TPM) with its market cap of just $6.5bn. The correlation between the sector and the ASX200 was fairly good post the GFC until we saw
TLS’s fall from grace from ~2016, since then the competitive Telcos with their declining margins and government interference has generally been a good place to avoid – the question is now has some value emerged, especially on a comparative basis.
Australian Telco sector v ASX200 Chart
Today I have briefly looked at 4 Telco stocks – note we no longer consider Telstra (TLS) as a “yield play” due to its lower payout.
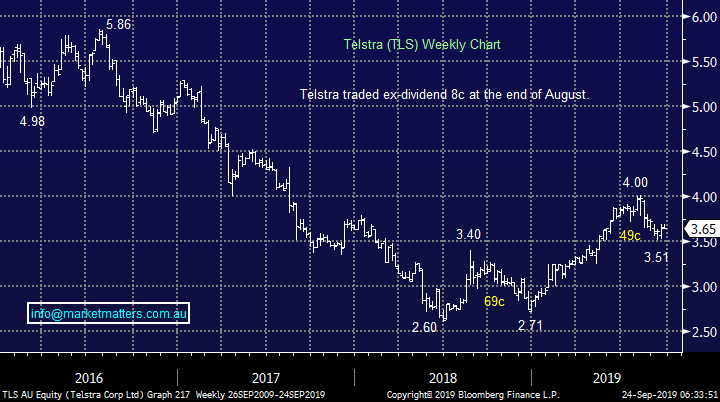
1 Telstra (TLS) $3.65
TLS has recovered from its almost panic like lows under $3 in 2018 but between $3.50 and $4 the story is far less compelling with the stock trading on an Est P/e for 2020 of 17.7x while yielding just 2.7%, fully franked. So far TLS has delivered on its cost reductions the question is now how will it benefit from the NBN and 5G, time will obviously tell on these two major areas. Also of course the company has been fortunate with the regulators intervention in the TPG Telecom and Vodafone merger enabling them to maintain some decent margins in their mobile business.
Overall from a risk / reward basis there feels more exciting places to be invested but we should remain mindful that Telcos generally perform well in a recession if / when one does hit our shores.
MM is neutral / slightly positive TLS.
Telstra (TLS) Chart
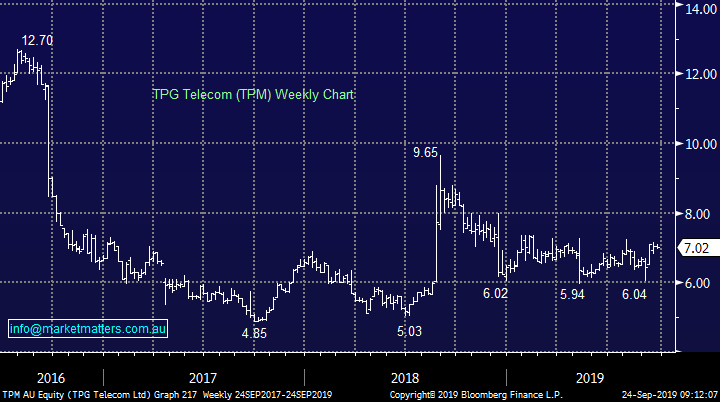
2 TPG Telecom (TPM) $7.02
TPM has been on a roller-coaster ride since its announced potential merger with Vodafone, the companies chairman has recently faced court as TPM challenged the ACCC’s ban on the merger - a tough decision in my opinion. We should see an outcome in the not too distant future, a positive outcome we feel will see a 20% pop in the shares while failure probably a 15% pullback towards $6, not very exciting risk / reward on a coin flip.
The companies latest results were solid and its outlook in 2020 is ok, perhaps the best opportunity would to buy any panic sell-off below $6 on disappointing news from the courts.
MM is neutral / slightly positive TPM.
TPG Telecom (TPM) Chart
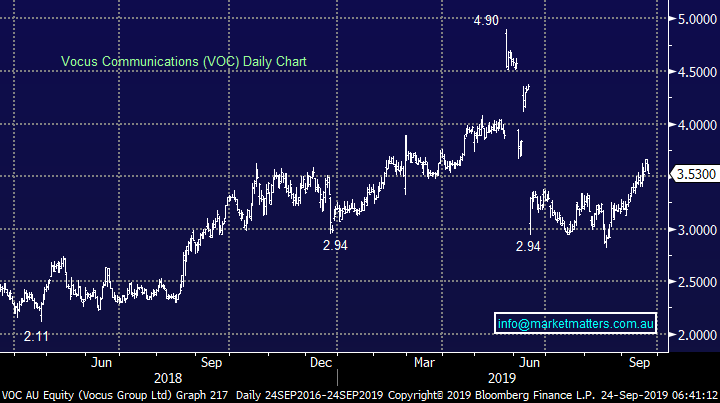
3 Vocus (VOC) $3.53
Vocus (VOC) has endured a number of failed bids in recent years which has led to some massive volatility in the shares. The business is stagnating at present on the earnings / profitability front and we see no reason to be a hero and pre-empt some internal improvements – the only obvious reason to go long is on the hope of yet another takeover bid.
MM is neutral VOC.
Vocus (VOC) Chart
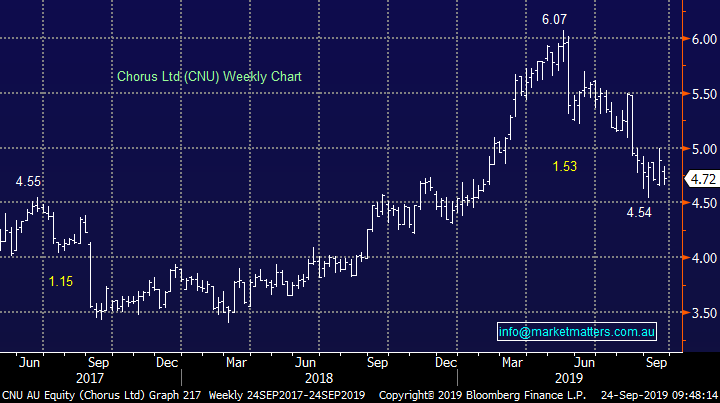
4 Chorus Ltd (CNU) $4.72
Lastly is NZ based CNU which has recently corrected 25% after a stellar few years – the stock is priced for growth although its 4.7% projected yield is attractive in today’s environment. However the telco delivered some relatively disappointing full-year numbers in late August although it appears the share price already had a sniff that all was not rosy. The net profit after tax (NPAT) came in above $50m which implies the share price had simply got ahead of itself rallying above $6.
Technically CNU looks interesting with stops below $4.40.
MM likes CNU around current levels.
Chorus Ltd (CNU) Chart
Conclusion (s)
Of the 4 Telco’s looked at today the only one MM would consider at current prices is NZ based CNU, although Telstra is slowly becoming more attractive.
Global Indices
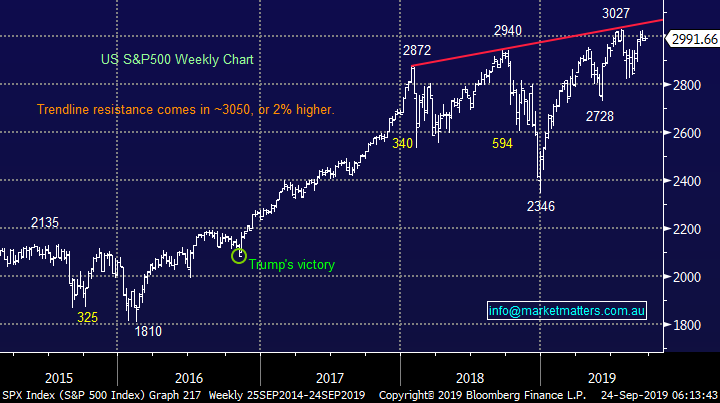
No major change yet, we are looking for a decent pullback for US stocks but no specific sell signals have been triggered – note at the moment we still feel a break to fresh all-time highs will fail to aggressively follow through to the upside.
US stocks remain clearly firm but with little upside momentum.
US S&P500 Index Chart
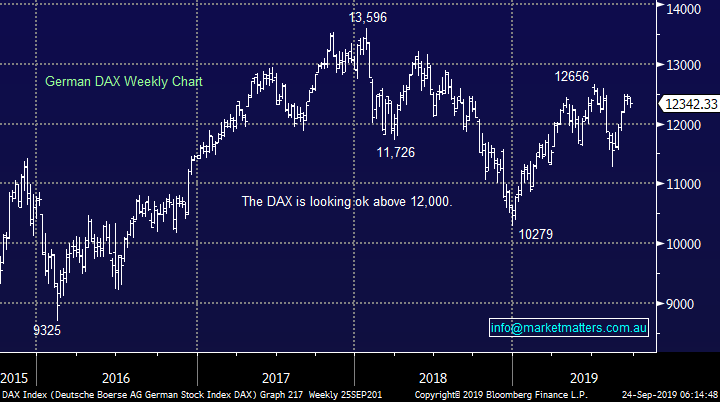
No change again with European indices, while we remain cautious European stocks as their tone has become more bearish over the last few months, however we had been targeting a correction of at least 5% for the broad European indices, this was achieved.
The long-term trend is bullish hence any “short squeezes” might be harder and longer than many anticipate, potentially one is currently unfolding.
German DAX 50 Chart
Overnight Market Matters Wrap
• The US equity market closed with little change overnight with trading volume lower than average despite exceeding manufacturing PMI consensus as investors remain on edge ahead of the planned trade talks between US and China next month.
• On the commodities front, the Saudis have reportedly restored 75% of lost oil production and could return to full production as soon as next week. This is in contrast to a media report that suggested it could take several months to fully restore operations.
• BHP is expected to underperform the broader market after ending its US session of an equivalent of 0.77% from Australia’s previous close.
• The December SPI Futures is indicating the ASX 200 to open with little change this morning, around the 6750 level.
Have a great day!
James & the Market Matters Team
Disclosure
Market Matters may hold stocks mentioned in this report. Subscribers can view a full list of holdings on the website by clicking here. Positions are updated each Friday, or after the session when positions are traded.
Disclaimer
All figures contained from sources believed to be accurate. All prices stated are based on the last close price at the time of writing unless otherwise noted. Market Matters does not make any representation of warranty as to the accuracy of the figures or prices and disclaims any liability resulting from any inaccuracy.
Reports and other documents published on this website and email (‘Reports’) are authored by Market Matters and the reports represent the views of Market Matters. The Market Matters Report is based on technical analysis of companies, commodities and the market in general. Technical analysis focuses on interpreting charts and other data to determine what the market sentiment about a particular financial product is, or will be. Unlike fundamental analysis, it does not involve a detailed review of the company’s financial position.
The Reports contain general, as opposed to personal, advice. That means they are prepared for multiple distributions without consideration of your investment objectives, financial situation and needs (‘Personal Circumstances’). Accordingly, any advice given is not a recommendation that a particular course of action is suitable for you and the advice is therefore not to be acted on as investment advice. You must assess whether or not any advice is appropriate for your Personal Circumstances before making any investment decisions. You can either make this assessment yourself, or if you require a personal recommendation, you can seek the assistance of a financial advisor. Market Matters or its author(s) accepts no responsibility for any losses or damages resulting from decisions made from or because of information within this publication. Investing and trading in financial products are always risky, so you should do your own research before buying or selling a financial product.
The Reports are published by Market Matters in good faith based on the facts known to it at the time of their preparation and do not purport to contain all relevant information with respect to the financial products to which they relate. Although the Reports are based on information obtained from sources believed to be reliable, Market Matters does not make any representation or warranty that they are accurate, complete or up to date and Market Matters accepts no obligation to correct or update the information or opinions in the Reports. Market Matters may publish content sourced from external content providers.
If you rely on a Report, you do so at your own risk. Past performance is not an indication of future performance. Any projections are estimates only and may not be realised in the future. Except to the extent that liability under any law cannot be excluded, Market Matters disclaims liability for all loss or damage arising as a result of any opinion, advice, recommendation, representation or information expressly or impliedly published in or in relation to this report notwithstanding any error or omission including negligence.