Is it time to buy the hammered iron ore stocks? (FMG, BHP, RIO, KDR, USD)
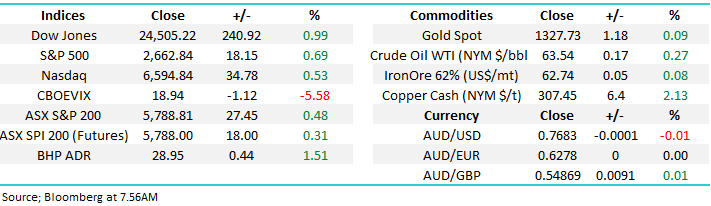
The ASX200 closed up +0.5% yesterday but importantly the very influential banking stocks are finally regaining their “mojo”, at least short-term. The Banking Index closed up +1.4%, noticeably outperforming the broad market for the first time in a long while. Remember:
· The Australian Banking sector was down close to 8% for Q1 of this year but when banks have a particularly poor Q1 the historical average return for April is an impressive +4.3%.
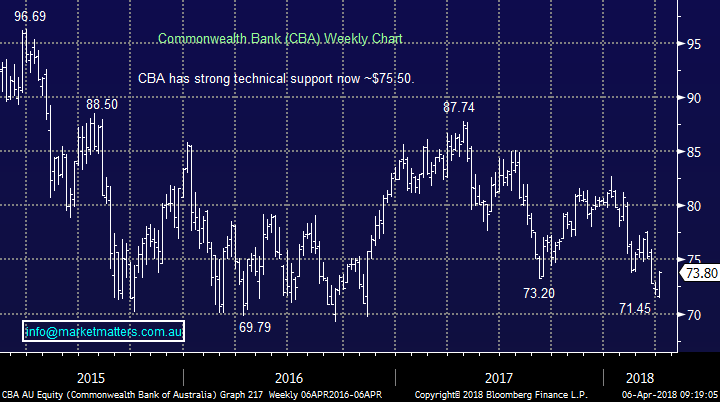
We remain bullish CBA from current levels targeting at least the $77.50 area, or 5% higher – an excellent bullish sign for the ASX200, at least for April.
Commonwealth Bank (CBA) Chart
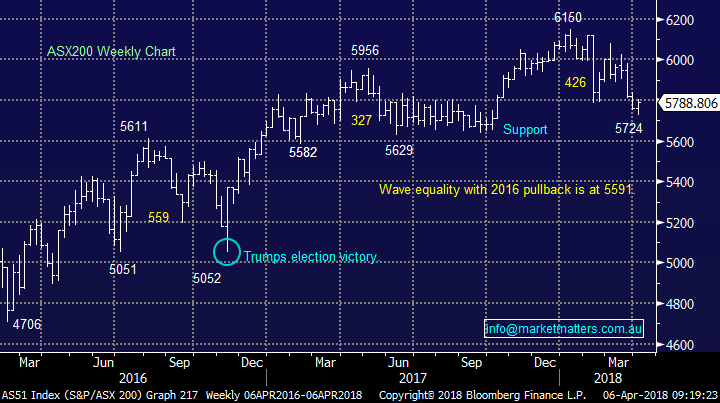
This week we’ve outlined our short-term bullish view for stocks and things are panning out as expected, leaving us comfortable with this opinion for now, however just as I tap away Trump has upped the ante on US / China trade tensions by now talking about $100 billion in additional tariffs on Chinese goods which has prompted a big ~1.4% sell-off in US Futures this morning, so despite the gains by global stocks overnight, our thought that the ASX200 would trade above the psychological 5800 level – up around 50-points / 1% for the week, will likely prove illusive.
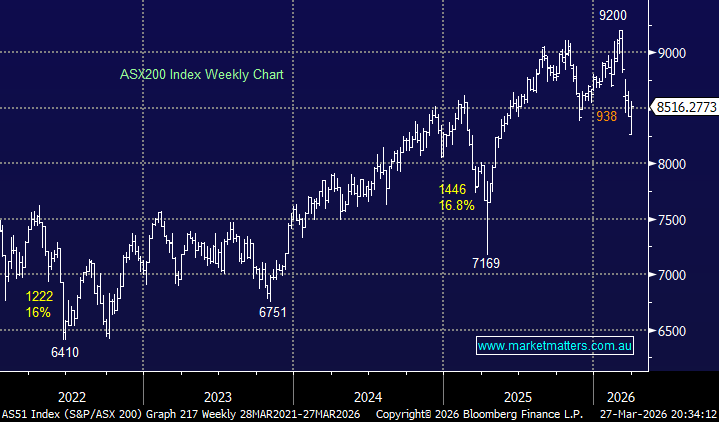
While our initial target for the market is 5825-5850 we still need a close back above 5900 before we can see a real possibility of a test of 2018 highs – this will certainly need strength from both the banks and resources. In other words, for the local market to enjoy a meaningful rally we need 2 currently unloved sectors to regain some love.
ASX200 Chart
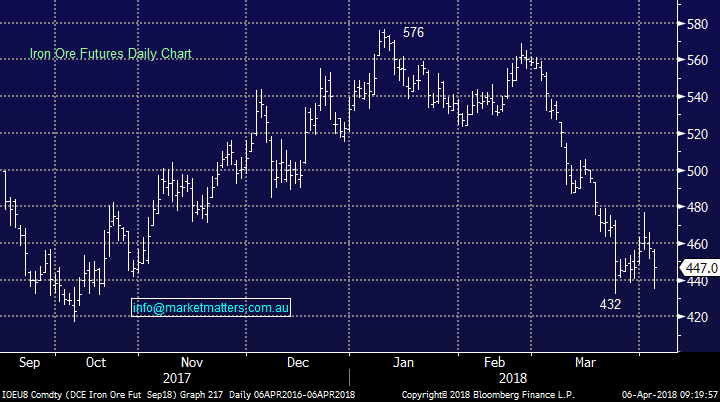
Today we are again going to look at the local iron ore sector which has been hit hard during the recent correction by global stocks. Yesterday Fortescue (FMG) fell to its lowest level since mid-2016, down over 20% since mid-February.
· Iron Ore closed yesterday -22% below its 2018 high on January 10th.
· The ASX200 closed yesterday -5.9% below its 2018 high, also on January 10th.
The correlation between iron ore and the ASX200 is very strong and in our opinion the main driving force, after the Royal Banking Commission, of the relative performance of the local market on the global stage.
Iron Ore Chart
The correction by iron ore was predicted by many economists although it clearly was not built into the respective share prices of the 3 major stocks with exposure to the bulk commodity given their corrections from earlier 2018 highs have been far larger than the overall market:
· BHP Billiton (BHP) -12.5%, Fortescue Metals (FMG) -22.7% and RIO Tinto (RIO) -12.4%.
However, when we look at the futures contracts moving forward some stability appears likely on the horizon with the December contract trading at basically the same level as todays spot price. Considering the correlation between iron ore and the ASX200 this implies the local market will at least hold its own on a relative basis for a short-term.
Hence, we ask ourselves has the Fear side of the elastic band stretched too far? At MM we continue to advocate the resources sector as only for the more active investor e.g. we spent 2 of the last 5-years with basically zero exposure to the resources sector and it certainly paid dividends while today we have a number of resource companies spread across our two portfolios.
Australian Miners Valuation Chart
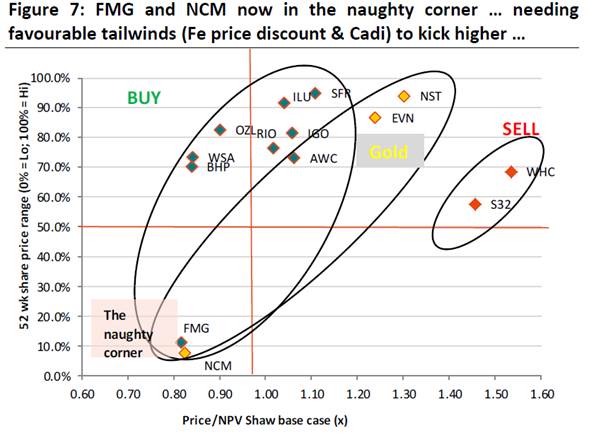
Source: Shaw and Partners
Can we find any value in the Iron Ore Sector?
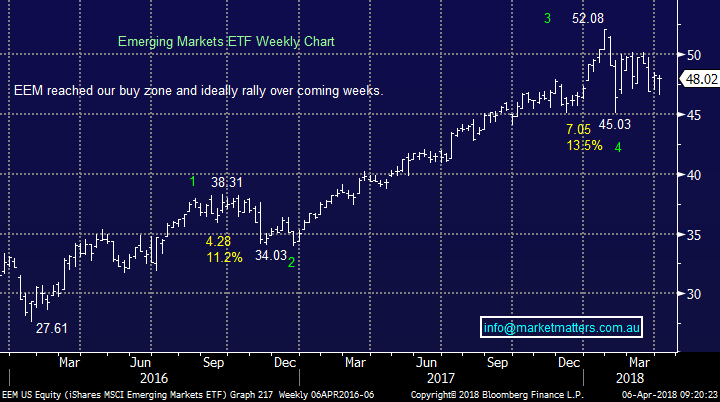
The question is simple - should we be buying this aggressive sell off in resources / iron ore stocks or looking for areas to sell our holdings? On a sector level we still believe they should rally moving forward with the highly correlated EEM ETF positioned well for a rally to fresh 2018 highs ~12% higher. This also coincides with our short-term bullish outlook for copper and crude oil but iron ore is much harder to call with some stability probably our preferred view – that said, technically we are bearish the $A which does not bode well for iron ore over 2018/19.
Emerging Markets (EEM) Chart
Moving onto the 3 specific stocks with iron ore exposure, two we are holding in the Growth Portfolio (BHP and RIO) and one FMG in the Income Portfolio.
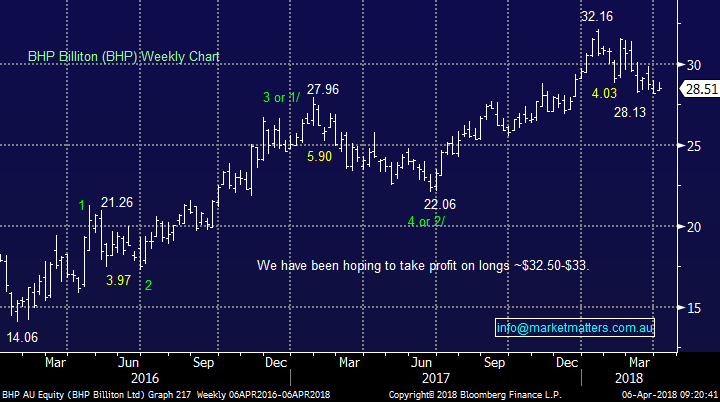
1 BHP Billiton (BHP)
BHP looks reasonable value below $28.50 trading on an estimated valuation of 12.8x while paying a 4.4% fully franked yield. BHP is our favourite of the 3 during this financial year due to its diversified commodities exposure.
· However, MM are currently sellers between $30 and $31.
NB This may be given more room if we sell RIO first.
BHP Billiton (BHP) Chart
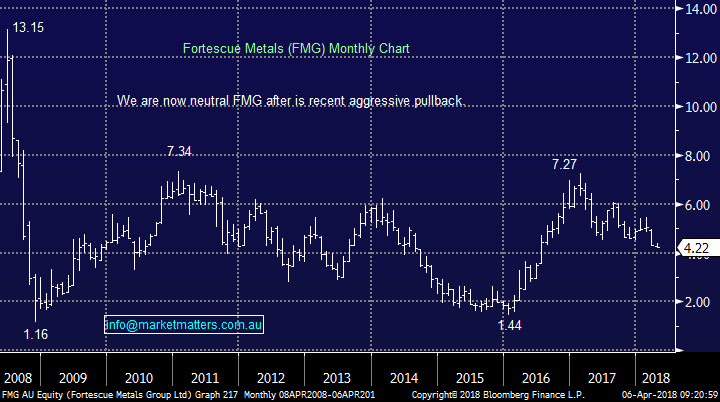
2 Fortescue Metals (FMG) $4.22
FMG has now been trading in a range between $1.16 and $7.34 since the GFC, testing both extremes on 2 occasions. Currently the stock is smack in the middle of the range. The current fully franked yield above 8% has caught many investors eye but it’s unlikely to be sustained if iron ore cannot recover.
· Technically we will consider selling any ~5% bounce.
An aggressive “Buy – Write” for the sophisticated yield chasing local investor could be considered at this juncture.
Fortescue Metals (FMG) Chart
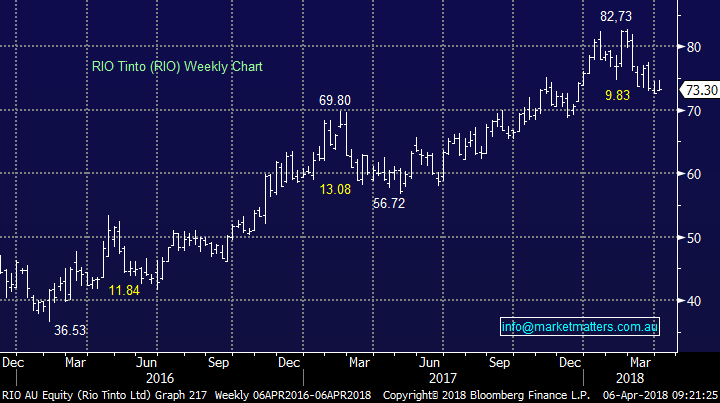
3 RIO Tinto (RIO) $73.30
RIO is now paying an attractive 5% fully franked dividend while trading on an undemanding 11.6x valuation. However, RIO has a significant exposure to iron ore which could quickly make these numbers look a lot less attractive.
· We will consider selling our position in the $77-77.50 region.
RIO Tinto (RIO) Chart
Two other important things have caught our eye in the last 24-hours:
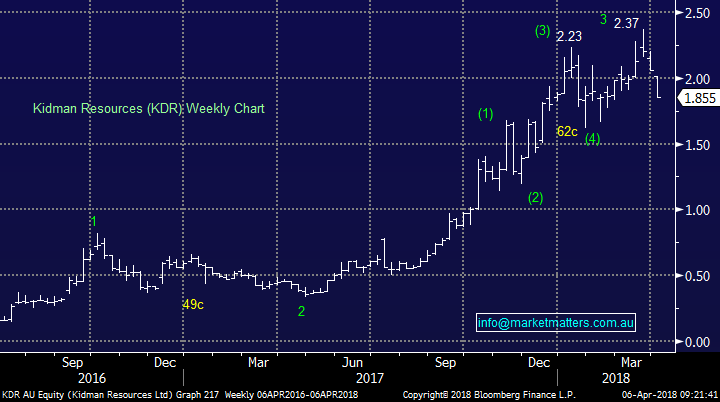
(1) Lithium stocks getting canned
We have had 2 very successful forays into the sector with Orocobre (ORE) and Kidman Resources (KDR) but our current holding in ORE is under water – hopefully not 3rd time unlucky.
We are again buyers of KDR below $1.70, an aggressive play but we like the sector and its over 20% below our previous exit price.
Kidman Resources (KDR) Chart
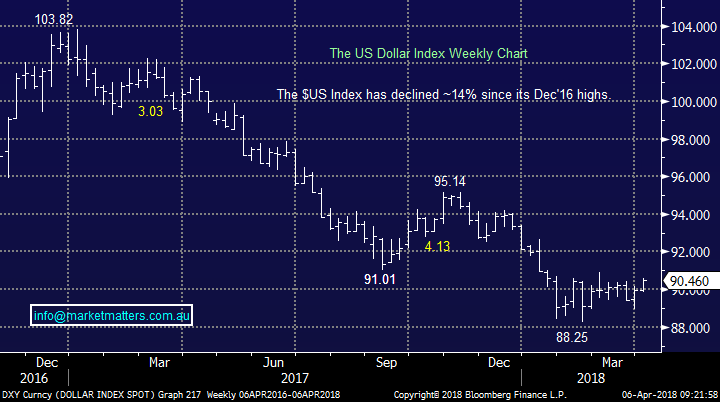
(2) Time to start buying the $US
We’ve talked about the $US since our “2018 outlook Piece” and so far, it’s tracked according to plan with the $US falling ~14%.
We now believe it’s time to step up start to accumulate the $US, while leaving enough room to average if the $US Index has one final spike down towards the 88 area.
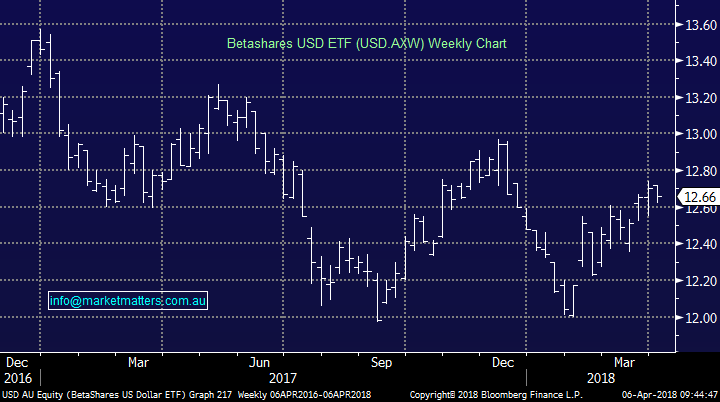
· We are buyers of $US BetaShares USD Dollar ETF**watch for alerts today**
The Betashares US Dollar ETF which trades under the code of USD.AXW. This fund is designed to track the movement of the $US against the $A. If the $US goes up by 10% versus the Aussie Dollar, then this fund will go up in value by that amount less the 0.45%pa fund fee that is charged by the product issuer, which in this case is Betashares.
There is no issue with liquidity in the fund – given market makers participate in the market and the underlying ‘hedge’ is the $US i.e no liquidity issues. The fund is bought on market like a normal share with the usual T+2 settlement, however trade closes at 4pm – not 4.10.
$US Index Chart
USD ETF Chart
Conclusion (s)
1. We are sellers into strength of the iron ore stocks as opposed to buyers of weakness.
2. We like KDR below $1.70.
3. We are buyers of $US with our first foray into the currency likely today
Overnight Market Matters Wrap
· The US equity markets closed higher on a less volatile trading session as US investors were buoyed by expectations that, despite all the rhetoric from both parties, the White House was open to negotiations with China which could avoid damaging tariffs.
· Commodities also had a stronger night, with across the board gains in oil and the base metals, with copper in particular well bid, up nearly 2% at us$3.06/lb.
· BHP is expected to outperform the broader market today after ending its US session up and equivalent of 1.51% higher from Australia’s previous close.
· The ASX 200 is expected to sell off early this morning following US President Trump’s recent comments RE the consideration of $100 Billion in New China Tariffs.
Have a great day!
James & the Market Matters Team
Disclosure
Market Matters may hold stocks mentioned in this report. Subscribers can view a full list of holdings on the website by clicking here. Positions are updated each Friday, or after the session when positions are traded.
Disclaimer
All figures contained from sources believed to be accurate. Market Matters does not make any representation of warranty as to the accuracy of the figures and disclaims any liability resulting from any inaccuracy. Prices as at 06/04/2018. 8.26AM
Reports and other documents published on this website and email (‘Reports’) are authored by Market Matters and the reports represent the views of Market Matters. The MarketMatters Report is based on technical analysis of companies, commodities and the market in general. Technical analysis focuses on interpreting charts and other data to determine what the market sentiment about a particular financial product is, or will be. Unlike fundamental analysis, it does not involve a detailed review of the company’s financial position.
The Reports contain general, as opposed to personal, advice. That means they are prepared for multiple distributions without consideration of your investment objectives, financial situation and needs (‘Personal Circumstances’). Accordingly, any advice given is not a recommendation that a particular course of action is suitable for you and the advice is therefore not to be acted on as investment advice. You must assess whether or not any advice is appropriate for your Personal Circumstances before making any investment decisions. You can either make this assessment yourself, or if you require a personal recommendation, you can seek the assistance of a financial advisor. Market Matters or its author(s) accepts no responsibility for any losses or damages resulting from decisions made from or because of information within this publication. Investing and trading in financial products are always risky, so you should do your own research before buying or selling a financial product.
The Reports are published by Market Matters in good faith based on the facts known to it at the time of their preparation and do not purport to contain all relevant information with respect to the financial products to which they relate. Although the Reports are based on information obtained from sources believed to be reliable, Market Matters does not make any representation or warranty that they are accurate, complete or up to date and Market Matters accepts no obligation to correct or update the information or opinions in the Reports.
If you rely on a Report, you do so at your own risk. Any projections are estimates only and may not be realised in the future. Except to the extent that liability under any law cannot be excluded, Market Matters disclaims liability for all loss or damage arising as a result of any opinion, advice, recommendation, representation or information expressly or impliedly published in or in relation to this report notwithstanding any error or omission including negligence.
To unsubscribe. Click Here