Is it time to be brave, or flock for the exit? (CYB, ALU, APT, XRO, NXT, ALL, CSL)
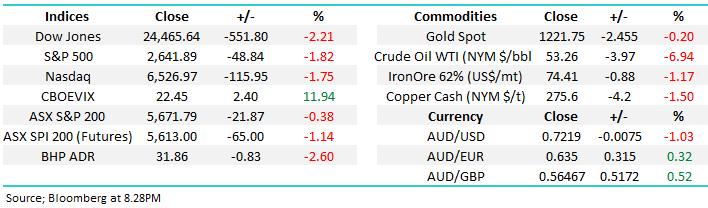
The ASX200 was weak yet again yesterday falling another 22-points / 0.4% with the Information / Technology Sector leading the decline falling almost -3% while only the financials closed in the black gaining +0.5%, all 7 major banks closing up on the day – we remain comfortable with our contrarian slightly overweight the banks position. However this morning will be a different story with UK operating bank CYB tumbling 17% in the UK illustrating perfectly the risks in buying a stock before they report and importantly why MM refrained from picking up any shares into weakness earlier this week, almost feels like someone had a “sniff” of the result.
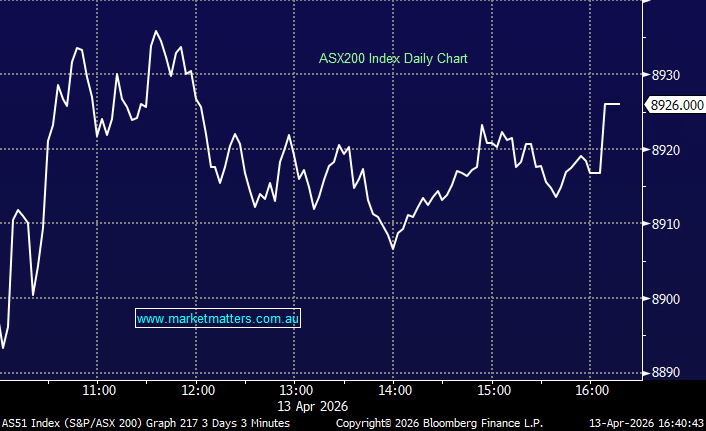
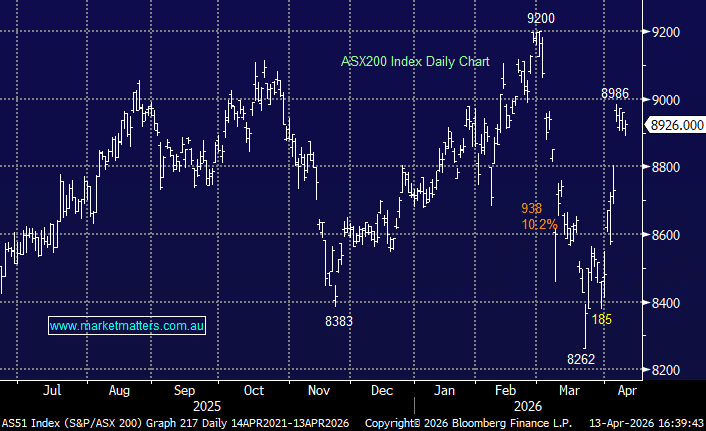
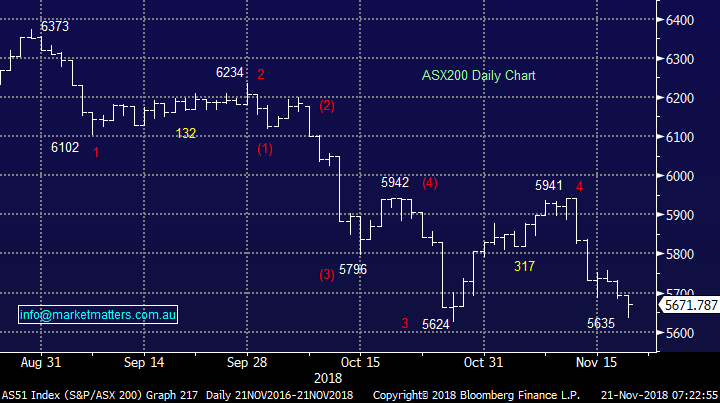
Our “Gut Feel” continues to believe the ASX200 is looking for a low before a decent rally into Christmas. The strong recovery yesterday from around 2.30pm adds weight from a technical perspective i.e. the downside momentum is declining as we approach the major 5600 support area. We believe buying this current weakness will pay dividends into 2019 but perhaps not too far beyond.
MM is now neutral / bullish the ASX200 as it approached the psychological 5600 area – we are looking to be buyers of this weakness.
Overnight US / European markets were again weak led by the Dow which fell 550-points / 2.2% with the Energy Sector witnessing the largest falls following a huge -7% drop in crude oil – the S&P500 Energy Sector fell -3.3%.
Today’s report is going to yet again look at 6 growth stocks as they continue to follow the tech-based US NASDAQ lower.
If we are correct and the local market is close to a Christmas rally the stocks who have been hammered the most have a strong chance of being in the outperformance column during the bounce i.e. the bearish elastic band to growth feels like it’s getting too tight.
MM is sitting in 7% cash in our Growth Portfolio following the sale of CIMIC (CIM) yesterday. From a risk / reward perspective we believe it’s time to increase our market exposure.
Watch for alerts
ASX200 Chart
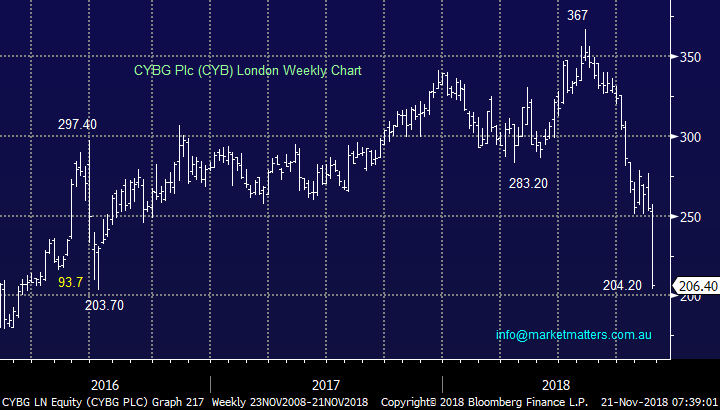
As touched on earlier the UK based bank CYB released a clearly disappointing profit report last night sending the stock down towards its all-time low. I can be cynical at times and when I look at the chart below I cannot help but question how much of a surprise this was for some, I know BREXIT is unfolding badly but not as much as the CYB share price implied.
Occasionally as most of you know we do rely on old fashioned “Gut Feel’ and this is the reason we didn’t buy this stock before its profit report.
Technically it looks good around these levels and we will consider switching part of our banking sector over to CYB once we have gone through their report in detail On initial read through two things stick out; CYB now trades at a ~20% discount to the value of its assets – incredibly cheap however last night’s result was poor, particularly the big deterioration in margins and the capitalisation of costs. The capitalisation of costs is the big one given the removal of ‘fat’ currently in the business has been the ‘bull case’ angle for CYB in recent times. For those interested, capitalisation of costs means that costs are not expensed during the period they were incurred but instead recognized over a period of time – basically makes the costs structure seem lower in the short term.
We ask ourselves, is it time to sell on rumour buy on fact for CYB?
CYBG Plc (CYB) Chart
The high growth / value sector
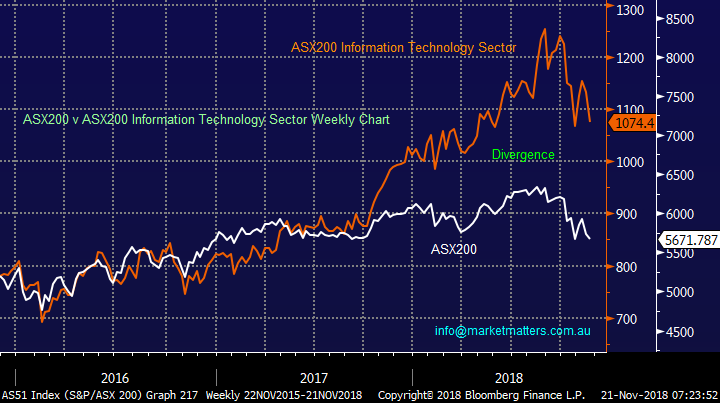
I’m sure it feels to many that the high value / growth stocks are a screaming buy and cannot fall any further but the following relative performance chart very clearly illustrates the sobering fact that they may have significantly further to decline in 2019-2020 – we have used the Information Technology (IT) Sector as a classic example.
However, in the short-term the picture is a little more positive and while we can see another 2-3% downside MM believes the next 10-15% is actually up – a view that coincides with our contrarian bullish short-term outlook for the ASX200.
If we consider the damage that the local Information Technology stocks have endured over recent months it’s not hard to imagine a sharp snap back rally but “do we have the courage to buy the out of favour sector?” – some of the corrections to-date make for scary reading:
Afterpay Touch (APT) – 52.7%, Xero (XRO) -29.5%, Wisetech (WTC) -40.5% and NEXTDC -30.8%.
Remember the famous quote which we put in these notes far too regularly – but today it seems relevant again:
"We simply attempt to be fearful when others are greedy and to be greedy only when others are fearful." – Warren Buffett.
ASX200 v AS51 Info Tech Sector Chart
6 high growth stocks – again!
Yesterday the growth stocks dominated the declines whether you looked at CSL Ltd (ASX: CSL) in the Healthcare space, Aristocrat (ASX: ALL) in Consumer Services or Xero (XRO) in the IT Sector.
We are looking to buy this sector in the coming days, just as we tried and failed with Appen (ASX: APX) yesterday.
We remain keen on APX into weakness and will maintain our BUY call around $12.50 with a 3% allocation
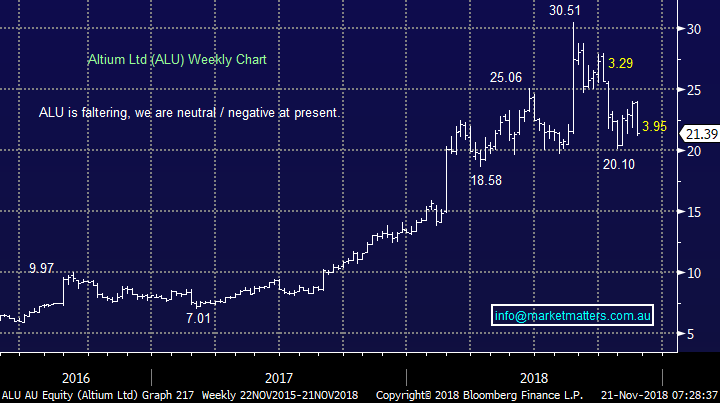
1 Altium Ltd (ASX: ALU) $21.39
Yesterday ALU was the second worst performer in the ASX200 falling -9.4% taking it within ~6% of its recent low. ALT develops design automation (EDA) software for Microsoft Windows and has enjoyed consistent growth in revenue over the last 6-years, impressive as its competitors have struggled.
Their goal is to dominate the PCB market (Printed circuit board) and the business is ticking all the correct boxes at present, the only issue was the shares were too expensive as investors chased GARP – “growth at any price”.
The recent 34% correction the stock has certainly helped address these valuation issues. We like the stock into weakness.
MM likes ALT around $20 for at least a 20% rally.
Altium Ltd (ASX: ALU) Chart
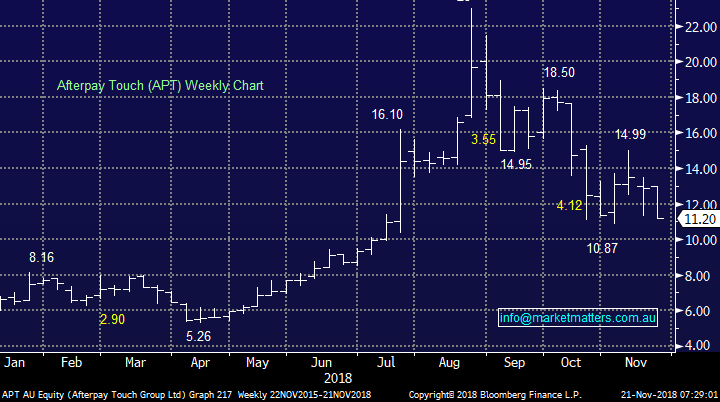
2 Afterpay Touch (ASX: APT) $11.26
MM has not been a large fan of APT and only a week ago we wrote the below:
“APT has corrected over 50% since late August as crazy valuations came down to earth with an inevitable thud however looking at APT’s valuation will still scare the majority (or it should!)
With the announcement of a potential Senate inquiry into “debt vultures”, payday lenders, lease-to-buy schemes and 'buy now, pay later' providers not covered by the banking royal commission the uncertainty / volatility around the stock is likely to be ongoing into 2019. A few recent broker downgrades hasn’t helped recently.
MM could consider APT as an aggressive buy below $10.50, or 10% lower.”
Well the stock is very likely to open close to that technical buy zone this morning.
MM will not be buying APT due to potential looming regulatory risks (think CYB on announcements) but the picture does suggest its time be bold and buy risk. Technically we like it.
Afterpay Touch (APT) Chart
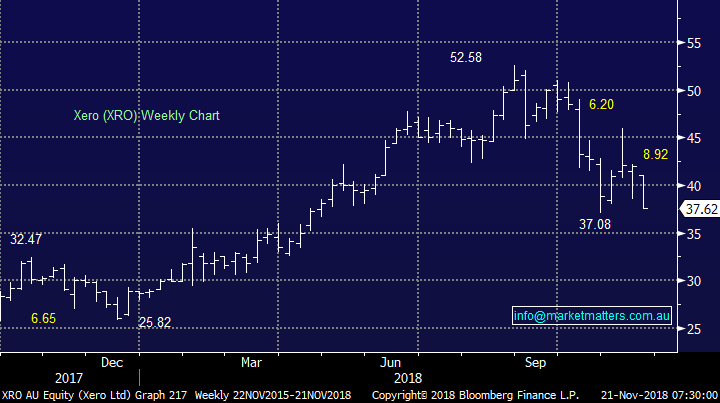
3 Xero (ASX: XRO) $37.62
Yesterday XRO tumbled -5.4% as the tech rout gathered momentum. Cloud accounting and business provider XRO has corrected almost -30% since the end of August but this is a quality business with sustainable growth. I love their product and the longer a user is on board, the more ‘sticky’ their revenue becomes.
The question is obviously what price to pay for this growth, a tumbling NASDAQ is certainly not helping sentiment around the stock – XRO has corrected 30% but technically will look good to us below $37 on a risk / reward basis, only ~2% more which is likely to be seen this morning.
We like XRO as a business and are considering buying the current weakness below $37.
Xero (XRO) Chart
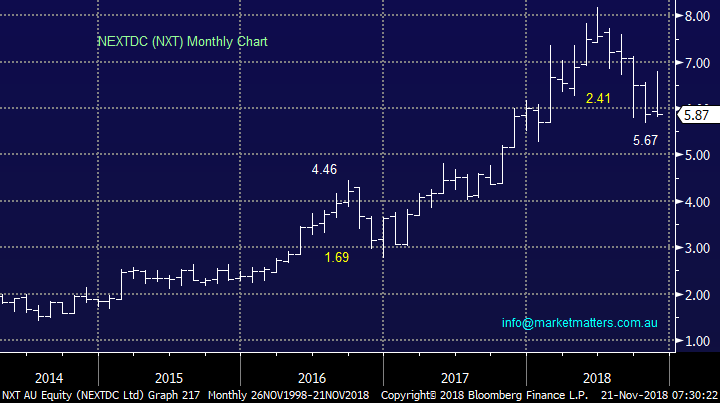
4 NEXTDC (ASX: NXT) $5.87
NXT develops data centres and was recently identified by management consultant Deloitte as very well positioned to benefit from the current growth in on-line data storage.
The company recently had to pull forward capex to satisfy demand, a great problem to have!
MM likes NXT into current weakness around $5.50.
NEXTDC (NXT) Chart
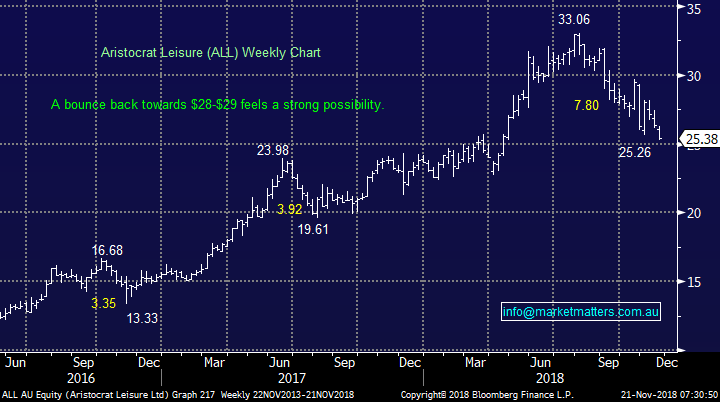
5 Aristocrat Leisure (ASX: ALL) $25.38
A quick update on ALL which we hold in the Growth Portfolio.
We are not panicking because we believe this is an excellent growth business which has been dragged lower by market / sector weakness.
We would be buying ALL below $25.50 if we held no position.
Aristocrat Leisure (ALL) Chart
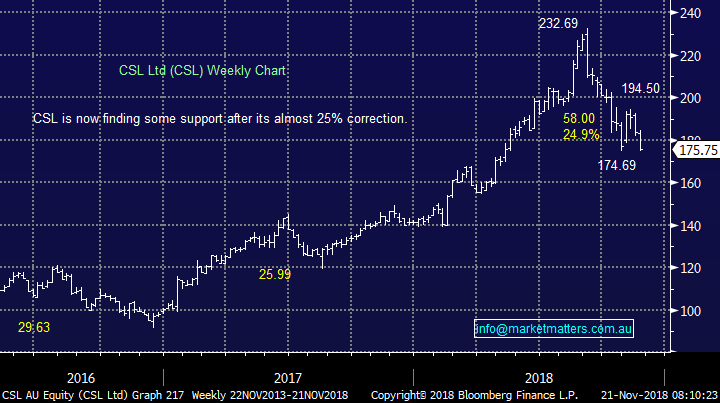
6 CSL Ltd (ASX: CSL) $175.75
Yesterday CSL was smacked -3.6% as a large holding was sold into the market i.e. a $251m stake was crossed at $175.50, an almost 25% correction to its 2018’s high.
MM purchased CSL following the Dow’s 800-point plunge in October, this has proven a touch premature in hindsight.
However, MM is still relatively confident of taking a small profit on this position closer to $195.
CSL Ltd (CSL) Chart
Conclusion
We are now bullish stocks from around current levels with the out of favour growth sector our preferred basket for a relatively sharp recovery.
Our preferred stocks into weakness are Appen (APX), Altium (ALU), Xero (XRO) and NEXTDC (NXT) – we are likely to buy a basket of stocks to remove stock specific risk in these times of uncertainty.
Overseas Indices
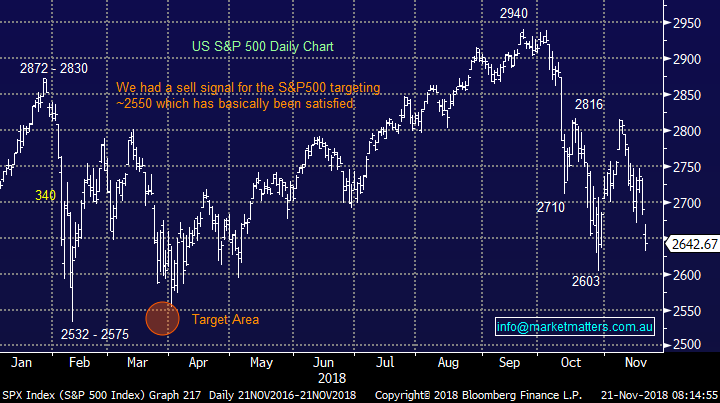
The US S&P500 is now testing our short-term target, we are now bullish from a risk / reward perspective.
US S&P500 Chart
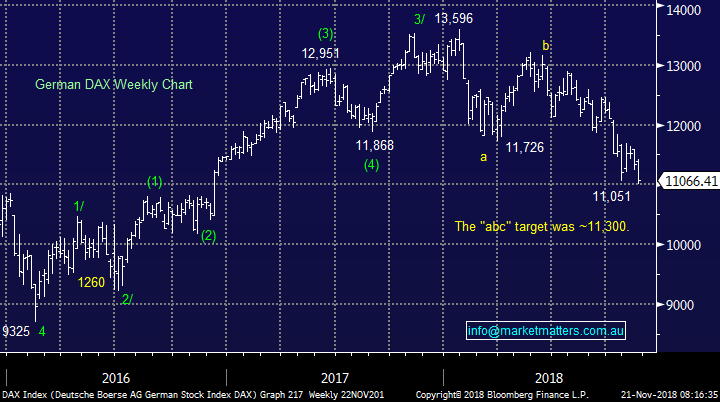
European indices are now also neutral with the German DAX hitting our target area which has been in play since January.
German DAX Chart
Overnight Market Matters Wrap
· A sea of red continues to be seen across the globe with the US maintaining its concerns on US/China trade wars and slowing earnings growth outlook.
· All 3 major US indices have now erased their gains for the year after this quarter’s wipe out. Little was spared with the tech sector once again under pressure as Apple slumped nearly 5%.
· BHP is expected to underperform the broader market, after ending its US session down an equivalent of 2.60% from Australia’s previous close.
· The December SPI Futures is indicating the ASX 200 to open 67 points lower testing the 5600 level this morning.
Have a great day!
James & the Market Matters Team
Disclosure
Market Matters may hold stocks mentioned in this report. Subscribers can view a full list of holdings on the website by clicking here. Positions are updated each Friday, or after the session when positions are traded.
Disclaimer
All figures contained from sources believed to be accurate. Market Matters does not make any representation of warranty as to the accuracy of the figures and disclaims any liability resulting from any inaccuracy. Prices as at 21/11/2018
Reports and other documents published on this website and email (‘Reports’) are authored by Market Matters and the reports represent the views of Market Matters. The MarketMatters Report is based on technical analysis of companies, commodities and the market in general. Technical analysis focuses on interpreting charts and other data to determine what the market sentiment about a particular financial product is, or will be. Unlike fundamental analysis, it does not involve a detailed review of the company’s financial position.
The Reports contain general, as opposed to personal, advice. That means they are prepared for multiple distributions without consideration of your investment objectives, financial situation and needs (‘Personal Circumstances’). Accordingly, any advice given is not a recommendation that a particular course of action is suitable for you and the advice is therefore not to be acted on as investment advice. You must assess whether or not any advice is appropriate for your Personal Circumstances before making any investment decisions. You can either make this assessment yourself, or if you require a personal recommendation, you can seek the assistance of a financial advisor. Market Matters or its author(s) accepts no responsibility for any losses or damages resulting from decisions made from or because of information within this publication. Investing and trading in financial products are always risky, so you should do your own research before buying or selling a financial product.
The Reports are published by Market Matters in good faith based on the facts known to it at the time of their preparation and do not purport to contain all relevant information with respect to the financial products to which they relate. Although the Reports are based on information obtained from sources believed to be reliable, Market Matters does not make any representation or warranty that they are accurate, complete or up to date and Market Matters accepts no obligation to correct or update the information or opinions in the Reports. Market Matters may publish content sourced from external content providers.
If you rely on a Report, you do so at your own risk. Past performance is not an indication of future performance. Any projections are estimates only and may not be realised in the future. Except to the extent that liability under any law cannot be excluded, Market Matters disclaims liability for all loss or damage arising as a result of any opinion, advice, recommendation, representation or information expressly or impliedly published in or in relation to this report notwithstanding any error or omission including negligence.