Is it time for the Phoenix to fly over momentum? (LLC, BHP, WOW, WTC, CSL, SGM, ING, WPL)
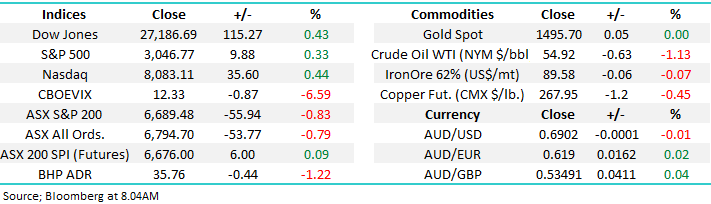
The ASX200 endured a bad day at the office yesterday finally closing down over -0.8% with almost 70% of the market closing in the red. Every sector in the index closed lower and when the banks plus major resources both succumb to selling pressure in tandem the local index is destined to struggle. A few pundits blamed the severity of the drop on the Australian CPI Inflation data that reduced optimism for another rate cut on Melbourne Cup day. However, stocks were already falling at 11.30 am when the data was released and post the 0.5% CPI print the more inflation sensitive bond yields and the $A was fairly muted - it was an inline how-hum number in my opinion.
Our view at MM is the RBA won’t cut rates again until at least a few months into 2020, we’ve already got rates at their lowest level in history following Octobers cut to 0.75%, simple common sense says to me that the Australian central bank wants to see the results of their endeavours to-date before contemplating cutting again to 0.5%. Get Christmas out of the way and February / March would be our target months if the RBA remains unhappy with Australia’s economic growth and of course the inflation rate which they, like most major central banks, are struggling to reignite post the GFC. Our opinion remains that government stimulus would be a lot more useful to our economy – they should be backing up the truck and borrowing money at these rates to build infrastructure and support economic expansion that way – this would provide a lot more benefit than further rates cuts by the RBA, but time will tell what 2020 holds on that front.
Overnights the US Fed cut interest rates for the 3rd time this year but they implied that was it for now, remember they had previously described these cuts as a mid-cycle adjustment, a label which doesn’t sit too comfortably our end as they’ve basically dropped rates by 30%! Their rhetoric has gone from “act as appropriate to sustain the expansion” to “continue to monitor”, in other words let’s wait and see into at least Q1 of 2020. With their unemployment at a 50-year low and assuming the US – China trade issue is solved they may be done with this cycle of cuts, however after an initial sell off by equities following the cut, they did rally into the close while the USD sold off – why?
In Chairman Powell’s news conference post the announcement he focussed heavily on the Fed’s 2% inflation target which is not being met. My take was that while the enormous tailwind of declining interest rates might be fading into the distance, any rate hikes are very much off the table until inflation comes back into play which could be a long way off. There was a train of thought a trade resolution could ultimately lead to the Fed hiking rates however this now seems Powell took that off the table overnight. This fits our view of rates being lower for longer, although they’ve likely already seen their low. While the obvious thought here is, if rate cuts are done what will drive equities higher, the other side of the equation is stability at low levels is also supportive.
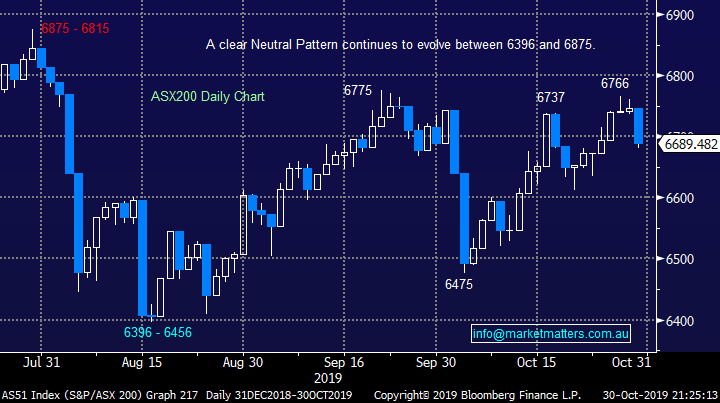
As we’ve mentioned over the last few days the break of 6730 by the ASX200 is a negative technical signal targeting a pullback towards the 6600 area, now just over 1% lower.
Short-term MM is now bearish the ASX200 targeting the 6600 area.
I had a quick chat on CNBC yesterday afternoon about the fate of the $US, a theme we’ve been writing about of late.

Overnight global stocks rallied but not in a major way after the Fed cut rates, the Dow advanced +0.4%, this morning the ASX200 looks to open up around 10-points although the resources look likely to be a headwind early on in the session.
This morning MM has looked at a few stocks that have risen from the ashes like a phoenix in the past and more importantly candidates for 2020, plus in contrast a few momentum plays where some passengers are clearly disembarking the train in earnest.
ASX200 Chart
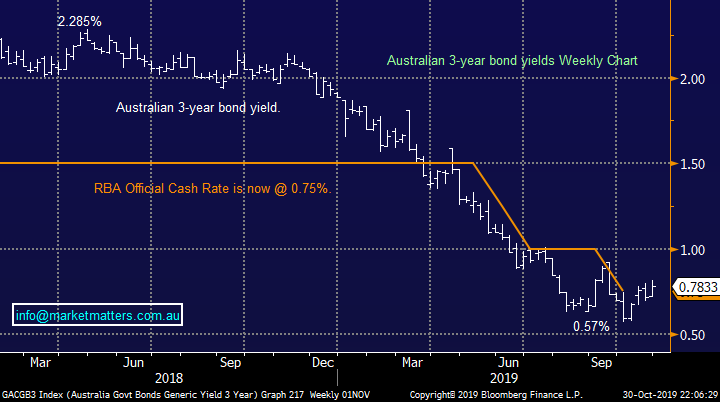
The local 3-year bond yield continues to grind higher after making fresh all-time lows a few weeks ago. Our belief is the aggressive decline in rates since mid-2018 is over and a prolonged period of sideways consolidation is likely. Hence stocks that have got ahead of themselves in anticipation of a continued falls in interest rates look likely to underperform into Q1 of 2020.
MM believes local bond yields will continue to rotate around the current RBAS cash rate.
Australian 3-year Bond Yield Chart
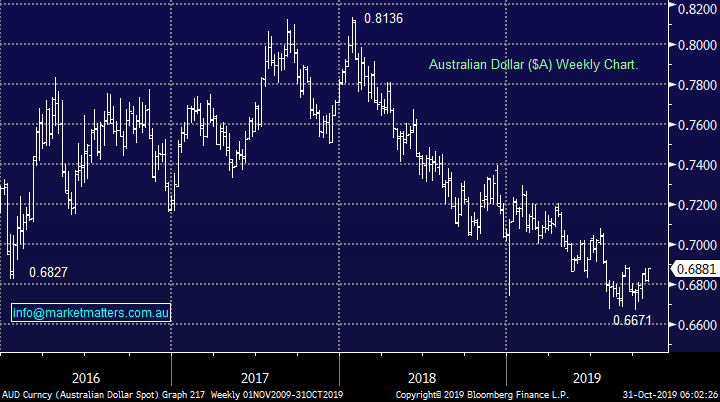
With the Australian CPI inflation data and US Fed’s decision on interest rates now behind us, we’ve seen the Australian dollar ($A) continue to slowly recover from its multi-year low, testing 12-week highs while I type and at this stage we remain comfortable with our standout contrarian bullish call on the $A targeting the 80c region.
Importantly remember when the $A rallies the ASX has been underperforming recently, this feels a likely contributing reason behind yesterday’s strong sell-off.
Australian Dollar ($A) Chart
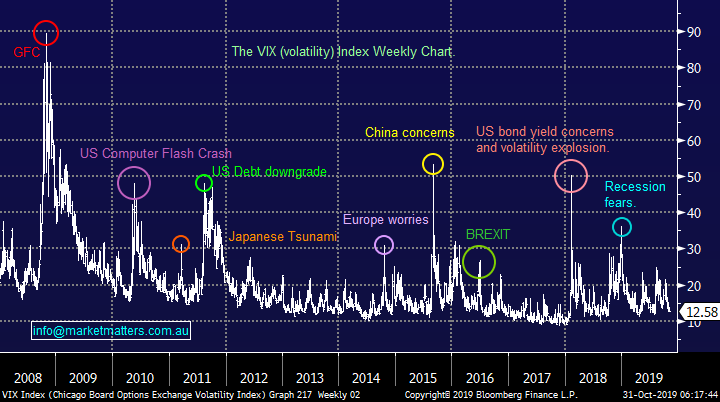
The lack of major surprises by the Fed has sent the Fear Gauge (VIX) down towards its February lows showing markets are very comfortable with the direction of the US – China trade talks. At this stage we feel a new macro-economic concern needs to surface before we will see the VIX trade closer to 20% than 10%, let alone the over 30% level we’ve seen twice in the last 2-years.
MM sees no reason to expect a breakout in volatility at this stage – a potentially concerning state of mind!!
The Volatility (VIX) Index Chart
**ANZ has just released FY earnings numbers and it looks light on, about 3.5% miss, dividend flat but franking cut to 70%**

Is time to look for the next phoenix?
As downgrades wash through our market fund managers are adopting an if in doubt stay out approach to a number of “higher risk” stocks but we should remember not to “throw the baby out with the bathwater”. Just because we’ve see some large downgrades from the likes of Costa Group (CGC), Sims Metals (SGM) and Bega Cheese (BGA) this month it doesn’t mean all recovery stories will fail while others that are being ignored /overlooked may surprise on the upside i.e. the crowd can often be wrong.
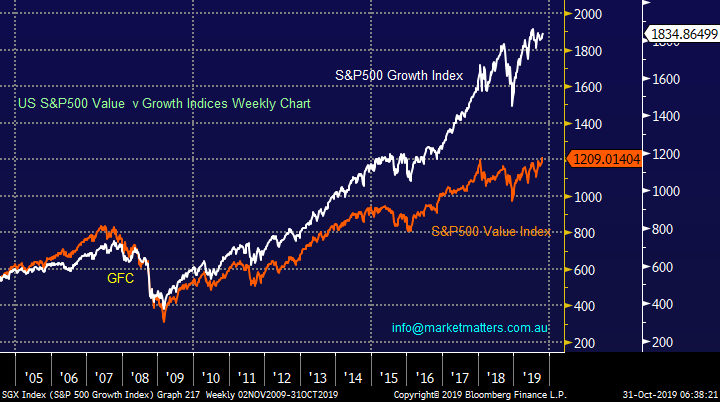
As we’ve discussed previously MM is looking for some mean reversion from the growth v Value elastic band into 2020 and beyond, this implies we believe the bear market for interest rates is reaching its conclusion. However, by definition this also implies we are entering a phase where the market characteristics are likely to change in a number of areas, not just our favourite: MM prefers the Value Index over Growth into 2020.
We believe this is an opportune time to keep scouring the market bottom dwellers – the value elastic band will always get stretched too far in both directions due to those large motivating human emotions – “Fear & Greed”.
S&P500 Growth & Value Indices Chart
1 Previous recovery stories
We don’t have to look too far for 3 great examples of major ASX companies that have gone from villain to hero in recent years, both medium and longer-term.
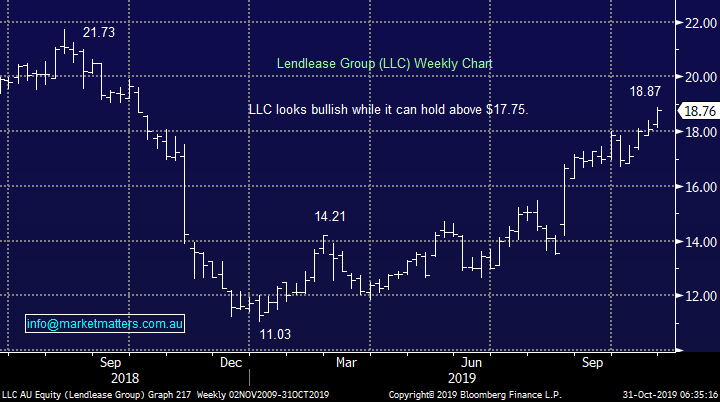
1 – Property business Lendlease (LLC) could do no right in 2018 with the stock almost halving into Christmas but its recovery has been dramatic in 2019 with shareholders enjoying gains of well over 70%.
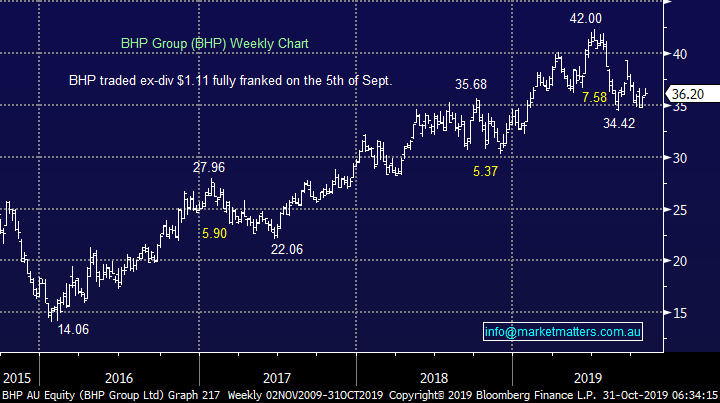
2 – BHP Group (BHP) has earned the nickname of the “Big Australian” and it’s been a cornerstone of our index for many years – its currently 5.6% of the ASX200. In early 2016 the stock was almost hated by local investors as it first halved and then almost halved again post the GFC when most stocks were rallying. However, as we often see things go too far and its now tripled in the last 3-years.
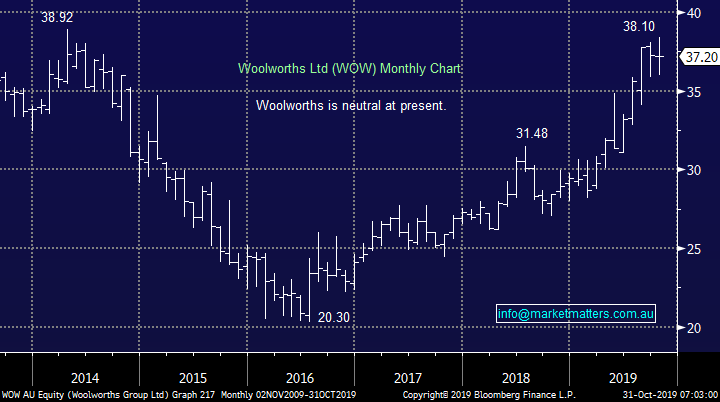
3 – Woolworths was slammed between 2014 and 2016 as investors almost panicked about the influence by overseas competition on its nice fat margins but as is often the case things weren’t as bad as feared and the stock recovered strongly.
These are not isolated incidents, many industries are cyclical in nature, especially depending on their external economic influences hence at times they become bargains for the contrarian investor.
Lend Lease Group (LLC) Chart
BHP Group (BHP) Chart
Woolworths (WOW) Chart
2 Momentum stocks coming off the boil
MM has decried the high valuation momentum stocks over recent months and slowly but surely, we feel this view is being vindicated.
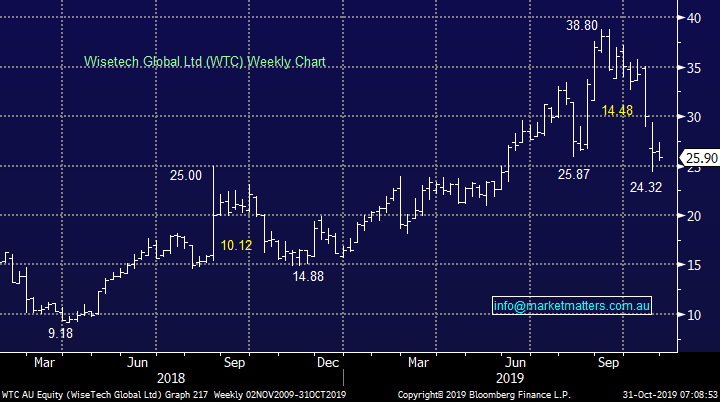
1 – A number of the core momentum plays in our IT sector have started to unravel recently with Wisetech (WTC) for example falling almost 40%. The risk / reward still has MM preferring the sidelines with regard to this group.
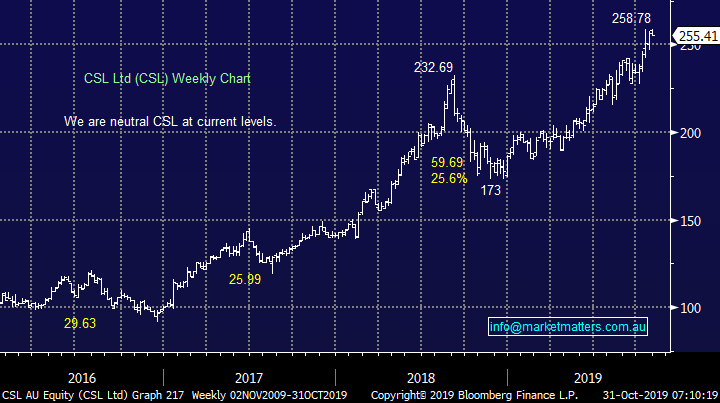
2 – An inclusion to spark some discussion, current market darling CSL, an amazing company but is it worth almost $260? The stock was dumped unceremoniously with the growth story in late 2018 when we jumped onboard before surging this year, unfortunately we took $$ on this one too early. The stock corrects between 10 - 20% annually almost like clockwork, this is a business we like but not at today’s levels. We feel the markets complacently long and another decent correction will unfold in 2020 providing a better entry opportunity. MM still has no interest in the high valuation momentum stocks.
NB We were spoilt for choice here with other candidates including a2 Milk (A2M) and Afterpay (APT).
Wisetech Global (WTC) Chart
CSL Ltd (CSL) Chart
3 Three potential recovery stories
Below are 3 stocks who have not enjoyed recent times but where we believe value might just be emerging in the bigger picture – we are looking for stocks priced for disaster as opposed to perfection hence if nothing further goes wrong they’ll prove to be very cheap:
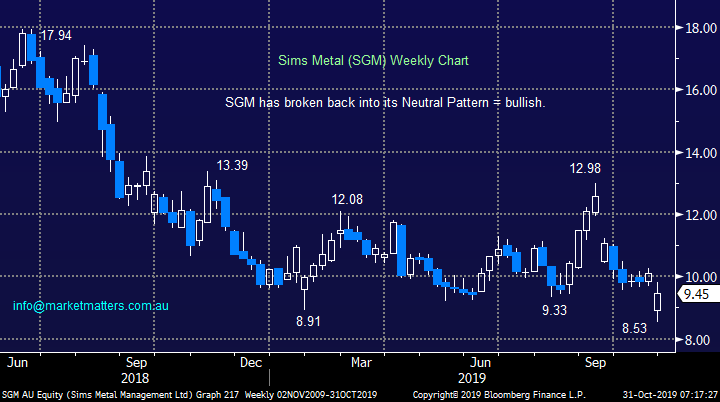
1 – Sims Metals (SGM) has almost halved since mid-2018 primarily due to a decline in scrap ferrous metal prices. If we are correct and the $US is set to fall plus global fiscal stimulus is around the corner this could easily be the time to buy SGM for a bumpy but profitable ride – a 4% fully franked yield should help the patient.
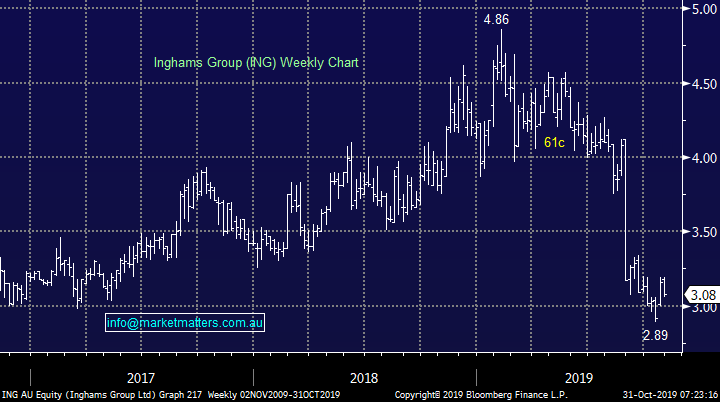
2 – Ingham’s (ING) is struggling in 2019 like much of the food sector this year, its tough out there on a number of fronts. We are in no hurry just yet and fresh lows would not surprise but we feel solid value is presenting itself for this poultry business plus again a ~6% fully franked yield should help those who are prepared to remain patient.
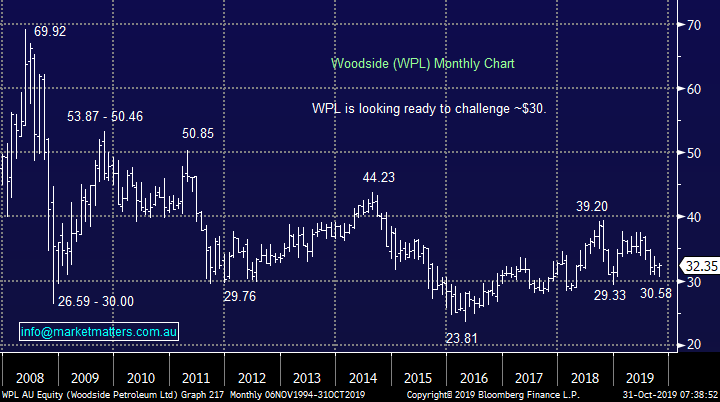
3 – Australia’s major energy producer Woodside (WPL) is still trading down 50% from its pre-GFC highs. We think the companies 5% fully franked yield is attractive and we like the stock ~$31, or 4% lower.
Sims Metal (SGM) Chart
Ingham’s Group (ING) Chart
Woodside (WPL) Chart
Conclusion (s)
While we have Woodside (WPL) in our income portfolio, we are considering the 3 stocks touched on above as we remain comfortable considering market strugglers.
Global Indices
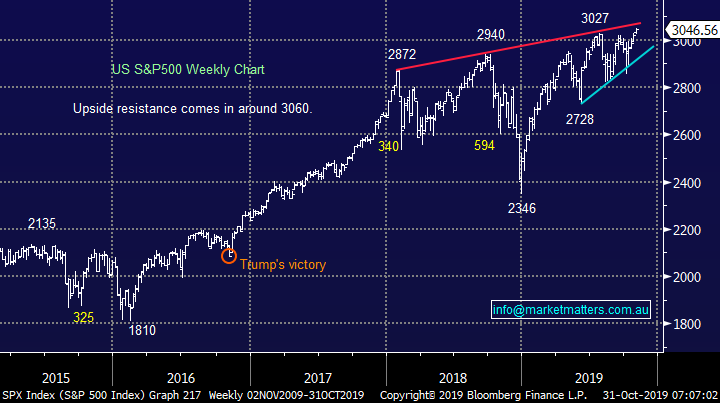
No change, we had given the benefit of the doubt to the post GFC bull market and fresh all-time highs have been achieved as anticipated but major resistance is now less than 1% away reverting us to a neutral stance. However, a break back under 3000 is required to switch us to a bearish short-term stance.
MM is now neutral US stocks.
US S&P500 Index Chart
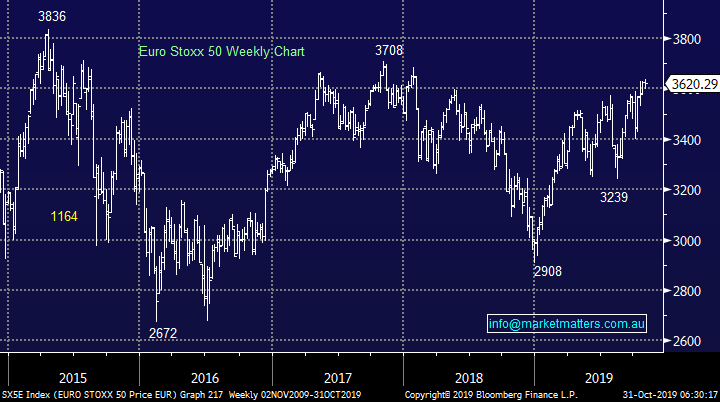
European indices continue to “climb a wall of worry” at this point in time MM is neutral but we maintain our slight positive bias.
Euro Stoxx50 Chart
Overnight Market Matters Wrap
- The US equity markets hit an all-time high overnight following the Fed Reserve reducing its key interest rate by 0.25% with Chairman Jerome Powell noting, “rate hikes won’t occur as long as inflation remains persistently cool.”
- Metals on the LME didn’t quite follow the same tune with copper and nickel trading lower, closing down 0.45% and 0.27% respectively. Iron ore was had little change, while crude oil was off 1.13%.
- BHP is expected to follow the LME’s group performance after ending its US session off an equivalent of 1.22% from Australia’s previous close.
- The December SPI Futures is indicating the ASX 200 to open 15 points higher this morning, around the 6705 level with the index currently above the red line for the month, up 0.02% at present.
Have a great day!
James & the Market Matters Team
Disclosure
Market Matters may hold stocks mentioned in this report. Subscribers can view a full list of holdings on the website by clicking here. Positions are updated each Friday, or after the session when positions are traded.
Disclaimer
All figures contained from sources believed to be accurate. All prices stated are based on the last close price at the time of writing unless otherwise noted. Market Matters does not make any representation of warranty as to the accuracy of the figures or prices and disclaims any liability resulting from any inaccuracy.
Reports and other documents published on this website and email (‘Reports’) are authored by Market Matters and the reports represent the views of Market Matters. The Market Matters Report is based on technical analysis of companies, commodities and the market in general. Technical analysis focuses on interpreting charts and other data to determine what the market sentiment about a particular financial product is or will be. Unlike fundamental analysis, it does not involve a detailed review of the company’s financial position.
The Reports contain general, as opposed to personal, advice. That means they are prepared for multiple distributions without consideration of your investment objectives, financial situation and needs (‘Personal Circumstances’). Accordingly, any advice given is not a recommendation that a particular course of action is suitable for you and the advice is therefore not to be acted on as investment advice. You must assess whether or not any advice is appropriate for your Personal Circumstances before making any investment decisions. You can either make this assessment yourself, or if you require a personal recommendation, you can seek the assistance of a financial advisor. Market Matters or its author(s) accepts no responsibility for any losses or damages resulting from decisions made from or because of information within this publication. Investing and trading in financial products are always risky, so you should do your own research before buying or selling a financial product.
The Reports are published by Market Matters in good faith based on the facts known to it at the time of their preparation and do not purport to contain all relevant information with respect to the financial products to which they relate. Although the Reports are based on information obtained from sources believed to be reliable, Market Matters does not make any representation or warranty that they are accurate, complete or up to date and Market Matters accepts no obligation to correct or update the information or opinions in the Reports. Market Matters may publish content sourced from external content providers.
If you rely on a Report, you do so at your own risk. Past performance is not an indication of future performance. Any projections are estimates only and may not be realised in the future. Except to the extent that liability under any law cannot be excluded, Market Matters disclaims liability for all loss or damage arising as a result of any opinion, advice, recommendation, representation or information expressly or impliedly published in or in relation to this report notwithstanding any error or omission including negligence.


