Is it now time to Switch Resources to Banks? (RHC, BLD, TLS, BHP, NAB)

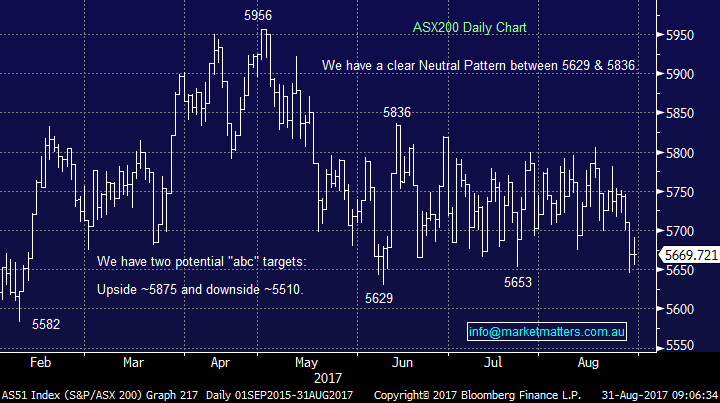
While the market managed to close marginally in the black yesterday, it was a pretty disappointing performance even after taking into account Telstra’s dividend which took almost 10-points off the ASX200. On Tuesday, the local market was smacked pretty hard following North Korea’s reckless actions around Japan but following the Dow’s strong recovery to close up over 50-points most market players anticipated a far stronger performance from the local market.
Weakness was relatively evenly spread with the banks, consumer services, diversified financials, health care and telco sectors all trying to drag the ASX200 into the red. Following Tuesday’s move to increase our position in Newcrest Mining (NCM) / gold exposure, we were very pleased to the see the sector close in the black even though gold has fallen ~$US15/oz. since North Koreas rocket launch, a good initial sign.
Following on from yesterday’s report we are again going to look at 3 stocks that caught our eye yesterday as individual stock volatility remains elevated, plus we are going to look at the current spread between the Australian banking sector and the in-favour resources, while asking the question “are sentiment swings approaching an extreme?”
ASX200 Daily Chart
US Stocks
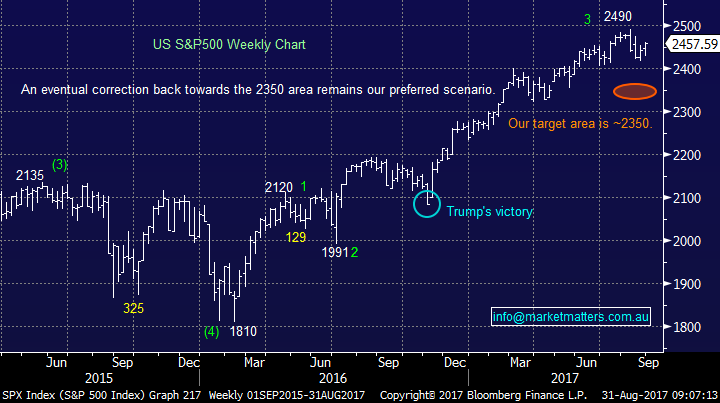
US equities continued with their recent strength adding just under 0.5% overnight, with gains across most sectors. It feels like investors / traders who went short following the recent North Korea shenanigans have been forced to lick their wounds.
We continue to remain mildly bearish US stocks targeting a correction of ~5% over coming weeks / month as sell signals continue to slowly emerge.
US S&P500 Weekly Chart
European Indices
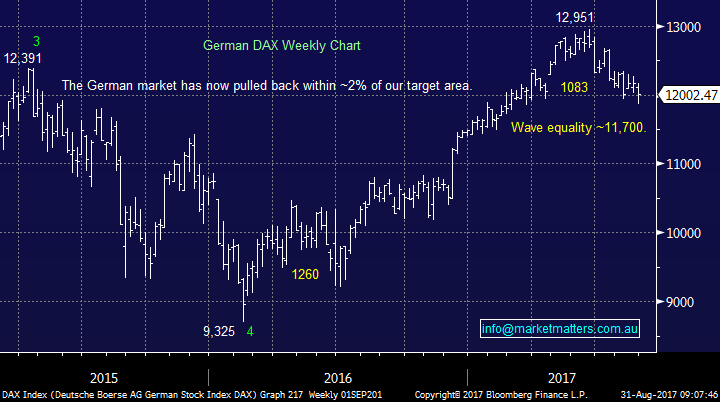
European stocks bounced ~0.5%, in-line with US stocks overnight, but they remain well over 7% below their 2017 highs.
We continue to see a little further downside for European stocks but they are rapidly approaching the area where we will switch from bearish to neutral / bullish.
German DAX Weekly Chart
1 Ramsay Healthcare (RHC) $68.10
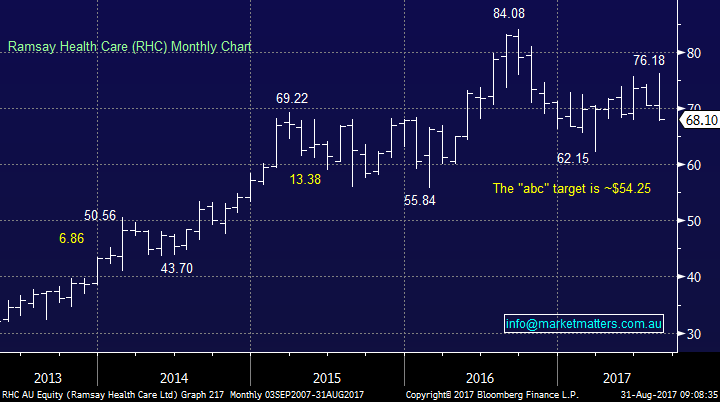
RHC reported a solid 12.7% increase in core net profit yesterday to $542.7m, while also adding that it expected its core earnings to increase between 8 and 10% through to June 2018 – which was a downgrade to prior guidance. However, as we have seen a few times recently, when a stock is “priced for perfection” it’s often enough to excite investors and the stock fell 5.3% for the day – RHC is currently trading on a 23.6x for 2018, compared to Healthscope (HSO) on 17x over the same period.
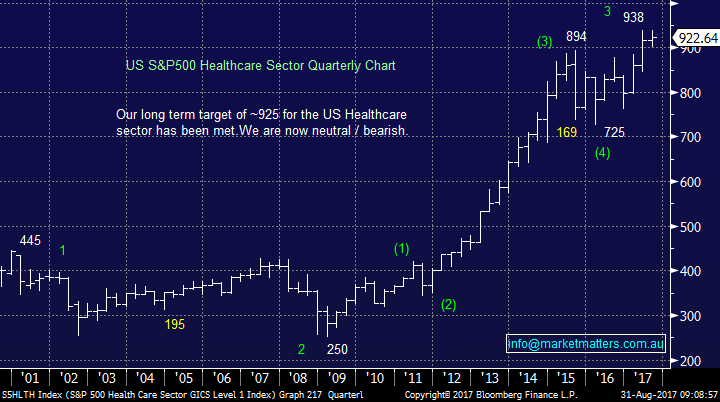
We like RHC as a business but simply believe it’s too expensive at current levels, especially considering our caution with the US Healthcare sector. At this stage, we want to see RHC under $60 before we get interested.
Ramsay Healthcare (RHC) Monthly Chart
US S&P500 Healthcare Sector Quarterly Chart
2 Boral (BLD) $6.63
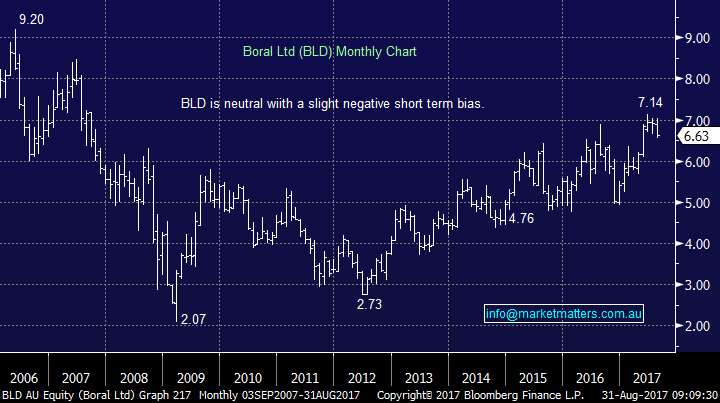
Boral was the other major name who reported on the penultimate day of earnings season, and the stock dropped almost 3% following its profit numbers. BLD announced a full-year net profit of $297m, a 16.7% increase on last year.
We are neutral / negative BLD at current levels.
Boral Ltd (BLD) Monthly Chart
3 Telstra (TLS) $3.60
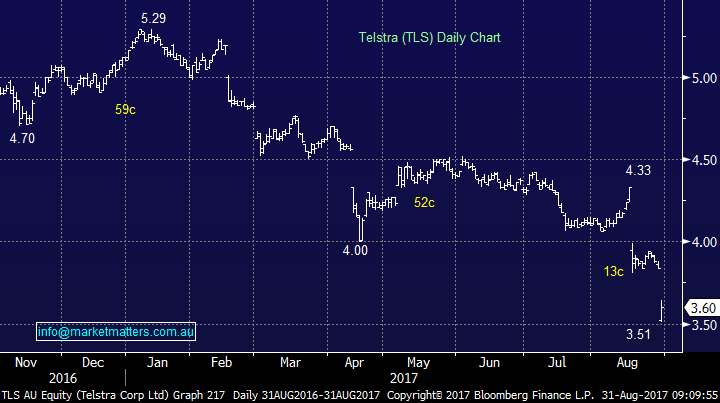
A few months ago, when we sold TLS in the $4.30s and declared the stock had firmly become an active investing vehicle a number of subscribers were confused how their high yielding stock was expected to present so many opportunities - yesterday proved us correct as it traded close to 20% below our exit level.
Yesterday, Telstra traded at a 5-year low for 2 reasons:
1. TLS traded ex-dividend 15.5c fully franked.
2. TLS announced that NBN Co. has scuppered its plans to monetise up to $5.5bn worth of future income from the NBN compensation / access payments.
Clearly not a good day for TLS, but we believe the selling is getting overdone and we increased our position to 7.5% yesterday under $3.60, while receiving the healthy dividend on our initial purchase at $3.85. How much damage has the NBN done to the Australian telco sector!?
We continue to believe TLS remains an active investment vehicle that can now be bought on weakness and sold into strength with the goal of picking up healthy dividends.
Telstra (TLS) Daily Chart
4 Banks v Resources
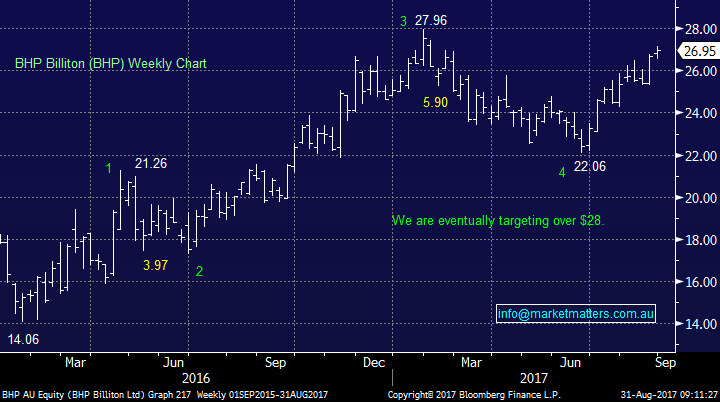
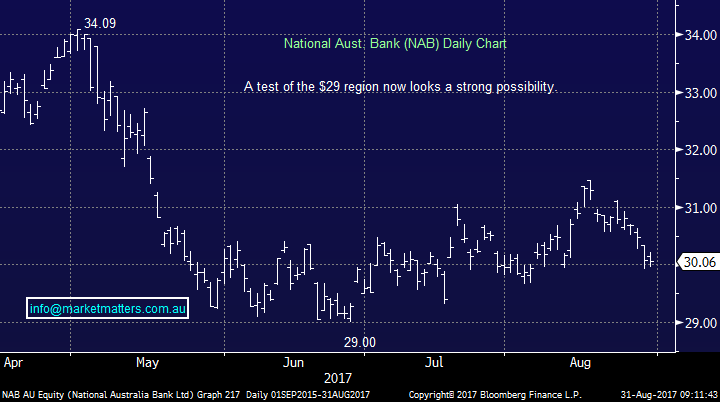
Over the last month, banks have slipped out of favour while most resource stocks have powered ahead, so we thought it was an opportune time to consider whether the elastic band had become too stretched between the respective sectors, as it has done a few times over recent years. Individually we looked at BHP and NAB simply because they have a similar share price:
1. BHP remains bullish targeting fresh 2017 highs over $28.
2. ANZ looks vulnerable to another 3-4% weakness to test its 2017 lows.
A simple conclusion, the outperformance from the resources v banks looks to have further to unfold however we are getting to the pointy end of the relative trade. A rotation will happen at some point.
BHP Billiton (BHP) Weekly Chart
National Australia Bank (NAB) Daily Chart
Conclusion (s)
1 We have no current interest in RHC or BLD.
2 We continue to believe TLS will be an excellent active investing vehicle over the coming years.
3. The recent outperformance from the resources sector now has further to unfold, however we are vigilant for signs of rotation
Overnight Market Matters Wrap
· A stronger than expected read on US 2nd quarter growth of 3% and renewed focus on corporate tax cuts to 15% helped boost the US major indices overnight.
· The stronger US growth numbers also helped the US$ rally, leading the A$ lower towards US79.06c and raised expectations of a further rate hike later this year.
· Oil prices were once again lower with crude oil down 1.03% as the devastating impact of Hurricane Andrew on refinery shutdowns affected sentiment. Most other key commodities were slightly lower.
· The September SPI Futures is indicating the ASX 200 to open 8 points higher, towards the 5680 level this morning.
Disclosure
Market Matters may hold stocks mentioned in this report. Subscribers can view a full list of holdings on the website by clicking here. Positions are updated each Friday.
Disclaimer
All figures contained from sources believed to be accurate. Market Matters does not make any representation of warranty as to the accuracy of the figures and disclaims any liability resulting from any inaccuracy. Prices as at 31/08/2017. 8.00AM.
Reports and other documents published on this website and email (‘Reports’) are authored by Market Matters and the reports represent the views of Market Matters. The MarketMatters Report is based on technical analysis of companies, commodities and the market in general. Technical analysis focuses on interpreting charts and other data to determine what the market sentiment about a particular financial product is, or will be. Unlike fundamental analysis, it does not involve a detailed review of the company’s financial position.
The Reports contain general, as opposed to personal, advice. That means they are prepared for multiple distributions without consideration of your investment objectives, financial situation and needs (‘Personal Circumstances’). Accordingly, any advice given is not a recommendation that a particular course of action is suitable for you and the advice is therefore not to be acted on as investment advice. You must assess whether or not any advice is appropriate for your Personal Circumstances before making any investment decisions. You can either make this assessment yourself, or if you require a personal recommendation, you can seek the assistance of a financial advisor. Market Matters or its author(s) accepts no responsibility for any losses or damages resulting from decisions made from or because of information within this publication. Investing and trading in financial products are always risky, so you should do your own research before buying or selling a financial product.
The Reports are published by Market Matters in good faith based on the facts known to it at the time of their preparation and do not purport to contain all relevant information with respect to the financial products to which they relate. Although the Reports are based on information obtained from sources believed to be reliable, Market Matters does not make any representation or warranty that they are accurate, complete or up to date and Market Matters accepts no obligation to correct or update the information or opinions in the Reports.
If you rely on a Report, you do so at your own risk. Any projections are estimates only and may not be realised in the future. Except to the extent that liability under any law cannot be excluded, Market Matters disclaims liability for all loss or damage arising as a result of any opinion, advice, recommendation, representation or information expressly or impliedly published in or in relation to this report notwithstanding any error or omission including negligence.
To unsubscribe. Click Here


