Is “Doctor Copper” going to lead resources lower?
Yesterday was a pretty disappointing day for local stocks with the ASX200 closing down 2-points after enjoying solid gains earlier in the day and peaking up 31-points just before lunch. The broad market continues to remain of particular concern with only the banks and heavyweight resource stocks preventing deeper losses. Today BHP is set to open down well over 1% so this support will need to come from different areas to avoid greater losses from this morning’s session. The main game remains sector rotation and this is currently where MM’s is striving to add value to both our portfolios, and obviously to that of subscribers. Recent activities illustrates this perfectly:
1 On Tuesday sold Wesfarmers (WES) ~$42.30 and bought CYBG Plc (CYB) ~$4.62 – this switch is currently around 4% ahead.
2 Yesterday we sold BHP ~$27.60 and are ideally looking to allocate these funds into some market weakness, with the banks / diversified financials as the likely lucky candidates - BHP is set to open 1.5% below our exit today.
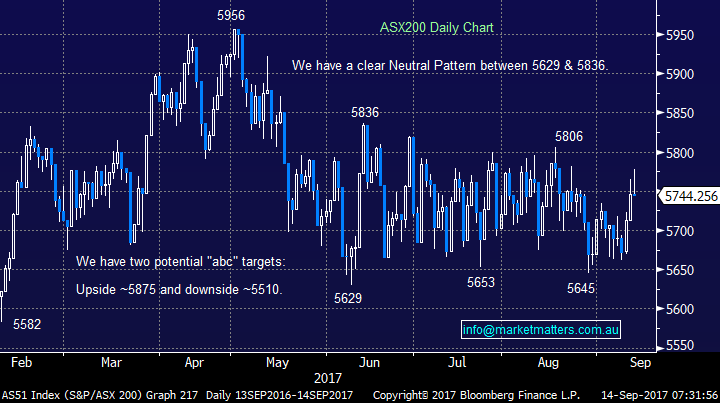
We remain concerned short-term that a 5% decline towards 5500 is due for the ASX200 especially when we simply stand back and look at 2017 - so far we are up only 2% while the Dow is up 12.1% over the same period. It’s hard to envisage us holding up if the US market has a simple small / healthy correction. Technically if the ASX200 closes back under the psychological 5700 area any recent bullish sentiment will have vanished.
ASX200 Daily Chart
US Stocks
US equities were quiet overnight although the S&P500 closed with 6 out of the 10 sectors negative, with the only real strength coming from the energy plays.
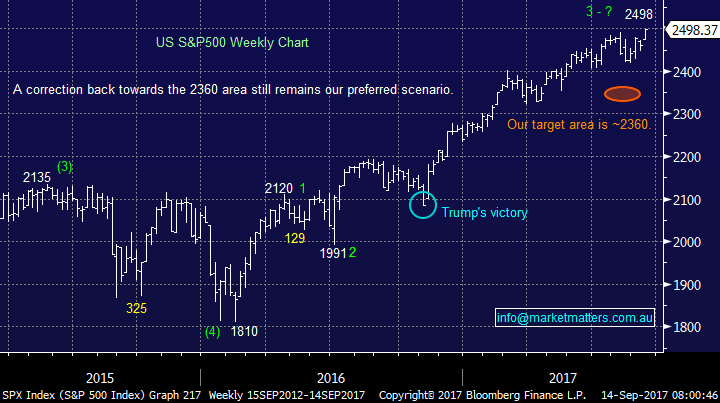
There is no change to our short-term outlook for US stocks, we are targeting a ~5% correction i.e. around 130-points by the S&P500.
US S&P500 Weekly Chart
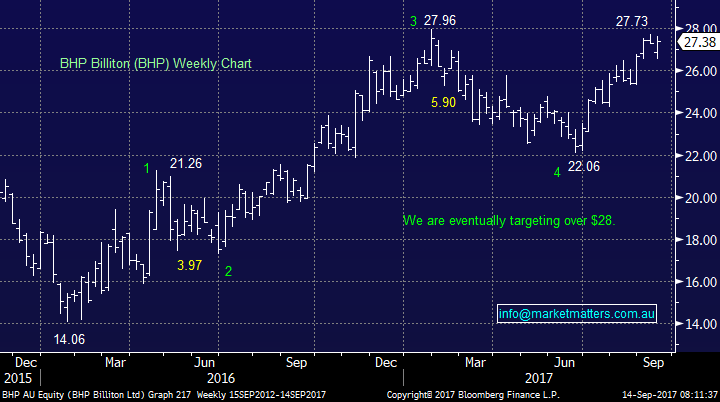
The resources sector has enjoyed a phenomenal run since February 2016 with heavyweight BHP more than doubling during this period. However as we have mentioned a few times BHP has corrected 18.7% and 21.1% over this period at different stages. We took a nice 17% profit on latest recent purchase of BHP yesterday and feel it’s now time to be underweight / out of the sector, especially as the majority has turned bullish since reporting season. Importantly we still believe in the reflation trade and eventually anticipate buying back into the likes of BHP and RIO but hopefully at lower levels, another ~20% correction would not surprise.
BHP Billiton (BHP) Weekly Chart
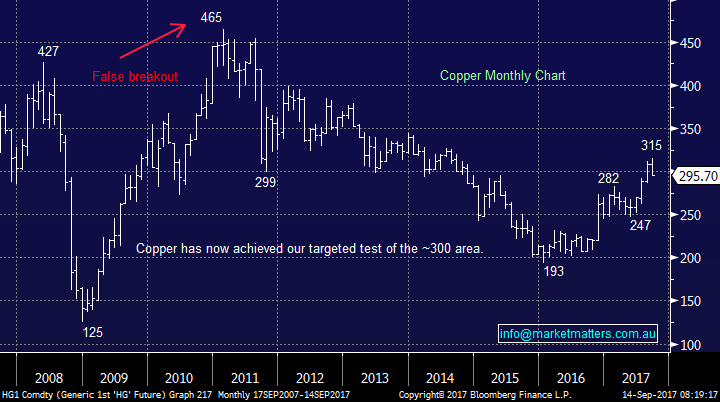
Copper has really caught our eye over the last few days as its fallen over 6% in relatively quick time. We will not turn negative this leading economic indicator until it falls under $US280/lb, still another 5% lower, but now it’s reached our +$US300/lb target we are 50-50 on this base metal and this helps to support our call to lighten resources.
Understanding “Doctor Copper”
People often say this particular base metal is reputed to have a Ph.D. in economics because of its ability to predict turning points in the global economy. Due to copper's widespread applications in most sectors of the economy - from homes and factories, to electronics and power generation and transmission - demand for copper is often viewed as a reliable leading indicator of economic health. This demand is reflected in the market price of copper. Generally, rising copper prices suggest strong copper demand and hence a growing global economy, while declining copper prices may indicate sluggish demand and an imminent economic slowdown.
Hence economists often turn to copper to predict how the global economies are moving and generally a weak copper price is bad news for stocks and especially the resources sector – fund managers will be watching carefully after this week’s steep losses. We are 50-50 copper at current levels and a 15% correction towards $US250/lb would not surprise, putting this into perspective it would only represent a 50% pullback of the gains since early 2016, back to levels we were at just 3-months ago.
Copper Monthly Chart
While we remain positive global reflation the goal is to be positioned to buy a decent correction in our preferred resource stocks assuming the potential weakness in copper / commodities does unfold. Today we have focused on 2 major Australian copper players where we have enjoyed some good returns from in 2017, specifically identifying our current optimum buy levels:
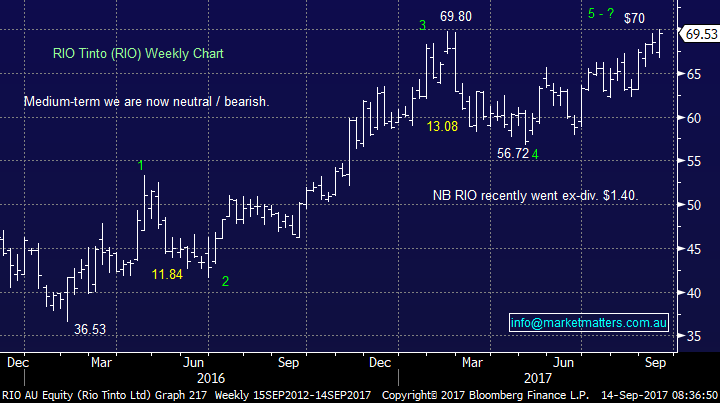
1 RIO Tinto (RIO) $69.53 – RIO hit our $70 target yesterday turning us short-term neutral / bearish the stock, a view we currently like considering the optimism around the sector. Our current buy level is ~$60, or 14% below yesterdays close.
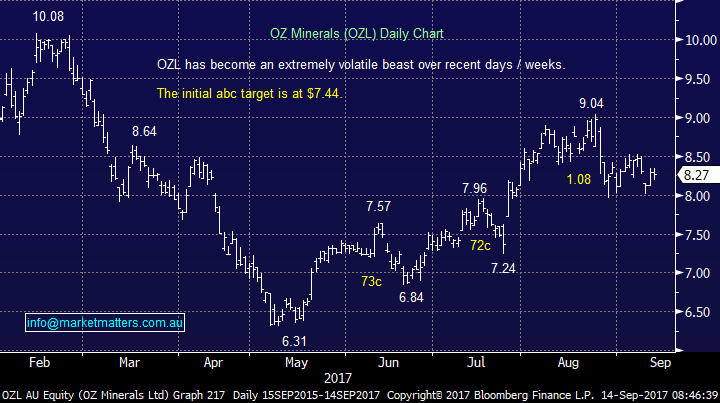
2 OZ Minerals (OZL) $8.27 – OZL has become very volatile of late which can work in our favour if we are looking to buy weakness. Our initial by level is ~$7.50, or 9.3% below yesterdays close but considering the stocks volatility we would only advocate buying ½ size here maintaining some ammunition to buy any deeper sell off.
RIO Tinto (RIO) Weekly Chart
OZ Minerals (OZL) Daily Chart
Conclusion (s)
We are now neutral / negative resources stocks short-term with ideal buy levels for RIO at $60 and OZL under $7.50. We may tinker with these levels as markets unfold over coming weeks.
Overnight Market Matters Wrap
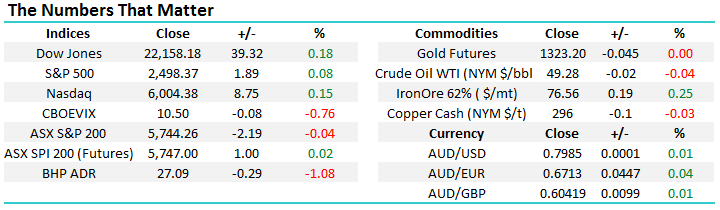
· Oil prices rebounded overnight after the release of a report from the International Energy Agency (IEA) suggesting global oil surpluses should continue to shrink in the face of increasing demand and OPEC oil cuts.
· The benchmark Brent price recovered 1.5% to close above US$55/bbl for the first time in about 5 months while US prices closed in on US$50/bbl , despite a recovery in US production and rising stockpiles, as the impact of the recent hurricanes receded.
· Other commodities were weaker with copper leading the fall, back below $3/lb, while iron ore was steady around US$76.50/t. Both BHP and RIO fell 1.5% in US trading and the A$ slipped back below us80c.
· The local markets will be watching today for the August labour data, with unemployment forecast to rise slightly from 5.6%-5.7%.
Disclosure
Market Matters may hold stocks mentioned in this report. Subscribers can view a full list of holdings on the website by clicking here. Positions are updated each Friday.
Disclaimer
All figures contained from sources believed to be accurate. Market Matters does not make any representation of warranty as to the accuracy of the figures and disclaims any liability resulting from any inaccuracy. Prices as at 14/9/2017. 8.00AM.
Reports and other documents published on this website and email (‘Reports’) are authored by Market Matters and the reports represent the views of Market Matters. The MarketMatters Report is based on technical analysis of companies, commodities and the market in general. Technical analysis focuses on interpreting charts and other data to determine what the market sentiment about a particular financial product is, or will be. Unlike fundamental analysis, it does not involve a detailed review of the company’s financial position.
The Reports contain general, as opposed to personal, advice. That means they are prepared for multiple distributions without consideration of your investment objectives, financial situation and needs (‘Personal Circumstances’). Accordingly, any advice given is not a recommendation that a particular course of action is suitable for you and the advice is therefore not to be acted on as investment advice. You must assess whether or not any advice is appropriate for your Personal Circumstances before making any investment decisions. You can either make this assessment yourself, or if you require a personal recommendation, you can seek the assistance of a financial advisor. Market Matters or its author(s) accepts no responsibility for any losses or damages resulting from decisions made from or because of information within this publication. Investing and trading in financial products are always risky, so you should do your own research before buying or selling a financial product.
The Reports are published by Market Matters in good faith based on the facts known to it at the time of their preparation and do not purport to contain all relevant information with respect to the financial products to which they relate. Although the Reports are based on information obtained from sources believed to be reliable, Market Matters does not make any representation or warranty that they are accurate, complete or up to date and Market Matters accepts no obligation to correct or update the information or opinions in the Reports.
If you rely on a Report, you do so at your own risk. Any projections are estimates only and may not be realised in the future. Except to the extent that liability under any law cannot be excluded, Market Matters disclaims liability for all loss or damage arising as a result of any opinion, advice, recommendation, representation or information expressly or impliedly published in or in relation to this report notwithstanding any error or omission including negligence.
To unsubscribe. Click Here


