Identifying retracement targets – both buying / selling
The ASX200 slipped back under its initial 6250 technical support as our bearish “Gut Feel” mentioned in yesterday’s morning report unfolded in early trade. Weakness in golds, resources and market darling CSL Ltd caught our eye while the Telcos finally dared to lead the winners circle – of course one day does not make a summer but we continue to believe that the likes of Telstra (TLS) will outperform over the next 12-months.
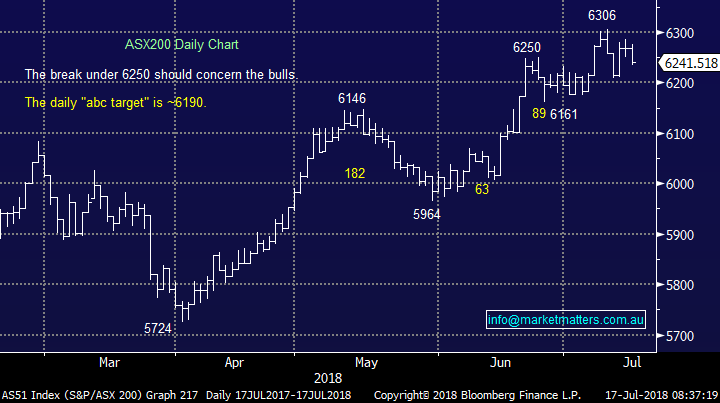
Volumes may remain light due to school holidays but some themes that we have been anticipating are slowly playing out, technically we now expect the ASX200 to test 6160-90, or ~1% lower, but considering our medium-term bearish view MM is conscious that something more sinister may lay in wait.
- Short-term MM remains technically neutral the ASX200 with a close below 6140 required to switch us to bearish, however we remain in “sell but patient mode”.
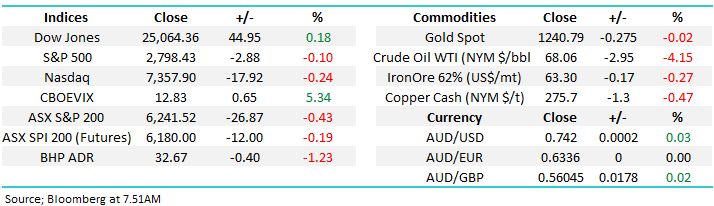
Overnight stocks were quiet with the exception of oil which fell over 4% dragging BHP down over 40c in the process, this has led to the SPI futures picking the ASX200 to initially open down ~10-points.
Today’s report is going to look at 3 technical methods we often apply for optimum entry / exit of stocks / markets which MM is following – this should help subscribers further understand our thoughts while importantly explaining potential applications / alerts this month.
ASX200 Chart
According to Santayana’s philosophy “history repeats” leading to the catchy phrase “history repeats itself”.
Just like history regularly repeats itself through many walks of life from the overturn of empires to the horrendous humanitarian crimes by our species it also appears to leave its footprint firmly in economics – really this should not surprise us because our history is a combination of evolution and the characteristics of humanity including the old investing adage “Fear & Greed”.
With our above simplistic views on history it should not come as a surprise that we believe in the combination of fundamental and technical analysis to achieve optimum investing results – technical analysis is trying to forecast future price action by using historical price action, especially useful when combined with simple risk / reward, while fundamental analysis is all about predicting future earnings and importantly, having a view on what should be paid for those future earnings given the current economic backdrop.
NB Please excuse the larger than usual volume of charts in today’s report but it’s the easiest way to explain our theories for the 3 methods of analysis.
1 Symmetry Waves
Markets in a trend have an uncanny ability to evolve with very similar degrees of retracements whether a bull, or bear market. Consider the below 4 very clear examples:
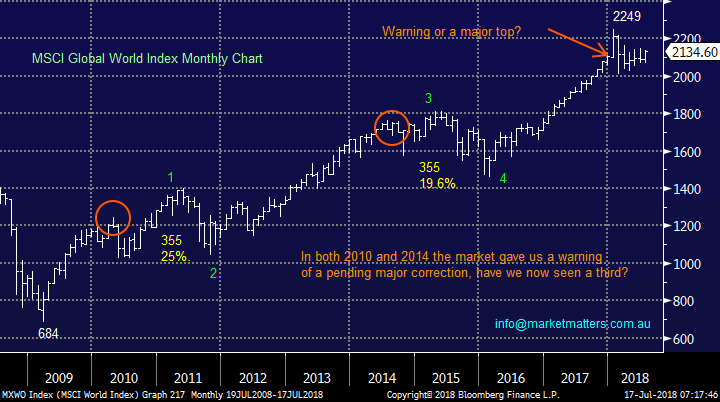
- During the 9-year equity bull market the MSCI Global World Index has experienced 2 pullbacks of exactly 355-points.
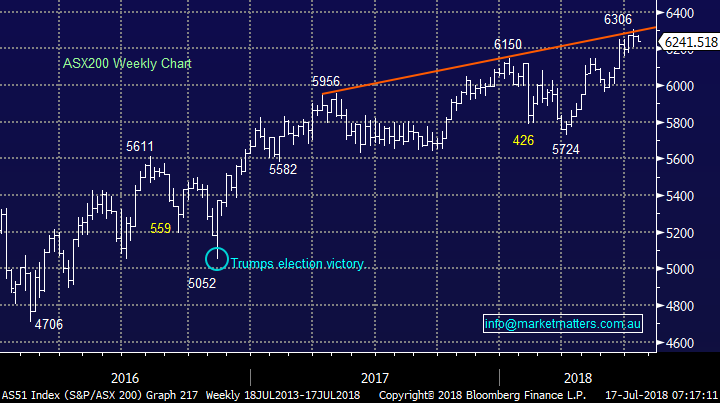
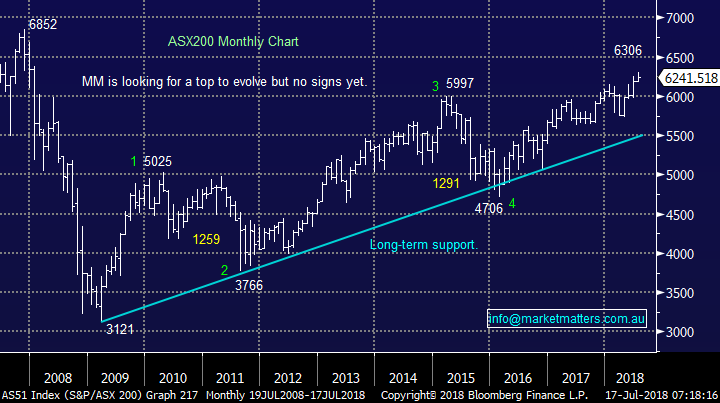
- Similarly during its 9-year bull market the ASX200 has meaningfully corrected twice, 1259 and 1291-points respectively i.e. within ~2% of each other.
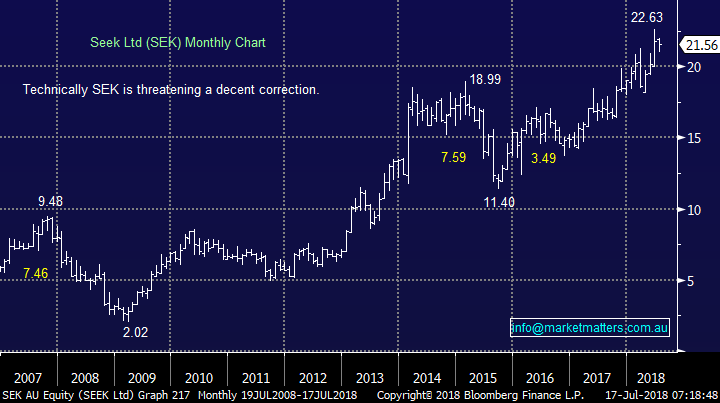
- Since its pre-GFC high of $9.48 Seek (SEK) has corrected $7.46 and $7.59 respectively i.e. within 2% of each other.
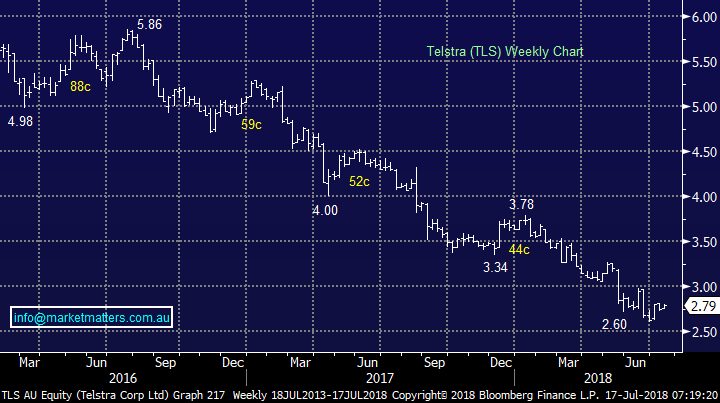
- Since its 2016 high at $5.86 Telstra has bounced 59c, 52c and 44c while its more than halved in price – the bounces are not within 20% in pure price but as a % they are much closer at 12.5%, 13% and 13%.
At MM we look for similar degrees of retracements in both price and percentage (see TLS).
This method can be extremely useful when we consider say buying a “falling knife” because by definition you are phasing the current market sentiment.
MSCI Global World Index Chart
ASX200 Index Chart
Seek (SEK) Chart
Telstra (TLS) Chart
Now importantly moving onto where we are looking at “Symmetry Waves” within today’s market:
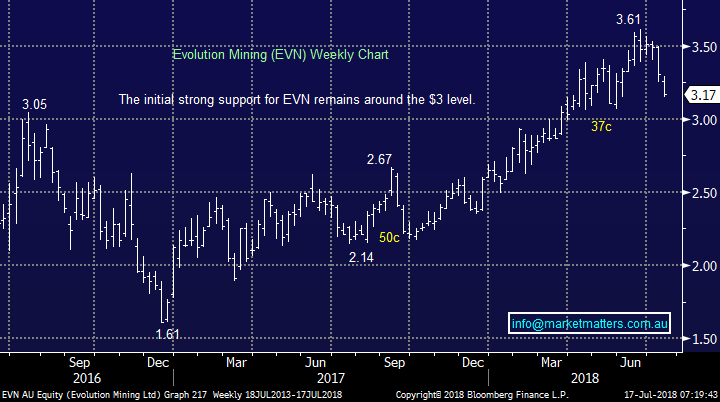
- Evolution Mining (EVN) – we have been stalking EVN for weeks looking for a pullback of ~50c, similar to that in Q3 of 2017 i.e. we are potential buyers between $3 and $3.10.
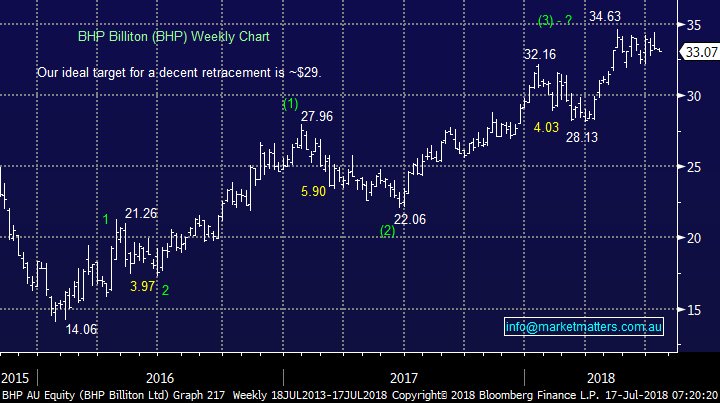
- BHP Billiton (BHP) – we have been watching BHP closely for a while since we sold our holding around $34. We are looking to buy ~$29 i.e. another retracement of ~$5.90.
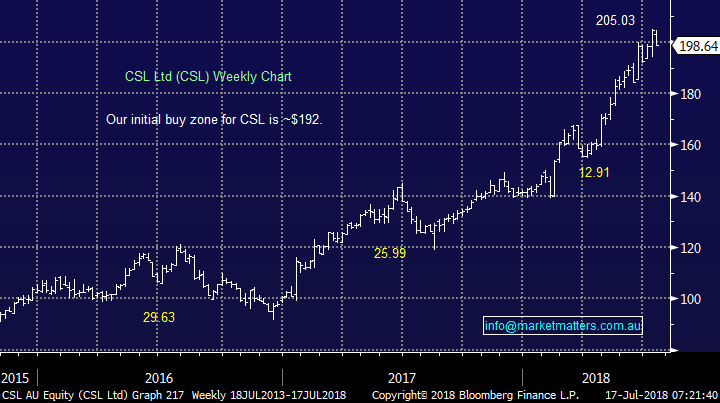
- CSL Ltd (CSL) – market favourite CSL does often retrace, even while maintaining an extraordinary run, we are considering accumulating ~$190-192, another pullback of ~$13 but we would leave ammunition to average the position around $180 i.e. a $25 correction.
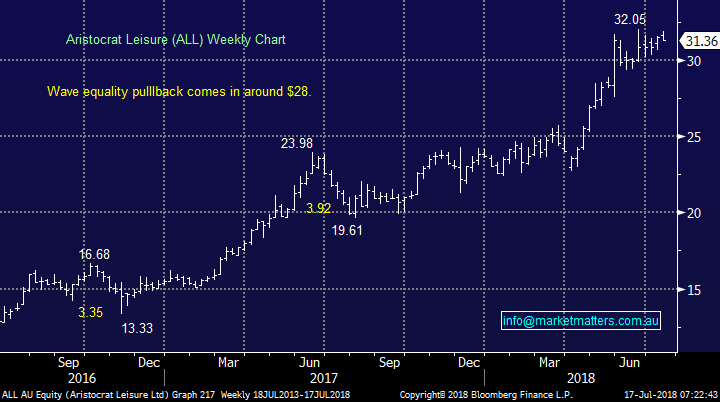
- Aristocrat (ALL) – a train we previously disembarked too early, today we are interested ~$28 i.e. another $4 correction.
- Telstra (TLS) – we are now looking for TLS to bounce either ~85c, or 18%, hence our technical target of the over $3, or indeed the $3.50 area.
Evolution Mining (EVN) Chart
BHP Billiton (BHP) Chart
CSL Ltd (CSL) Chart
Aristocrat (ALL) Chart
2 Fibonacci retracement targets
The Fibonacci sequence was identified by the Italian mathematician around 1202, it’s a simple sequence with amazing occurrences in life, the progression was actually identified when Leonardo Fibonacci was calculating the ideal expansion of breeding rabbits!
- Fibonacci Sequence – 1,1,2,3,5,8,13,21,34 – to get next number simply add the 2 previous i.e. 21+34=55.
The Fibonacci sequence / numbers are amazingly Nature's numbering system. They appear everywhere in Nature, from the leaf arrangement in plants, to the pattern of the florets on a flower, the spiral of shells / galaxies and hurricanes, the bracts of a pinecone, the structure of a human face or the scales of a pineapple. The Fibonacci numbers are therefore applicable to the growth of every living thing, including a single cell, a grain of wheat, a hive of bees, and even the markets in which we invest.
From the Fibonacci sequence evolves the “Golden Ratio” or “phi”, which is so commonly used in technical analysis that Bloomberg even has its retracements as a charting function (see below).
- Golden Ratio – 1.618.
I don’t usually get too excited by pure mathematics but this is most definitely one area I find both fascinating and useful.
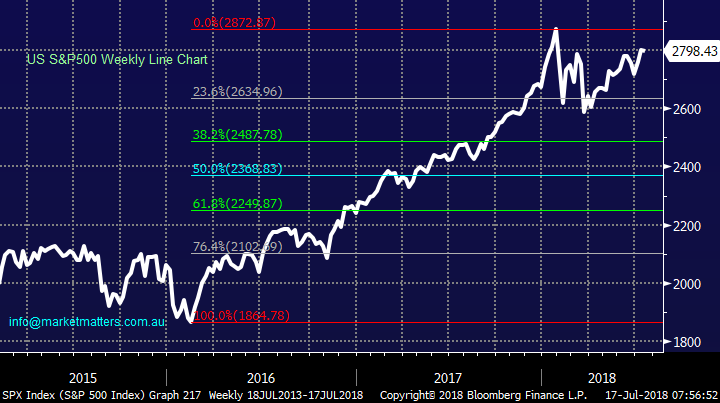
Below is the S&P500 showing potential retracement targets since its swing low in early 2016, the 3 simple retracements we consider at MM are:
- 0.382 = 2466, 50% = 2341 and 0.618 = 2216 – numbers are more accurately calculated than the rough chart below.
S&P500 Weekly Chart
We find the Fibonacci retracements levels regularly coincide with other technical methods we are using to buy / sell a market, or stock. For example lets reconsider the 5 stocks we looked at in the Symmetry Wave section:
- Evolution Mining (EVN) – our target buy zone is $3 to $3.10 notably $3.05 is exactly 0.382 of the most recent advance since the previous 50c pullback.
- BHP Billiton (BHP) – we are looking to buy ~$29 which represents ~50% of the most recent advance.
- CSL Ltd (CSL) – we like market favourite CSL ~$190-192, another pullback of ~$13 but we would leave ammunition to average the position around $180 i.e. a $25 correction – not a fit at present.
- Aristocrat (ALL) – a train we previously disembarked too early, today we are interested ~$28 i.e. another $4 correction may end up close to a ~0.382 correction.
- Telstra (TLS) – we are now looking for TLS to bounce either ~85c, or 18%, hence our technical target of the over $3, or indeed the $3.50 area – $3.84 is close to a 0.382 correction, a level that would not surprise us.
In these 5 examples at least 3 out of the 5 Symmetry Wave buying levels garners support from the Fibonacci “Fibo” levels – it’s important to remember here that technical analysis is not a perfect science BUT a great supporting tool to fundamental research / views.
NB Obviously the shallower the pullback the stronger the market, which adds weight to our approach at times of scaling in / out of positions.
3 “ABC” style retracements
We regularly talk about an “ABC” correction so hopefully this morning we can ensure that the majority of subscribers understand our rhetoric. In a bull market we are looking for two pullbacks of roughly equal magnitude where if everything else adds up we will consider buying the second leg lower (the reverse applies to bear markets where we will look to sell the second bounce higher.
Now let’s look at the 2 ideal examples below:
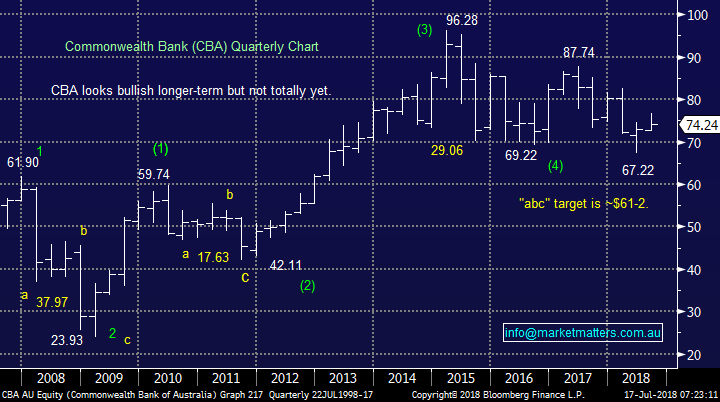
- Commonwealth Bank (CBA) – On a long-term basis CBA gave us 2 perfect “ABC” buying opportunities, in 2009 and 2011. Hence we will be extremely keen buyers of CBA if it were to fall towards $61, another “ABC” pullback.
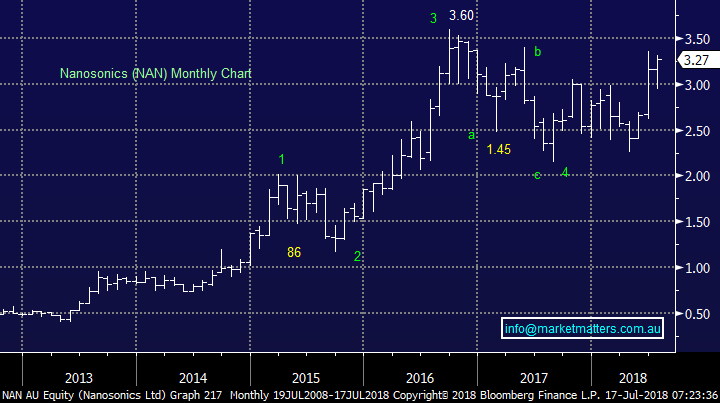
- Nanosonics (NAN) – NAN generated an excellent “ABC” buying opportunity in 2017 around August 2017, a position MM was unfortunately stopped out of – a great example of good trade location enabling better quality risk / reward stops.
Buying an “ABC” pullback is a method we are keen on because it’s simple – investors are buying shorter-term weakness within a bullish longer-term trend.
Commonwealth Bank (CBA) Chart
Nanosonics (NAN) Chart
Two “ABC” retracements we are watching in today’s market:
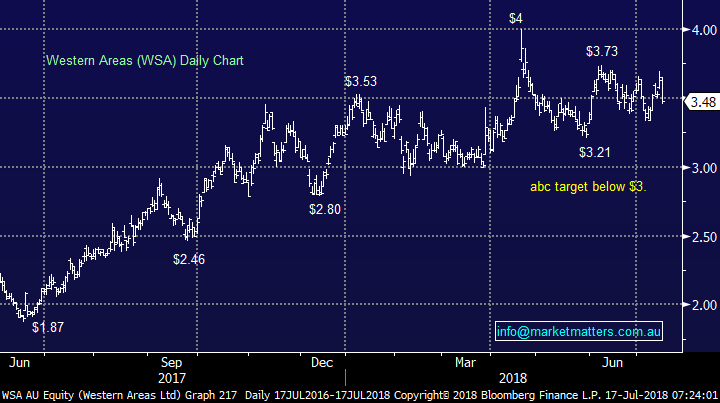
- Western Areas (WSA) – Nickel miner WSA is a volatile beast but MM is likely to buy the “ABC” retracement to around $3 if it does materialise.
- ASX200 – The ASX200 looks set to fall another 50-points towards its “ABC” target of 6190, how it reacts here will be observed very closely.
Western Areas (WSA) Chart
ASX200 Chart
Conclusion
At MM we are looking to follow the above explained technical buy signals in EVN, BHP, WSA, ALL and CSL.
Overseas Indices
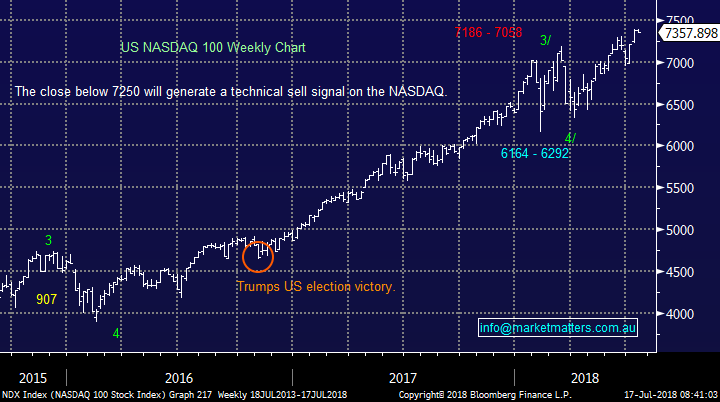
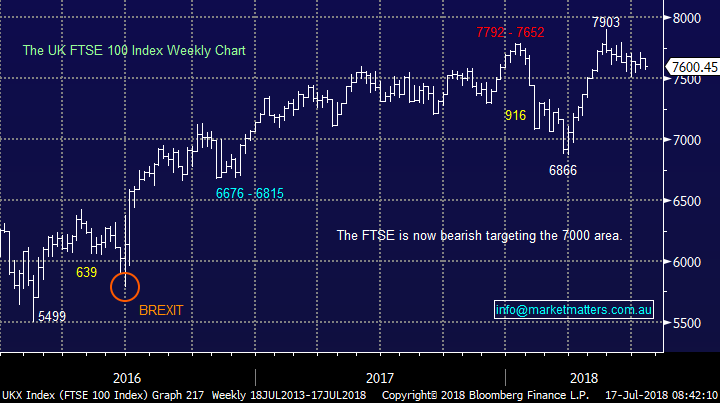
The tech-based NASDAQ continues to trade around its all-time high while the UK FTSE is threatening to fail after achieving its same milestone a few weeks ago.
At MM we remain on alert for a decent market correction and are still looking to increase our cash position into EOFY.
US NASDAQ Chart
UK FTSE Chart
Overnight Market Matters Wrap
· The US equity markets closed mixed with little change overnight, with the financial sector outperforming the energy.
· As mentioned above, the energy was the underperformer, following crude oil losing 4.15% overnight to US$68.06/bbl. while Netflix is currently off 13.8% in after-hours trade after reporting a drop in subscriber growth.
· BHP is expected to follow the energy sector overnight and underperform the broader market after ending its US session down an equivalent of 1.23% from Australia’s previous close.
· The September SPI Futures is indicating the ASX 200 to open marginally lower, testing the 6240 level this morning.
Have a great day!
James & the Market Matters Team
Disclosure
Market Matters may hold stocks mentioned in this report. Subscribers can view a full list of holdings on the website by clicking here. Positions are updated each Friday, or after the session when positions are traded.
Disclaimer
All figures contained from sources believed to be accurate. Market Matters does not make any representation of warranty as to the accuracy of the figures and disclaims any liability resulting from any inaccuracy. Prices as at 17/07/2018
Reports and other documents published on this website and email (‘Reports’) are authored by Market Matters and the reports represent the views of Market Matters. The MarketMatters Report is based on technical analysis of companies, commodities and the market in general. Technical analysis focuses on interpreting charts and other data to determine what the market sentiment about a particular financial product is, or will be. Unlike fundamental analysis, it does not involve a detailed review of the company’s financial position.
The Reports contain general, as opposed to personal, advice. That means they are prepared for multiple distributions without consideration of your investment objectives, financial situation and needs (‘Personal Circumstances’). Accordingly, any advice given is not a recommendation that a particular course of action is suitable for you and the advice is therefore not to be acted on as investment advice. You must assess whether or not any advice is appropriate for your Personal Circumstances before making any investment decisions. You can either make this assessment yourself, or if you require a personal recommendation, you can seek the assistance of a financial advisor. Market Matters or its author(s) accepts no responsibility for any losses or damages resulting from decisions made from or because of information within this publication. Investing and trading in financial products are always risky, so you should do your own research before buying or selling a financial product.
The Reports are published by Market Matters in good faith based on the facts known to it at the time of their preparation and do not purport to contain all relevant information with respect to the financial products to which they relate. Although the Reports are based on information obtained from sources believed to be reliable, Market Matters does not make any representation or warranty that they are accurate, complete or up to date and Market Matters accepts no obligation to correct or update the information or opinions in the Reports. Market Matters may publish content sourced from external content providers.
If you rely on a Report, you do so at your own risk. Past performance is not an indication of future performance. Any projections are estimates only and may not be realised in the future. Except to the extent that liability under any law cannot be excluded, Market Matters disclaims liability for all loss or damage arising as a result of any opinion, advice, recommendation, representation or information expressly or impliedly published in or in relation to this report notwithstanding any error or omission including negligence.
To unsubscribe. Click Here


