Hunting for value in a market at decade highs (NHF, IAG, SIQ, ING, SVW, PPT)
**I’ll be presenting a Webinar this morning at 10.30am for Livewire Markets on building a diversified income strategy, along with James Marlay from Livewire & Stephen Cabot from Credit Suisse. To register, click here**
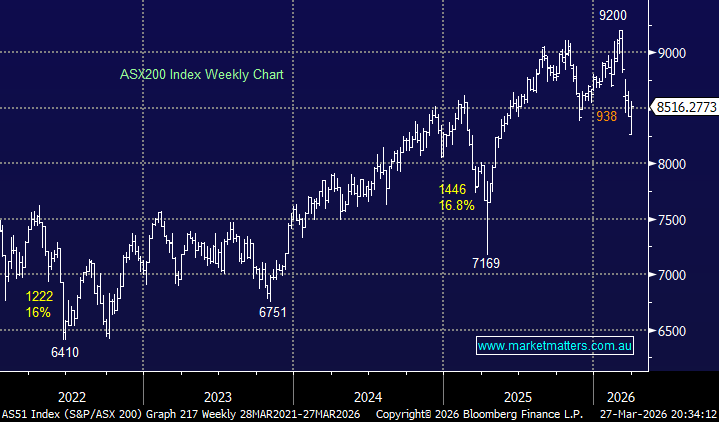
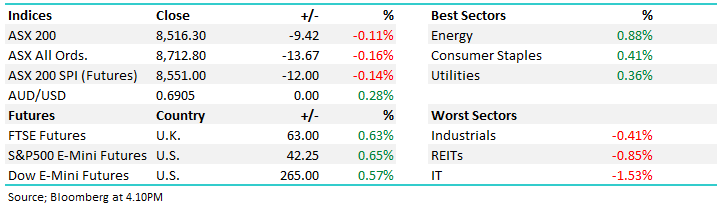
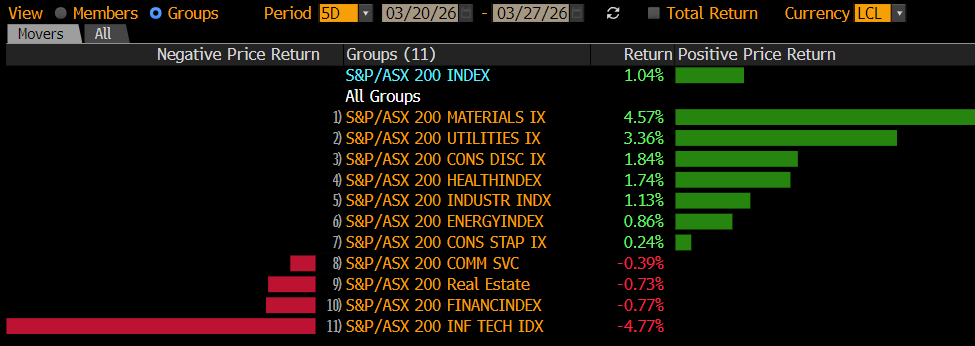
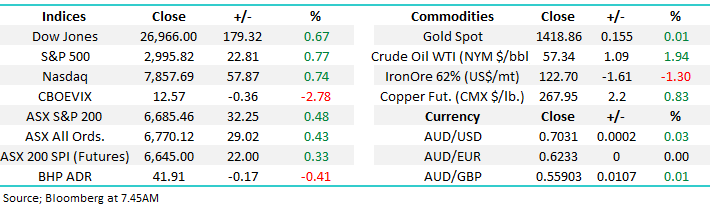
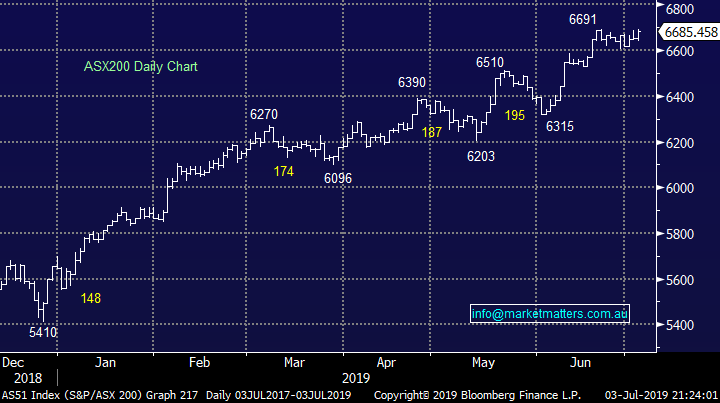
Another strong performance by the ASX200 rallying +0.5% to close just 7-points shy of its 11 ½ year high. The recent trend of strong iron ore / gold stocks versus weak banks continued while the yield play sector regained its “Mojo” with a vengeance, investors appeared to reassess the lasting impact of the RBA’s rate cut on Tuesday. Every stock in the “yield play” Transport and Utilities sectors closed up on the day while the Real Estate sector saw 90% of its members close in the green.
Interestingly the market didn’t feel particularly strong with only 58% of the ASX200 closing up on the day but you should never fight the tape and at the moment it’s certainly in a “glass half full” mood. With the best major bank Term Deposit paying ~2% it should come as no surprise that investors are still chasing local equities for yield, it makes sense unless we enter a meaningful recession when companies will be potentially forced to cut these attractive dividends. However at this stage the market is in the perfect position as it enjoys interest rates at their lowest level in history while investors remain comfortable that global central banks, with clever financial engineering, will be able to avoid a worldwide deep economic contraction.
Seasoned investors and traders often regard both bond and currency markets as the smarter end of town when compared to equities. Interestingly Australian 3-year bond yields remain above the levels plumbed 2-weeks ago, even after the RBA rate cut, yet stocks are trading as if they were blindsided by the news – hopefully its not retail investors piling into the “yield play” in an almost herd like mentality, a common characteristic of market tops.
MM remains comfortable to adopt a more conservative stance over the next 6-months.
Overnight US stocks remained strong with the S&P500 closing up +0.77% at a fresh all-time high, only 4-points shy of the psychological 3000 area. The local futures are calling the ASX200 up ~20-points early on, above the 6700 area. Today we look likely to see a change on the sector performance front with BHP trading down 20c in the US.
In today’s report we have gone searching for value in a market making fresh decade highs. This is a very important exercise for MM moving forward with our Growth Portfolio currently sitting on 23% cash for 2 obvious reasons:
1 – MM might have been premature increasing our cash position and may want to reallocate some money back into equities, also even in bear markets some stocks rally so it’s vital to keep our finger on the market pulse.
2 – MM may want to continue tweaking our portfolio after a number of our stocks have run extremely hard in 2019, this is now likely to involve switching with our cash position already over 20%.
As I often say we must all remain “open-minded” as markets are fluid so while we may like our position today it’s a complacent investor who feels it can never be improved.
ASX200 Chart
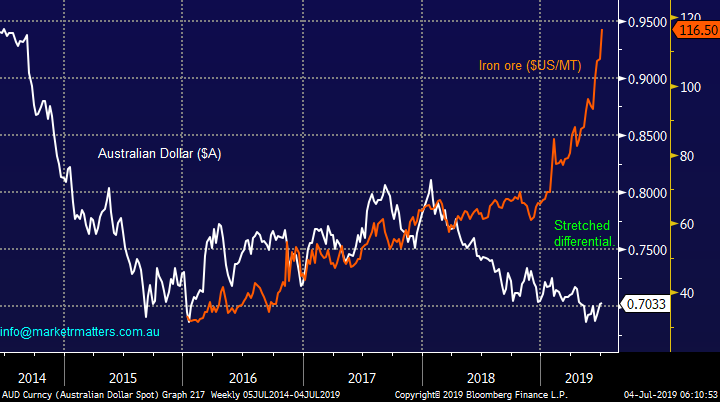
Historically the $A tracks the iron ore price very closely which makes sense when we consider the enormous impact that exports of the bulk commodity have on our trade surplus i.e. yesterday we saw monthly iron ore exports surge above $10bn taking our trade surplus to a record $5.7bn, close to 20% above the previous record set only last month, great news for the incumbent Liberal government.
Our opinion is the elastic band between the Australian Dollar ($A) and iron ore has stretched too far, not a big call when we look at the graph below.
Hence at MM we are not keen on iron ore and $US facing stocks in relative terms – a big contrarian call.
NB The word relative, this is more an opinion to consider with regard to rebalancing portfolios away from the popular iron ore and $US earners.
Australian Dollar ($A) v Iron Ore Chart
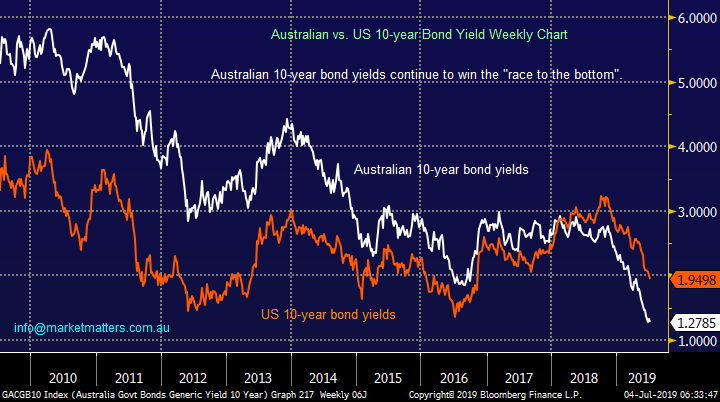
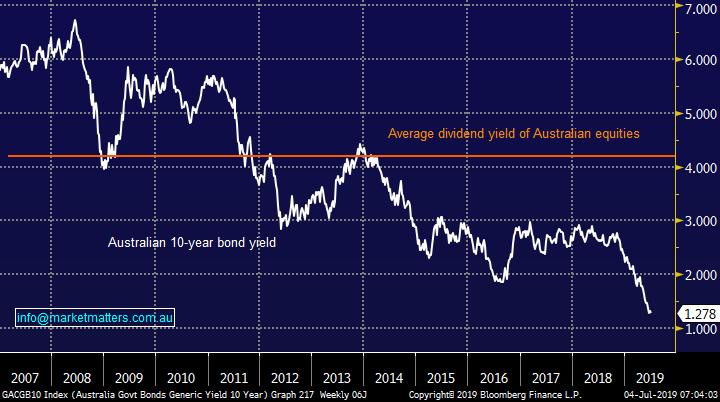
Bond yields continue their race to the bottom with overnight US 10-years hitting their lowest levels since 2016 – equities continue to love the low interest rate environment with no focus on a potential recession, it’s a dangerous game to pre-empt in any aggressive manner when / if stocks will start to worry about the “R” word.
MM will remain net bullish, if not cautious, stocks until bond yields turn higher.
Australian & US 10-year bond yields Chart
Hunting for value in the ASX200
The ASX200 currently yields over 4x the RBA cash rate and 2x the average CBA term deposit making equities very attractive to the yield hungry investor. However a quick reminder to subscribers that blindly buying a basket of the markets highest 10 yielding stocks every year has yielded poor investment returns – the winning formula is buy the quality and sustainable high yielding companies.
Although we are witnessing a definite migration of funds into stocks paying healthy dividends it doesn’t yet feel like a panic stampede, look at today’s second chart of iron ore to see how panic buying often looks / feels.
MM believes stocks paying decent sustainable yield are not at scary levels, unless the market has future moves by the RBA wrong, as it did just back in Q4 of 2018.
Hence today we will regard a stock paying a reasonable yield as a positive for its investment theme.
ASX200 yield v Australian 10-year bond yields Chart
This exercise was a touch harder than I envisaged but on reflection it’s always easier to find value in a falling market and selling opportunities in a rising one. Today we have picked out 4 stocks that are interesting moving forward while also offering a degree of insulation if the economy does turn south, plus I have outlined one sector switch we are considering.
We are mindful that when investors chase yield there is usually an inflection point when they revert away from traditional names and start chasing a secondary group which yield well but just aren’t recognised as such, this is where most of our attention has been focused today.
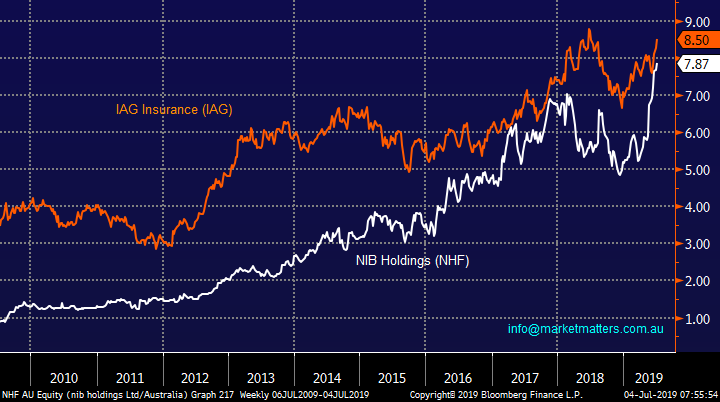
1 Switch NIB Holdings (NHF) to IAG Insurance (IAG).
Over the last 3-months NHF which we hold in the Growth Portfolio has rallied over 45% spurred along by the Liberal election victory while IAG has only gained 12% - not a reason to switch in itself. However in simple terms we believe NHF has now fully milked the benefits of the surprise Liberal election victory.
Technically we are bullish general insurer IAG with a target ~10% higher, conversely NHF has reached our target area. Also, the comparative forecast yields of NHF @ 2.9% ff and IAG @ 4.20 % ff is supportive of our switch thesis.
MM believes IAG will outperform NHF in the second half of 2019.
IAG Insurance (IAG) v NIB Holdings (NHF) Chart
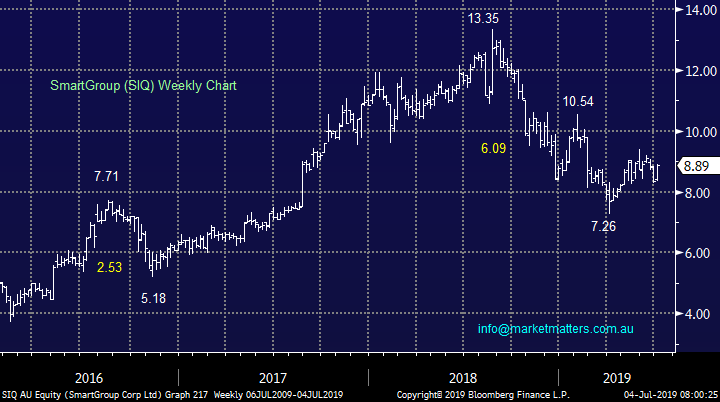
2 SmartGroup (SIQ) $8.89.
Salary packaging business SIQ has had a tough few years but we believe value has returned to the Sydney based business with the stock trading on a forward P/E of 14.2x while expected to yield ~4.8% fully franked.
MM likes SIQ at current levels with an initial target ~15% higher.
SmartGroup (SIQ) Chart
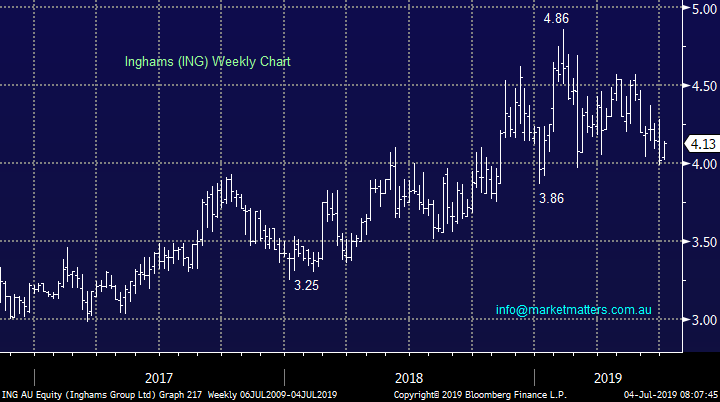
3 Ingham’s (ING) $4.13.
Household name Ingham’s poultry business is catching our eye in today’s economic environment where fears of a recession are growing – people will still eat chicken in an economic downturn!
The company is not trading on a demanding valuation with an Est P/E of 14.7 for 2019 while shares are yielding an attractive ~5% fully franked.
MM likes ING at current levels.
Ingham’s (ING) Chart
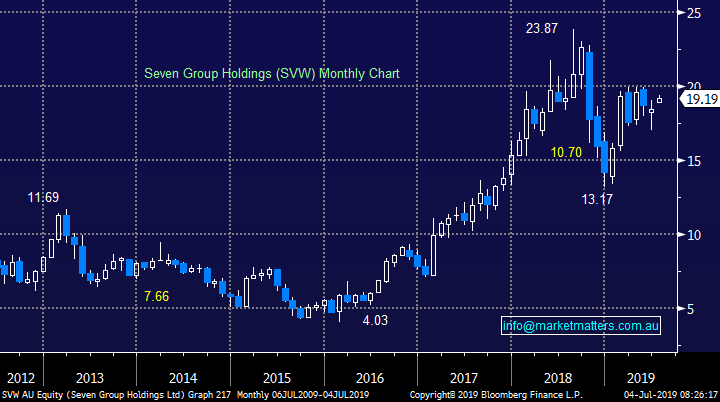
4 Seven Group (SVW) $19.19.
Seven Group (SVW) appears well positioned to benefit from the resurgent mining industry and ongoing infrastructure boom. The last half year results were way ahead of market expectations with the conglomerate reporting an underlying net profit for the December half up 61 per cent to $257 million, with underlying earnings before interest and tax (EBIT) up an impressive 68 per cent on the previous period to $375 million.
SVW is also not trading on a demanding valuation with an Est P/E of 14. for 2019 although the shares are only yielding 2.2% fully franked.
MM likes SVW at current levels.
Seven Group (SVW) Chart
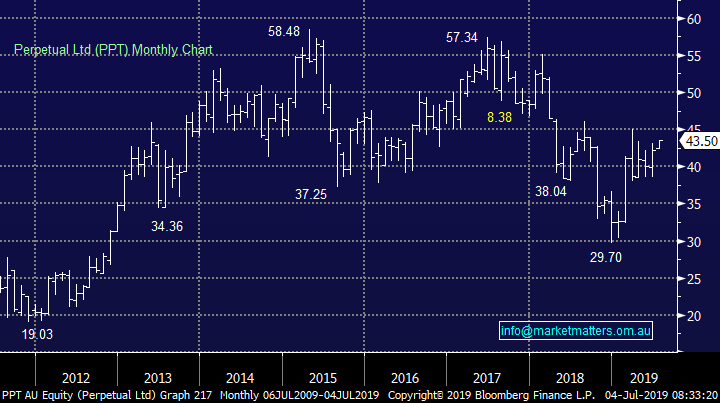
5 Perpetual (PPT) $43.50.
Wealth manager Perpetual has traded ok over the last 12-months in what has been a very tough year for some competitors who have struggled with issuers like Funds Under Management (FUM) and of course performance.
ASX-focused equities manager PPT has not been immune to these issues as it revealed it recorded $1.9 billion of net fund outflows over the quarter ending March 31, 2019, which included the loss of a $1.3 billion mandate from a single Australian equities client. However the positive for PPT is that equity markets enjoyed a strong quarter with its total FUM only falling by $300 million as $1.6 billion in market gains offset the majority of the $1.9 billion in net outflows.
Technically PPT looks good with stops below $38 while it is currently yielding an attractive ~6.1% fully franked.
MM likes PPT at current levels.
NB: PPT is currently held in the MM Income Portfolio
Perpetual (PPT) Chart
Conclusion (s)
Of the 4 stocks looked at today we like all 4 with their order of preference similar to how they are covered above.
We are also considering a switch from NHF to IAG in the Growth Portfolio.
Global Indices
The major US indices all made fresh all-time highs last night, a move we have been anticipating for most of 2019 – we are now more cautious moving forward, at least until equities show their hand at current levels.
We reiterate that while US stocks have reached our target area they have not generated any sell signals.
US NASDAQ Index Chart

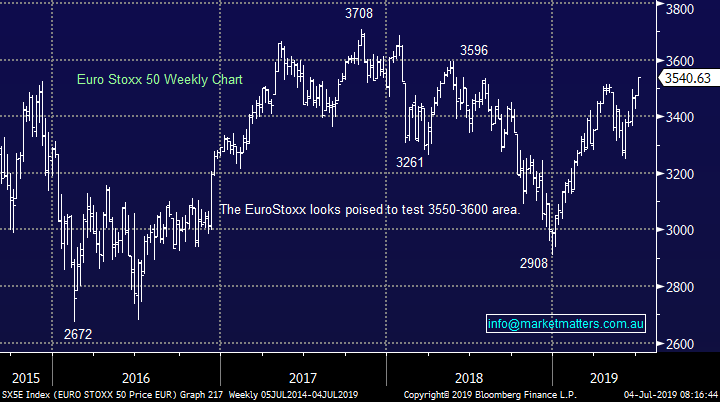
No change again with European indices, we remain cautious European stocks but the tone has improved recently and ongoing fresh highs in 2019 remain strong possibility.
EuroStoxx Chart
Overnight Market Matters Wrap
· The US equity markets reached new highs overnight in a quiet and shortened session ahead of the Independence Day celebration tonight (US markets will be closed).
· Data wise, US private sector payroll numbers for June came in below expectations after a very weak reading in May. An Institute of Supply Management survey showed non-manufacturing falling with new orders at the lowest level in 18 months.
· Nickel rallied back 2% with copper and aluminium also trading better on the LME. Iron ore fell a touch, while crude oil bounced close to 2%.
· We expect a quieter session than average for the remainder of the week, with BHP expected to underperform the broader market today after ending its US session off 0.41% from Australia’s previous close.
· The September SPI Futures is indicating the ASX 200 to make fresh highs for the year, up 26 points towards the 6712 level this morning. It will touch the highest level post GFC and in 12 years.
Have a great day!
James & the Market Matters Team
Disclosure
Market Matters may hold stocks mentioned in this report. Subscribers can view a full list of holdings on the website by clicking here. Positions are updated each Friday, or after the session when positions are traded.
Disclaimer
All figures contained from sources believed to be accurate. Market Matters does not make any representation of warranty as to the accuracy of the figures and disclaims any liability resulting from any inaccuracy. Prices as at 04/07/2019
Reports and other documents published on this website and email (‘Reports’) are authored by Market Matters and the reports represent the views of Market Matters. The MarketMatters Report is based on technical analysis of companies, commodities and the market in general. Technical analysis focuses on interpreting charts and other data to determine what the market sentiment about a particular financial product is, or will be. Unlike fundamental analysis, it does not involve a detailed review of the company’s financial position.
The Reports contain general, as opposed to personal, advice. That means they are prepared for multiple distributions without consideration of your investment objectives, financial situation and needs (‘Personal Circumstances’). Accordingly, any advice given is not a recommendation that a particular course of action is suitable for you and the advice is therefore not to be acted on as investment advice. You must assess whether or not any advice is appropriate for your Personal Circumstances before making any investment decisions. You can either make this assessment yourself, or if you require a personal recommendation, you can seek the assistance of a financial advisor. Market Matters or its author(s) accepts no responsibility for any losses or damages resulting from decisions made from or because of information within this publication. Investing and trading in financial products are always risky, so you should do your own research before buying or selling a financial product.
The Reports are published by Market Matters in good faith based on the facts known to it at the time of their preparation and do not purport to contain all relevant information with respect to the financial products to which they relate. Although the Reports are based on information obtained from sources believed to be reliable, Market Matters does not make any representation or warranty that they are accurate, complete or up to date and Market Matters accepts no obligation to correct or update the information or opinions in the Reports. Market Matters may publish content sourced from external content providers.
If you rely on a Report, you do so at your own risk. Past performance is not an indication of future performance. Any projections are estimates only and may not be realised in the future. Except to the extent that liability under any law cannot be excluded, Market Matters disclaims liability for all loss or damage arising as a result of any opinion, advice, recommendation, representation or information expressly or impliedly published in or in relation to this report not withstanding any error or omission including negligence.