How we’ll “play” this Christmas Rally (BHP, CBA, WBC, RIO, PGH, BBOZ)
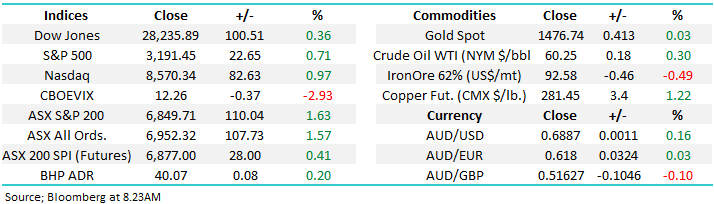
The ASX200 soared 110-points higher yesterday as local stocks had their best day since Liberals surprise election back in May. With well over 80% of the ASX200 closing in the green and every sector up on the day there was plenty to make the bulls happy while from a points perspective the Big 4 Banks, large cap resources and Healthcare Sectors were the backbone of the rally.
Global equities are enjoying some very strong tailwinds at present as the US & China have bedded down the first phase of their trade talks, Boris Johnson has won a resounding victory in the UK election making a resolution to BREXIT in 2020 appear very likely plus the markets still pricing in an RBA rate cut for February at an almost 50-50 possibility. With all this good news the 2019 Christmas Rally has the potential to significantly surpass the average of the last decade.
There are 2 important dates in our opinion that might see the crescendo to this December’s buying which has already seen a 276-point rally from the months low only 13 days ago – remember the average rally from a December low post the GFC is 275-points:
1 – Thursday December 19th is this quarters options & futures expiry, a classic time to see an ongoing squeeze of any stubborn shorts which could be a huge factor in a market feeling devoid of any meaningful selling.
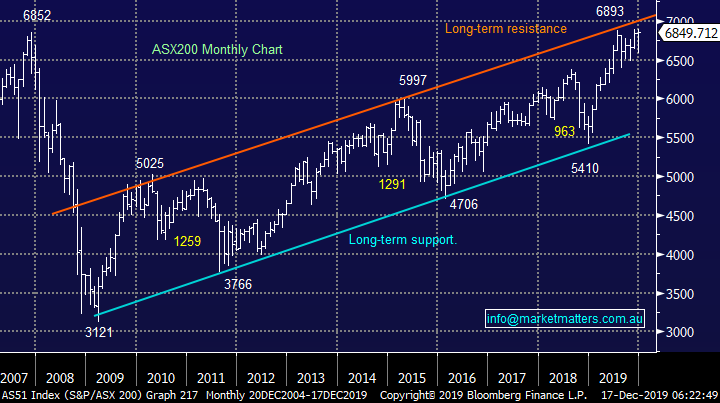
2 – The half-day on Tuesday 31st of December, history tells the market regularly ends the year on a high and if we keep rallying until the end of this year the psychological 7000 area might well be coming into sight.
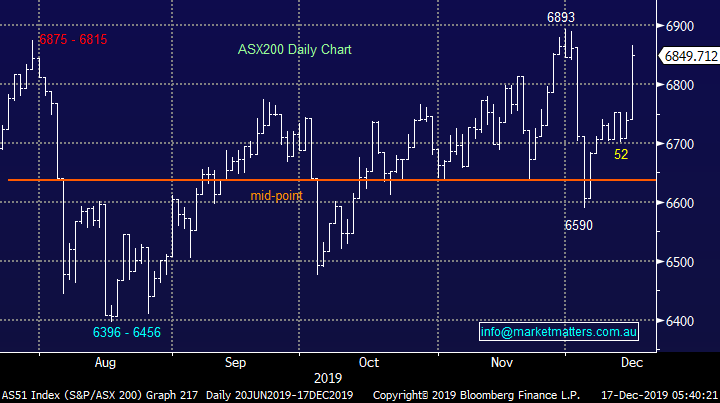
MM continues to believe the ASX200 will again test 6900 this month. – not a big call now!
Overnight US stocks were firm with the Dow closing up 100-points, but it did give back half of its gains late in the session, the SPI futures are calling the ASX200 to open up almost +0.5% this morning.
Today we’ve had a look at how history tells us we should invest during explosive Christmas rallies and beyond.
ASX200 Chart
We already know the statistics around December from our report on Tuesday 3rd: CLICK HERE TO VIEW
Hence the question we ask now is what usually follows after a strong December?
1 – The average return for January over the last decade is -0.4% with noticeable large variances, in two of the years the ASX200 fell by over -5%.
2 – However it’s not a time to run to cash as February is historically and surprisingly the second strongest month of the year.
3 – Seasonally the best time to increase cash levels / become more defensive is the end of Q1, the saying “sell in May and go away” is actually backed up with reasonable statistics.
We are highly committed to equities at present only holding 7% of our Growth Portfolio in cash, hence we will have no hesitation cutting a position or two into further strength, assuming of course the respective stocks are giving us good reason to sell.
MM is looking to take some $$ from the table if the market continues to surge into year end.
ASX200
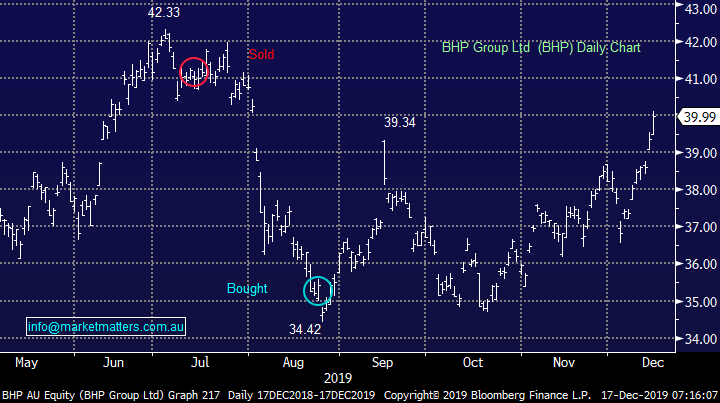
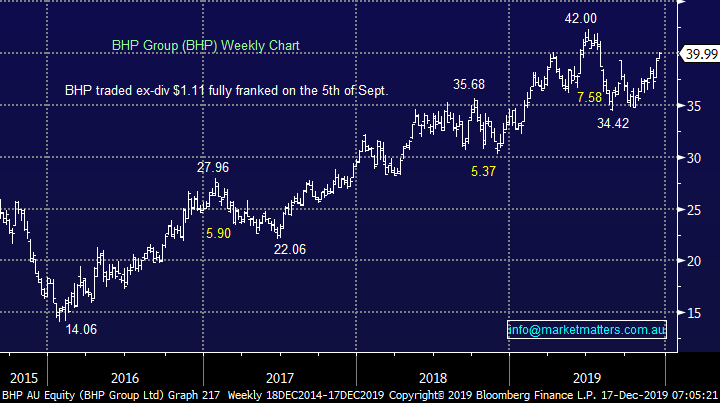
At MM we are “Active Investors” however this doesn’t mean we buy / sell stocks on a regular basis more a case of when things look too expensive / cheap we are prepared to buy and sell accordingly often moving against the crowd, euphoria and pessimism in the process. This obviously doesn’t work all the time and our recent taking of a profit in Fortescue (FMG), albeit it for a great return, does feel premature today. Conversely our actions in BHP this year have been on the money to-date after we exited around $41 and then re-entered ~15% lower – see chart below.
Many investors forget the sell side of the investing equation but to us at MM it’s as important as buying – we strive to identify not just quality stocks we want to buy but also both the levels where they provide value and importantly become too expensive.
Today we have looked at 5 stocks in the MM Growth Portfolio that look capable of reaching our target areas.
In addition in the Weekend Report we mentioned Western Areas (WSA) ~$3.60, OZ Minerals (OZL) ~$12 and Janus Henderson (JHG) ~$40 levels, these remain intact: https://www.marketmatters.com.au/blog/post/market-matters-weekend-report-sunday-15th-december-2019/
Remember famous investor Baron Rothschilds quote with regard to selling - “I never buy at the bottom and I always sell too soon.”
BHP Group (BHP) Chart
1 Banks.
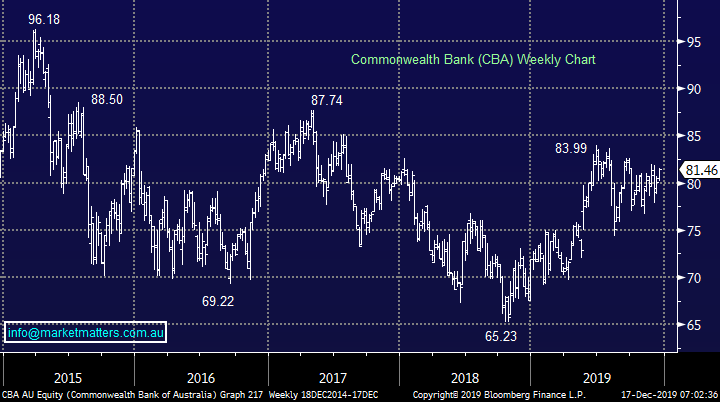
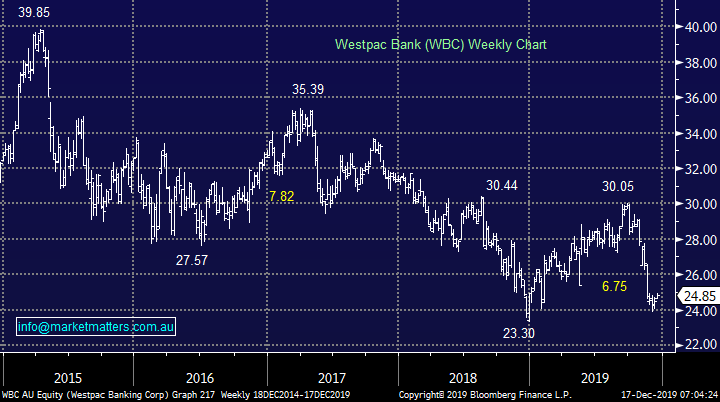
The Australian banks would probably describe 2019 as “annulus horribilis” just as the Queen did in her speech back in 1992. In 2019 the ASX200 is up +21.3% while all of the “Big 4” have underperformed with Commonwealth Bank (CBA) the best +17.6% and Westpac (WBC) the worst up only +0.8% probably better than many realise especially if we include their meaty fully franked dividends.
At MM we hold 23% of our Growth Portfolio in the Big 4 banks which looked ok until last month, the question is what we see now. CBA remains solid with our next target ~4% higher, technically this is the clearest of the banks and the one we are likely to use as a yardstick for its peers. We are considering reducing our banking exposure into further strength.
MM remains bullish CBA targeting the $85-6 area.
Commonwealth Bank (CBA) Chart
Westpac (WBC) Chart
2 BHP Group (BHP) $39.99.
The “Big Australian” BHP has followed our path very well in 2019 hence there’s no reason to change our plans, we are looking to take profit on BHP another ~5% higher.
MM is looking to take profit on BHP above $42.
BHP Group (BHP) Chart
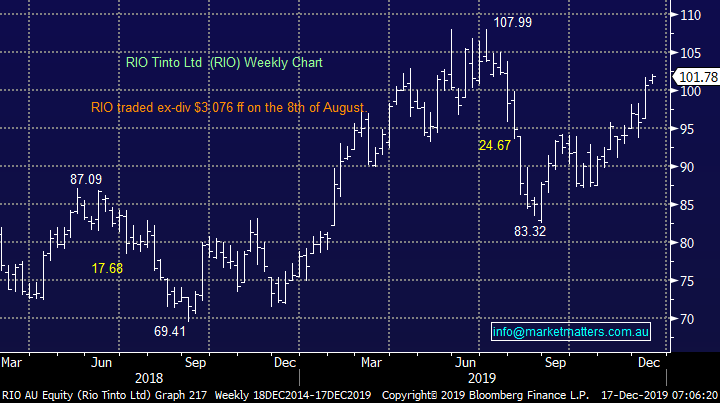
3 RIO Tinto (RIO) $101.78.
Very similar to BHP we are looking to take profit in the diversified miner RIO ~7% higher – again, on a pop over previous highs
MM is looking to sell RIO ~$110.
RIO Tinto (RIO) Chart
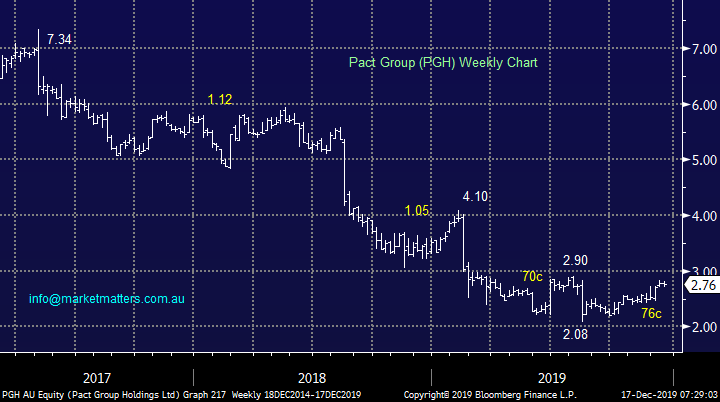
4 Pact Group (PGH) $2.76.
PGH has recovered over 36% from its panic sell-off in August, it would be a great investment if we had timed our purchase slightly better. We are considering reducing our position size by 50% taking a profit in the process back above $3
MM is considering taking part profit on PGH ~8% higher.
Pact Group (PGH) Chart
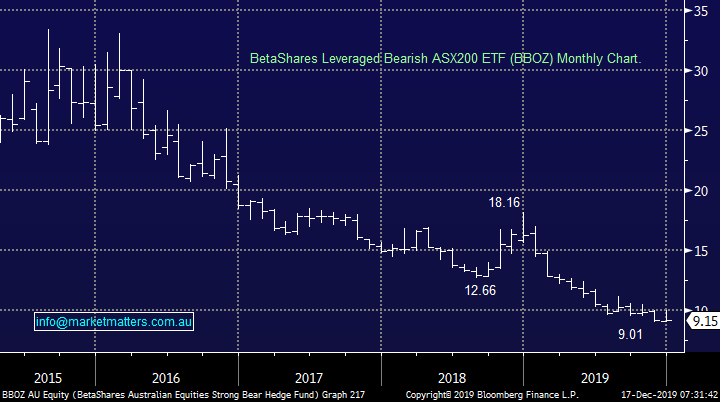
5 BetaShares Leveraged Bearish ETF (BBOZ) $9.15.
Since we sold our position in BBOZ the ETF has fallen ~9%, as we said earlier in the month December is not a time to be short equities. However, we are considering reinitiating into fresh lows below $9, over 10% below where we exited just a few weeks ago.
MM is looking to rebuy into BBOZ below $9.
BetaShares Leveraged Bearish ETF (BBOZ) Chart
Conclusion (s)
MM is looking to become more defensive into further strength by local stocks, however an impulsive move above 7000 should not be ruled out before years end.
Overseas Equities.
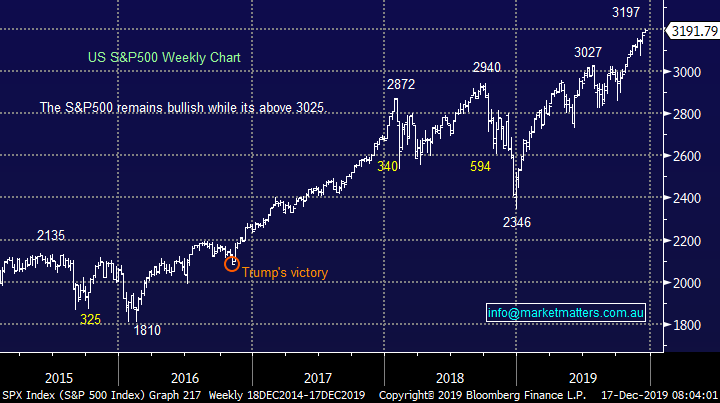
US stocks made fresh all-time highs this morning as they continue to embrace positive macro themes.
MM remains bullish but cautious US stocks.
US S&P500 Chart
Overnight Market Matters Wrap
- It sure seems like that old Christmas rally chestnut is currently on across most indices bar Japan and Hong Kong as investors switch to riskier assets as the US-China trade tension dissipates
- Crude oil continued to climb, currently at US$60.25/bbl. (terrible for all drivers around the Christmas period unfortunately), while the US fear gauge, VIX index trades back to ultra-low complacent levels.
- The stars are aligning for another record high to be achieved this month as the big 4 banks are expected to pull their weight again today and bring back some cheer, along with our mining names.
- The December SPI Futures is indicating the ASX 200 to open 27 points higher, testing the 6880 level this morning.
Have a great day!
James & the Market Matters Team
Disclosure
Market Matters may hold stocks mentioned in this report. Subscribers can view a full list of holdings on the website by clicking here. Positions are updated each Friday, or after the session when positions are traded.
Disclaimer
All figures contained from sources believed to be accurate. All prices stated are based on the last close price at the time of writing unless otherwise noted. Market Matters does not make any representation of warranty as to the accuracy of the figures or prices and disclaims any liability resulting from any inaccuracy.
Reports and other documents published on this website and email (‘Reports’) are authored by Market Matters and the reports represent the views of Market Matters. The Market Matters Report is based on technical analysis of companies, commodities and the market in general. Technical analysis focuses on interpreting charts and other data to determine what the market sentiment about a particular financial product is or will be. Unlike fundamental analysis, it does not involve a detailed review of the company’s financial position.
The Reports contain general, as opposed to personal, advice. That means they are prepared for multiple distributions without consideration of your investment objectives, financial situation and needs (‘Personal Circumstances’). Accordingly, any advice given is not a recommendation that a particular course of action is suitable for you and the advice is therefore not to be acted on as investment advice. You must assess whether or not any advice is appropriate for your Personal Circumstances before making any investment decisions. You can either make this assessment yourself, or if you require a personal recommendation, you can seek the assistance of a financial advisor. Market Matters or its author(s) accepts no responsibility for any losses or damages resulting from decisions made from or because of information within this publication. Investing and trading in financial products are always risky, so you should do your own research before buying or selling a financial product.
The Reports are published by Market Matters in good faith based on the facts known to it at the time of their preparation and do not purport to contain all relevant information with respect to the financial products to which they relate. Although the Reports are based on information obtained from sources believed to be reliable, Market Matters does not make any representation or warranty that they are accurate, complete or up to date and Market Matters accepts no obligation to correct or update the information or opinions in the Reports. Market Matters may publish content sourced from external content providers.
If you rely on a Report, you do so at your own risk. Past performance is not an indication of future performance. Any projections are estimates only and may not be realised in the future. Except to the extent that liability under any law cannot be excluded, Market Matters disclaims liability for all loss or damage arising as a result of any opinion, advice, recommendation, representation or information expressly or impliedly published in or in relation to this report notwithstanding any error or omission including negligence.


