How to Navigate a Mature Bull Market – BEAR
The ASX200 was sold off aggressively all day yesterday with losses across all sectors, except the resources and real estate. The selling felt like it was again futures led and “chat” continues along the lines that traders are selling Australia and buying the US – underlying prices certainly support the theory.
The resources sector in particular is one we are watching carefully as it bounced following renewed hope around a US-China trade resolution which also led to a softening in the $US and subsequent bounce in our own $A. When / if we get another wave of selling in the base metals stocks in particular, MM is likely to step up and take on a few short term positions.
• We remain mildly negative the ASX200 targeting the 5800 region, another ~5% lower.
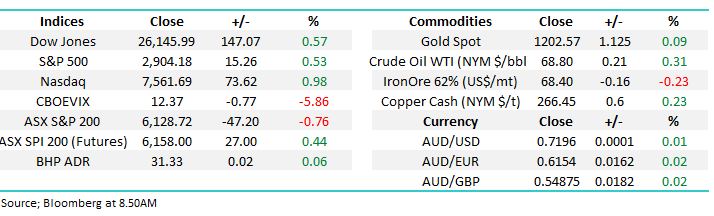
Overseas markets were firm with US stocks rallying around +0.5% led by heavyweight APPLE which gained +2.4%, Europe was basically unchanged. The SPI futures are targeting a 30-point bounce by the ASX200 today, which would regain over half of yesterday’s losses.
Today’s report has combined a number of subjects we have been discussing over recent times to provide MM’s overall view of how investors should handle a mature bull market – hopefully the report is not too long for subscriber’s morning coffees!
ASX200 Chart
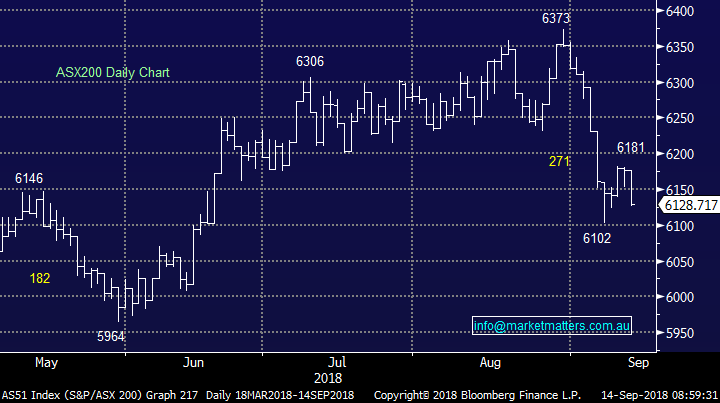
The current bull market is now the longest in history, so not surprisingly the main question we are regularly being asked is, what now?
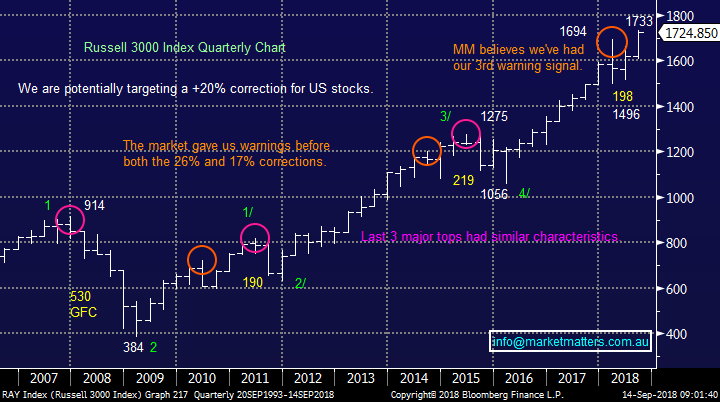
The broad-based US Russell 3000 index has advanced ~350% since the nadir of the GFC, significantly more than our own ASX200. Overall this should be no great surprise to investors given we don’t have stocks like APPLE, Google and Amazon in the Australian index, and that’s where the growth in earnings have largely come from.
When we stand back and look at the strong advance by US stocks, there is evidence that a potential correction is close at hand, although no clear sell signals have yet been generated.
1. US stocks experienced 2 multi-month corrections is 2011 and 2015/6, in both cases investors were given a warning before the major pullback – January / February earlier this year “feels” like yet another warning.
2. Following both warnings, it took 3 & 4 quarters respectively before stocks finally topped out implying a major top may not be reached until 2019.
US Russell 3000 Chart
The availability and cost of money has been a significant driver of this bull market for stocks. Low interest rates coupled with quantitative easing (central banks printing money to buy assets) has been a dynamic force behind asset prices.
As we came out of the GFC, the ‘Bernanke Put’ was a term often used to describe the then US Federal Reserve Chairman Ben Bernanke’s 1-wood approach to supporting the market. By aggressively printing money and purchasing bonds he increased overall liquidity (availability of $$) and ensured interest rates (bond yields) stayed low, meaning money was cheap. The notion that while markets had a free put option from central banks, then buying assets made sense, and the bull market gained steam.
Quantitative Easing has now been wound back and interest rates have subsequently bottomed changing their influence on equities from tailwind to headwind.
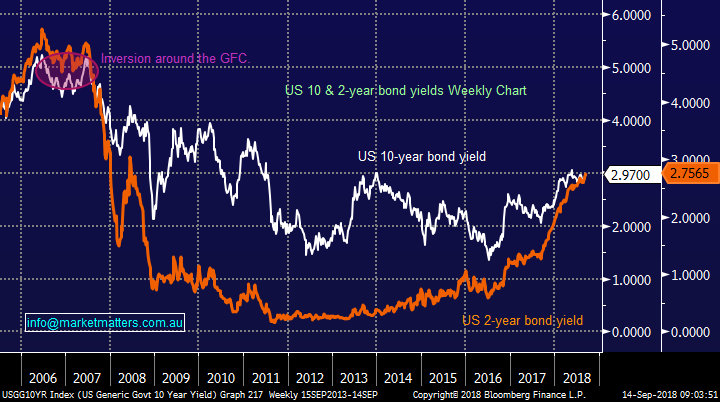
While history tells us that the “canary in coal mine” for stocks is very often rising interest rates, the differential between yields also provides a significant clue to the future for stocks.
• The interest rate differential between US 2 and 10-year bond yields has narrowed to 0.2202% as the US Fed hikes interest rates - see below chart.
We believe the current momentum will have the yield curve inverted by late-2019 / early 2020 i.e. 2-year bond yield will be above that of the 10-years.
• Only once has the inversion of the yield curve not been a precursor for a recession and hence a major correction by stocks.
US 10/2-year bond yields Chart
While we unfortunately don’t have a crystal ball, from a risk / reward perspective we are fairly confident of the below 2 points:
1. Global equities next meaningful correction will commence in the next 12-months.
2. The above-mentioned pullback for stocks will probably be between 15 and 20%.
1 The best sectors late cycle in a bull market
As we saw last week the more traditional “blue chip” stocks can often hold together when the market is weak, particularly the areas that have already been re-priced down as a consequence of stocks / sector specific issues, like the banks. While the high valuation / growth stocks that have performed for the last few years become the most vulnerable.
• When we consider history one of the standout messages for this stage of the cycle is be extremely careful paying up for growth i.e. We want GARP (growth at reasonable price) not GAAP (growth at any price).
To keep things simple (KISS) it’s time for the below:
Seek – solid / predictable profitability (ROE – return on equity) with relatively low debt levels at of course a reasonable price / valuation.
Avoid – high valuation growth stocks who are often unlikely to live up to expectations / hopes if the economy becomes a major headwind.
MM believes the time has arrived for the “boring quality blue chips” compared to the growth stories that have excelled over the last few years. Interestingly, the Telco Sector usually outperforms in bear markets and Telstra (TLS) has already started to rally this financial year in a falling market.
The ASX200 has experienced 2 decent corrections since the GFC:
Firstly, in 2010/11 the market retraced 25% with the US debt downgrade causing the market panic in August 2011 which actually fuelled the capitulation which ended the drop.
Secondly, in 2015/16 the market retraced 21.5% with August being the panic month again, on the 24th in 2015 the Dow opened down 1000-points, the Chinese devaluing their currency was regarded by many as the main cause of the large decline.
This time we are looking for the eventual decline to be caused by old fashioned economics i.e. global central banks turning off the “free money” tap - we are already seeing the impact of tighter credit on the Australian property market and it’s not pretty.
The recent sharp decline in February was sparked off by bond yields rising but we believe that was just a warning of what’s in store moving forward.
• When interest rates rise, the financial sector usually benefits as margins rise – assuming we don’t experience a crash in asset prices leading to large bad debt provisioning. Also, when we look beyond the financials, historically the consumer discretionary and consumer staples sectors perform solidly, again assuming central banks manage to increase interest rates without pushing economies into a recession.
• Conversely, we believe the major risks rest with the likes of Afterpay Touch (APT), WiseTech Global (WTC), Appen Ltd (APX) and Xero Ltd (XRO) – stocks that have enjoyed massive upside momentum on the back of top line (revenue) growth massive P/E expansion. Unfortunately, investors forget very quickly, in the last 2-months both Facebook and Netflix have fallen well over 20% illustrating the dangers of growth stocks at this stage of the cycle.
For a more detailed look at our thoughts around sector rotation moving forward please look at the following article we wrote recently on this topic ‘Sector rotation rules supreme’
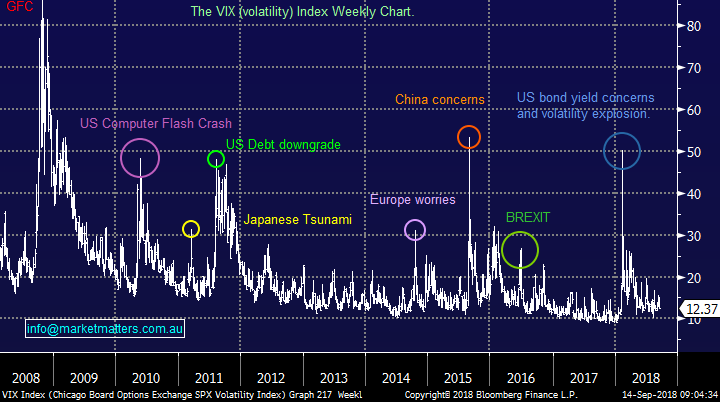
Fear Index (VIX) Chart
2 How and when to diversify
The initial and very simple / short answer here – now!
From a risk / reward perspective, even though no clear sell signals have been generated, we believe it’s time to position portfolios to a more defensive stance.
Buy – The banks, Telcos, Wesfarmers & Woolworths and conservative hybrids i.e. good yielding ex growth stocks.
Sell – High valuation growth stocks (other examples SEK, REA and CAR), real estate and utilities i.e. expensive growth stocks and stocks that are negatively influenced by rising interest rates.
Reduce - Healthcare stocks.
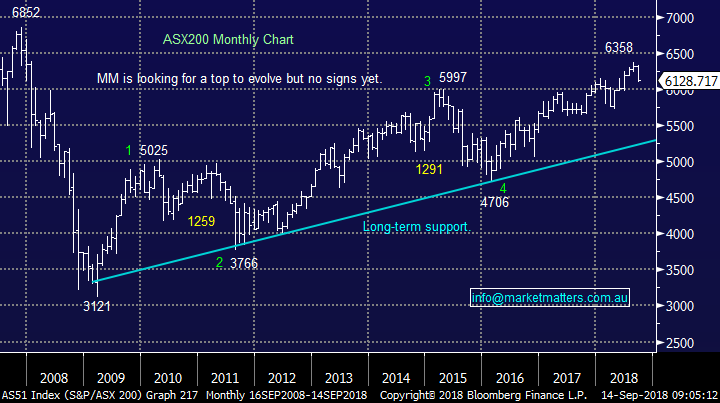
ASX200 Chart
3 Stocks to buy & avoid
The press has been enjoying telling its readers that the ASX200 is making fresh decade highs, but as is often the case its only half the story.
• When we include dividends the local share market is actually soaring to fresh all-time highs.
Over the long-term, the stock market has proven itself to be an excellent form of investment, especially when dividends are compounded. The brave who bought local stocks directly after the GFC have more than tripled their money, significantly outperforming that much heralded beast “property”.
Now is the time to invest smarter with one eye clearly on downside risks i.e. keep your finger firmly on the pulse!
A portfolio of the underperforming “old style” stocks looks ready to outperform if managed correctly. These generally higher yielding almost ex-growth stocks can also be combined with some hedging to generate yield, and protect capital.
For a more detailed look at our stocks to buy & avoid view the recent morning report we published to members highlighting stocks on our watchlist ‘MM has a few moves in our cross-hairs’
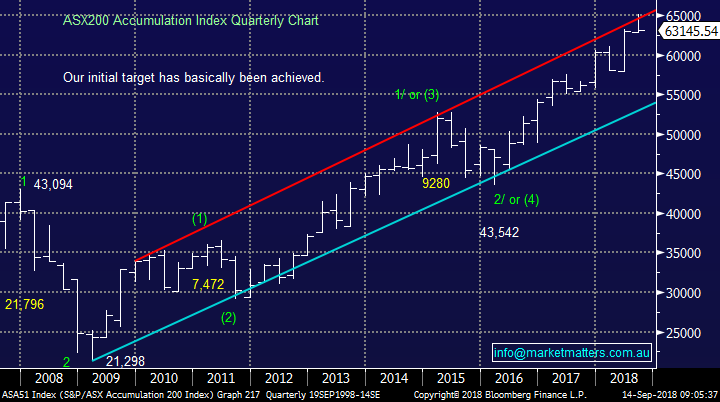
ASX200 Accumulation Index Chart
4 Actionable insights today
While markets now seem to be stretched, money remains on the table for the informed.
Some alternatives;
• A portfolio of hybrids can be relatively insulated from the underlying share market when specifically selected.
• A portfolio of high yield old fashioned blue chips managed actively can yield well over 5% while this can be partially or fully hedged using ETF’s.
• Investors can even skew portfolios to be net bearish i.e. benefitting from a market decline
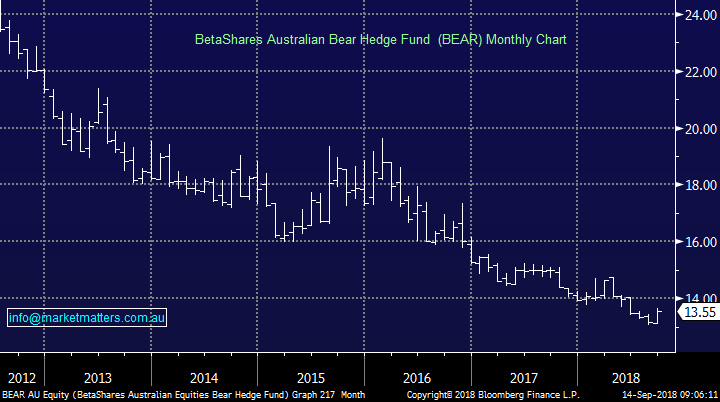
BetaShares Bearish ASX ETF (BEAR) Chart
Conclusion
• MM believes the time has arrived to reposition portfolios with a late cycle bias i.e. away from high valuation / growth stocks.
• Importantly, keeping a finger on the pulse will be key as markets ultimately find a top
Overseas Indices
Last night US stocks were largely firmer, casting doubt on our bearish interpretation at current levels and hence MM’s position in the BBUS.ETF.
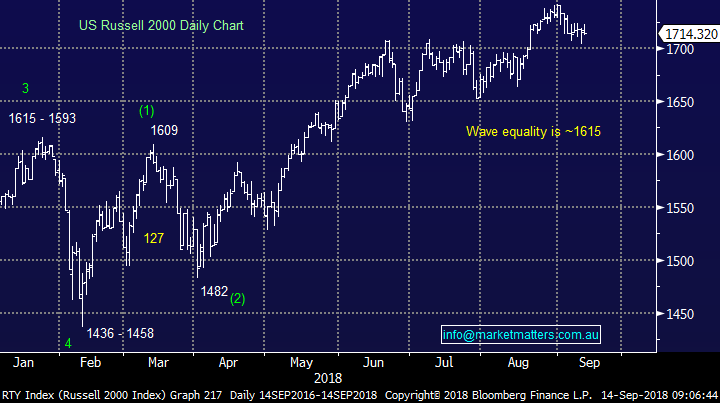
However, the Russell 2000 small cap index which led the advance since Donald Trumps tax cuts were implemented remains “wobbly” and actually closed marginally in the red last night, closing less than 1% away from generating a technical sell signal.
Hence, we will stay with our view at this point in time.
• MM is ideally targeting a drop of ~6% by the US Russell 2000 – small cap index.
US Russell 2000 Chart
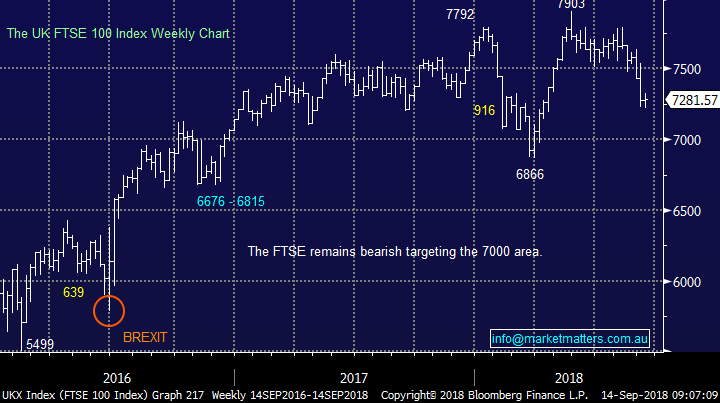
European indices were mixed overnight, The UK FTSE continues to feel heavy as expected with our target of ~7000 now only 4% away.
UK FTSE Chart
Overnight Market Matters Wrap
• The US edged higher overnight, with the broader S&P 500 and Dow ending its session just over 0.5%,, boosted also by gains in Intel and IBM.
• Confusion, however, remains on the US-China Trade front with President Trump saying there is no pressure to strike a deal with China in response to reports that China was willing to restart negotiations.
• Commodities were mixed with oil losing ground, while gold eased back to US$1205/oz,. Base metals were steady, while the iron ore price is slightly stronger at US$68.26/t.
• The September SPI Futures is indicating the ASX 200 to open 27points higher towards the 6160 level this morning.
Have a great day!
James & the Market Matters Team
Disclosure
Market Matters may hold stocks mentioned in this report. Subscribers can view a full list of holdings on the website by clicking here. Positions are updated each Friday, or after the session when positions are traded.
Disclaimer
All figures contained from sources believed to be accurate. Market Matters does not make any representation of warranty as to the accuracy of the figures and disclaims any liability resulting from any inaccuracy. Prices as at 14/09/2018
Reports and other documents published on this website and email (‘Reports’) are authored by Market Matters and the reports represent the views of Market Matters. The MarketMatters Report is based on technical analysis of companies, commodities and the market in general. Technical analysis focuses on interpreting charts and other data to determine what the market sentiment about a particular financial product is, or will be. Unlike fundamental analysis, it does not involve a detailed review of the company’s financial position.
The Reports contain general, as opposed to personal, advice. That means they are prepared for multiple distributions without consideration of your investment objectives, financial situation and needs (‘Personal Circumstances’). Accordingly, any advice given is not a recommendation that a particular course of action is suitable for you and the advice is therefore not to be acted on as investment advice. You must assess whether or not any advice is appropriate for your Personal Circumstances before making any investment decisions. You can either make this assessment yourself, or if you require a personal recommendation, you can seek the assistance of a financial advisor. Market Matters or its author(s) accepts no responsibility for any losses or damages resulting from decisions made from or because of information within this publication. Investing and trading in financial products are always risky, so you should do your own research before buying or selling a financial product.
The Reports are published by Market Matters in good faith based on the facts known to it at the time of their preparation and do not purport to contain all relevant information with respect to the financial products to which they relate. Although the Reports are based on information obtained from sources believed to be reliable, Market Matters does not make any representation or warranty that they are accurate, complete or up to date and Market Matters accepts no obligation to correct or update the information or opinions in the Reports. Market Matters may publish content sourced from external content providers.
If you rely on a Report, you do so at your own risk. Past performance is not an indication of future performance. Any projections are estimates only and may not be realised in the future. Except to the extent that liability under any law cannot be excluded, Market Matters disclaims liability for all loss or damage arising as a result of any opinion, advice, recommendation, representation or information expressly or impliedly published in or in relation to this report notwithstanding any error or omission including negligence.
To unsubscribe. Click Here


