How far do we see the resources correcting? (BHP, RIO, FMG, WSA, OZL)
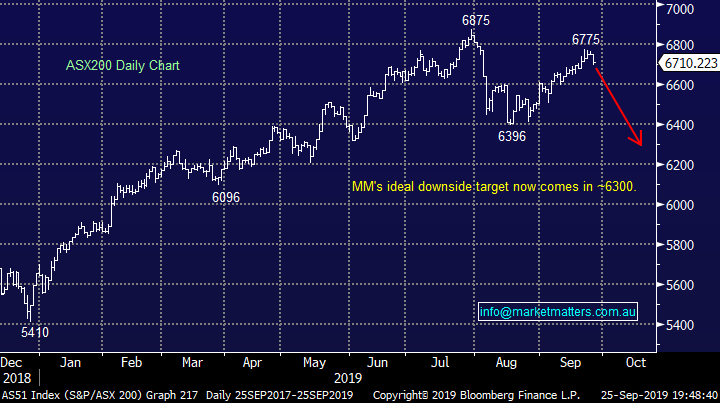
The ASX200 had its worst day in a while yesterday as we failed to shrug-off Tuesday nights strong decline on Wall Street but the lack of follow through on the downside suggests most investors still believe that the US and China will ultimately resolve their trade differences. Over 70% of the market finished in the red as selling washed across the index with only the gold and other safe haven stocks enjoying any meaningful buying, although only 10% of the index was down by 3% or more, no big deal at this stage. However our “Gut Feel” is we are slowly seeing the start of a decent pullback into October / November.
MM is now short-term bearish the ASX200 with an ideal target around 6300, or 6% lower.
The “risk-off” anticyclical party came to town in a big way on Wednesday as the Energy and Resource stocks were at the pointy end of the selling e.g. BHP Group (BHP) -1.9%, RIO Tinto (RIO) -2.2% and Western Areas (WSA) -3.5%. This is one area of the market where we are keen to increase the MM exposure as geopolitical tensions increase but if we are going to see a meaningful pullback in equities there is definitely no hurry to press any buy buttons just yet. If things move according to our plan the MM Growth Portfolio is likely to switch our gold exposure via Newcrest (NCM) and Evolution (EVN) into the more cyclical resources in the weeks ahead. Today we have looked at how far these same cyclical resources might correct.
Yesterday the Australian bond yields continued their decline with the important 3-years now only a few ticks away from their all-time lows, trading around 0.7% as the market starts to price in 2 RBA rate cuts in the months ahead but this was not enough to support the broad index yesterday. At MM we believe the strong likelihood is Australia will have the almost unbelievable RBA Official Cash Rate of 0.5% in early 2020, however if this is already built into equities we must question where the next sugar hit for equities / global growth will come from to the propel the ASX200 towards fresh all-time highs – zero local interest rates perhaps?
Short-term MM remains comfortable adopting a more conservative stance towards equities around current market levels.
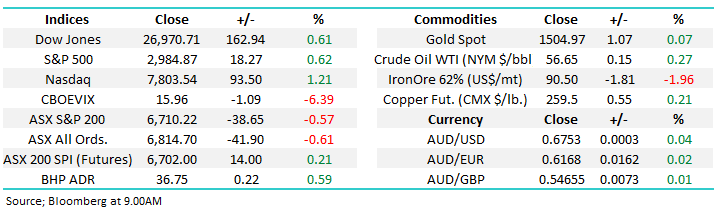
Overnight global stocks bounced solidly after President Trump said “They want to make a deal badly….it could happen sooner than you think” – it’s almost like he loves his current power to move the market with just a couple of keystrokes. The SPI futures are calling the ASX200 to bounce ~15-points with BHP closing up 25c in the US likely to give the index a helping hand.
This morning MM has revisited the major resources sector as we consider buying weakness in the weeks / months ahead.
ASX200 Chart
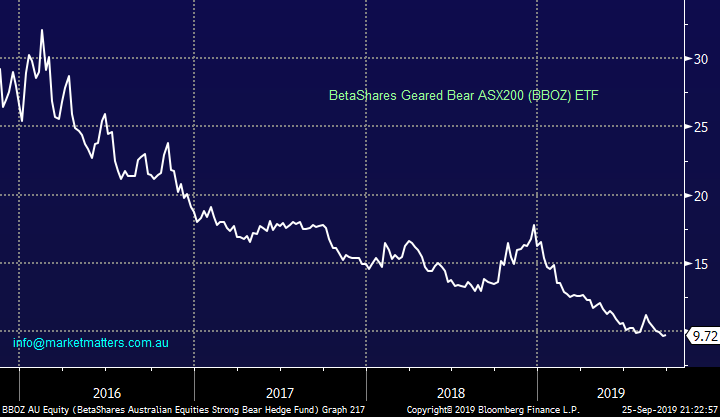
Yesterday MM allocated 5% of the MM Growth Portfolio into the Betashares Geared Bear ASX200 (BBOZ) ETF. The leveraged ETF is designed to rally between 2 and 2.75% for every 1% the ASX200 falls or in other words if we see a pullback of ~6% to 6300 the BBOZ should gain around 15%, give or take a few percent.
MM is bullish the BBOZ looking for ~15% upside.
https://www.betashares.com.au/fund/australian-equities-strong-bear-fund/
Betashares Geared Bear ASX200 (BBOZ) ETF Chart
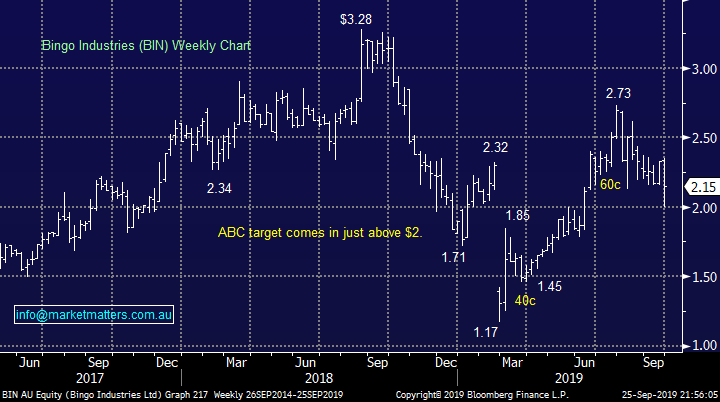
As we touched on in the pm report Bingo (BIN) was one of the weakest stocks on the ASX boards yesterday falling -4.4% and closing around its low if we ignore a rogue print on Chi-X after 4pm at $2. The news which sparked the decline was the sale of their Banksmeadow recycling facility to private equity for $50m. I reiterate that we like BIN as a business however we’re concerned about their November AGM. They previously didn’t provide FY20 guidance at their FY19 results presentation saying they’ll do this at the AGM on the 13th November. The cynic in me says If the business was firing, I doubt they’d wait till the AGM to outline forecasts.
Technically we MM likes BIN under $2.05 but patience is likely to say wait on this one unless the risk / reward becomes too compelling.
Bingo Industries (BIN) Chart
Overnight US bond yields bounced as equities enjoyed a strong day sending the $US higher and the likes of gold lower. If we are correct and the downtrend is intact but also very mature the journey towards 1.5%, or below, is likely to be a choppy decline just like the last 10-days.
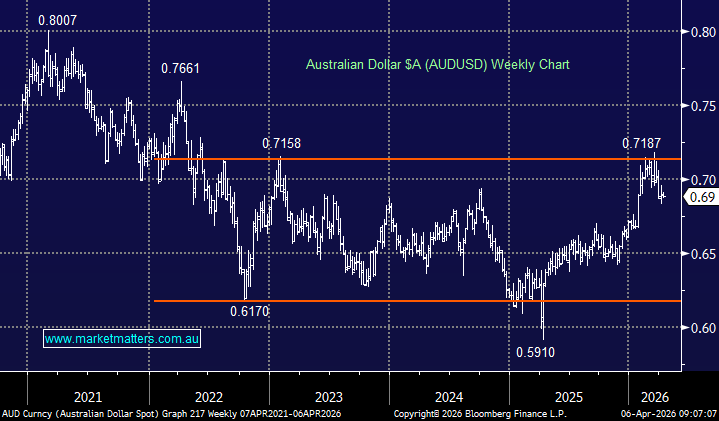
We can still see fresh lows in 2019 but not as clearly as with our own bond yields hence the recent renewed weakness in the $A is easy to understand.
MM is neutral / bearish US bond yields at present.
US 10-Year Bond Yield Chart

Revisiting the Australian Resources sector.
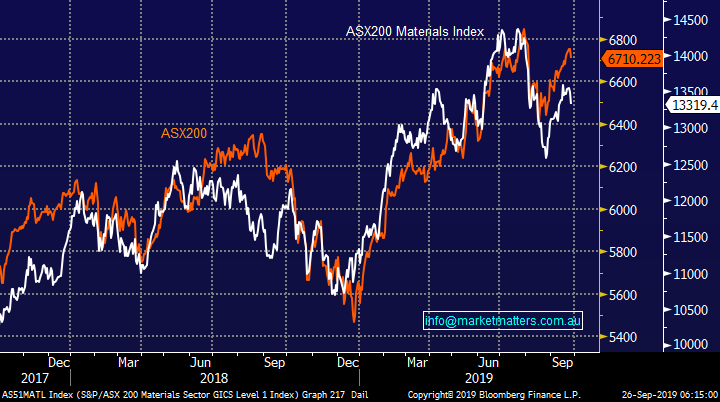
The Australian Materials Index is not comprised entirely of the cyclical resources as it also includes the golds and building stocks for example. However as the chart illustrates below the correlation between the sector and ASX200 is almost perfect which implies 2 important points to MM:
1 – If the ASX200 corrects ~6% back towards 6300 which is our preferred scenario the Resources are likely to endure a similar move, potentially testing their August lows.
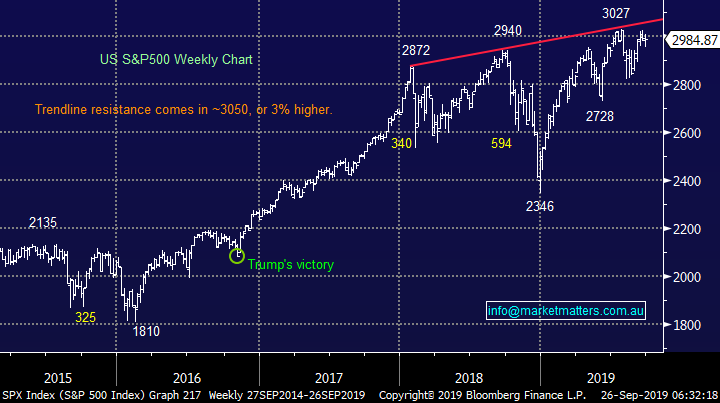
2 – Hence if equities continue to grind higher and the US S&P500 makes a fresh all-time high ~3050, which remains a 50-50 scenario for MM, we should consider taking profit on at least one of our existing holdings.
Australian Materials & ASX200 Indices Chart
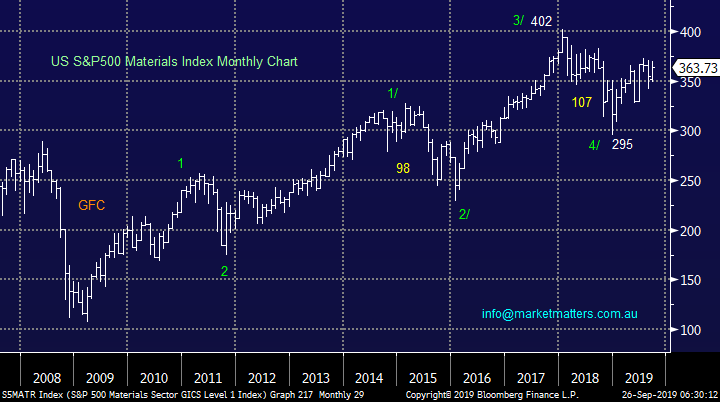
In the medium-term the picture for the US Materials Index is clearer and more optimistic – technically they look poised to make fresh highs ~15% higher before alarm bells would start ringing from a technical perspective. This not surprisingly coincides with our outlook for the broader market hence adding weight to our plan to buy the Australian resources into weakness.
US S&P500 Materials Index Chart
Today I have briefly looked at 5 Resources stocks primarily considering levels where we like the risk / reward in adding to our exposure plus of course any areas that look attractive to take some $$ from the table.
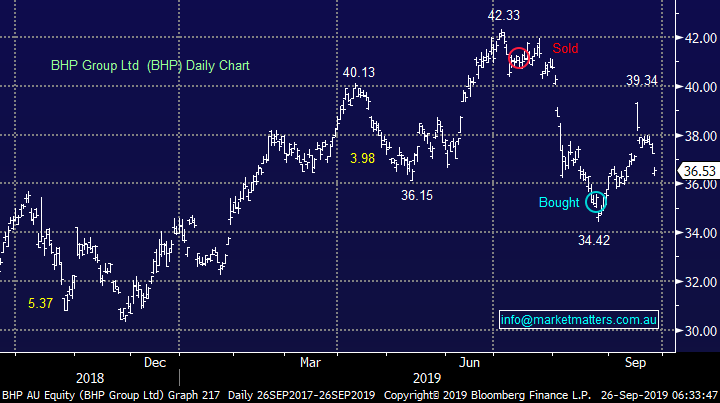
1 BHP Group (BHP) $36.53
The “Big Australian” as BHP is so fondly referred to enjoyed a huge spike over $39 following the drone attacks on Saudis main oil facilities but has since slipped back with the overall sector and especially oil weakness. If / when we see the ASX200 correct towards 6300 MM can easily see BHP test the $32 area, 10% lower.
BHP traded ex-dividend 78c fully franked on the 5th of September.
MM may add to our BHP around $32 while considering taking profit closer to $38.
BHP Group (BHP) Chart
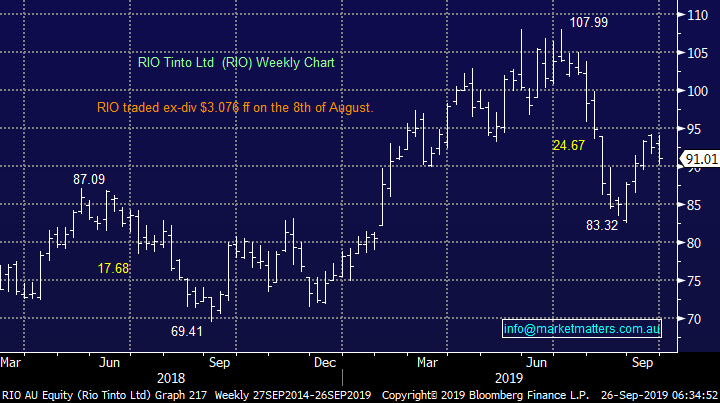
2 RIO Tinto (RIO) $91.01
RIO is classified as a diversified miner however the main driver of its earnings comes from Iron Ore hence its enjoyed the strong bounce in the bulk commodity since late August. The shares have experienced only a small pullback in recent weeks which is a good sign but a recovery back towards $95 will be tempting for MM to lock in some $$, looking to re-enter at lower levels.
RIO traded ex-dividend $3.076 fully franked on the 8th of August – MM went long on the 5th of that month for our Growth Portfolio.
MM likes RIO around $75 to add to our position while we may take some $$ from the table a few % higher.
RIO Tinto (RIO) Chart
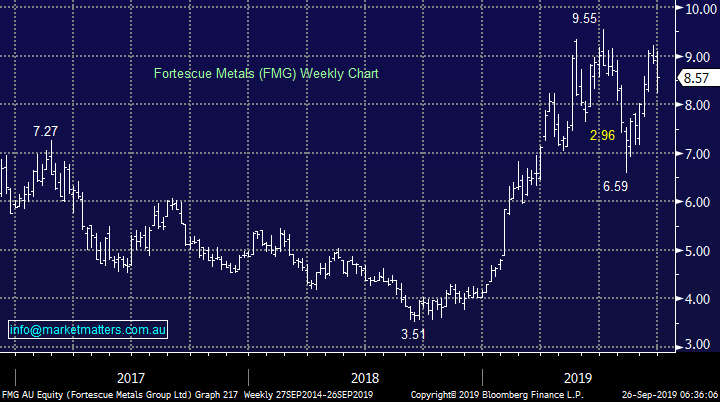
3 Fortescue Metals (FMG) $8.57
Iron ore producer FMG is a volatile beast which we have thoroughly enjoyed actively investing in over the years, 10-30% swings are common place. MM likes the stock and the business hence we need to feel the elastic band of optimism has stretched too far before we will consider taking some profit off the table.
FMG traded ex-dividend 34c fully franked on the 2nd of September – MM went long for our Growth Portfolio just in time to enjoy the dividend.
MM likes FMG below $8 while we can comfortably still see new highs around $10.
Fortescue Metals (FMG) Chart
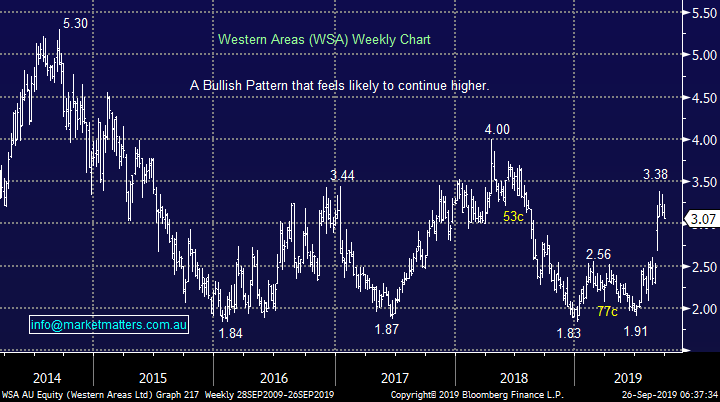
4 Western Areas (WSA) $3.07
Nickel producer WSA has enjoyed a strong rally along with the underlying industrial metals price. We like the stock and nickel exposure, especially if we see an eventual resolution / improvement in US-China trade. We see any decent dip under $3 as appealing from a risk / reward perspective to at least start building a position.
MM likes WSA below $3, only a few percent lower.
Western Areas (WSA) Chart
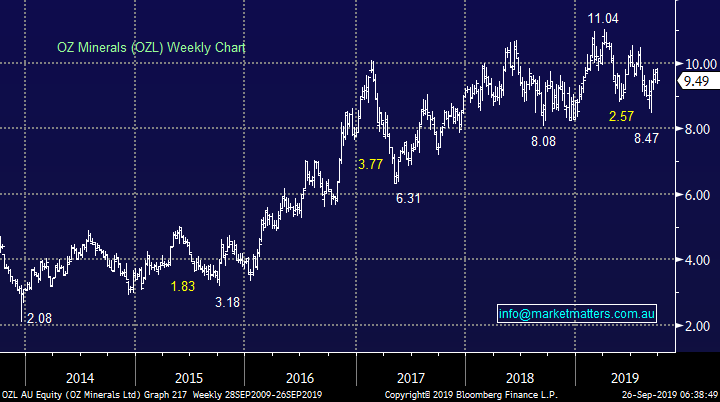
5 OZ Minerals (OZL) $9.49
As we have discussed previously copper and gold producer OZL is a company / business which MM believes the market is undervaluing in the medium term hence we are keen buyers into a pullback.
MM likes OZL into market / sector weakness.
OZ Minerals (OZL) Chart
Conclusion (s)
Of the 3 resource stocks we hold we are more likely to take a profit on BHP or RIO than FMG at this point in time.
Similarly we are keen on both of WSA and OZL into weakness – holding the BBOZ bearish ETF position will make accumulating into any weakness in the sector a more comfortable exercise.
Global Indices
No major change yet, we are looking for a decent pullback for US stocks but no specific sell signals have been triggered – note at the moment we still feel a break to fresh all-time highs will fail to aggressively follow through to the upside.
US stocks remain clearly firm but with little upside momentum.
US S&P500 Index Chart
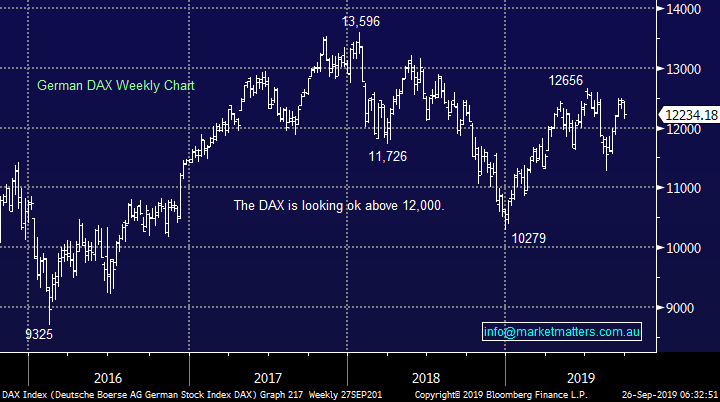
No change again with European indices, while we remain cautious European stocks as their tone has become more bearish over the last few months, however we had been targeting a correction of at least 5% for the broad European indices, this was achieved.
The long-term trend is bullish hence any “short squeezes” might be harder and longer than many anticipate, potentially one is currently unfolding.
German DAX 50 Chart
Overnight Market Matters Wrap
- The US gained overnight as US-China trade tensions seem to dissipate with the meeting coming up very soon.
- Across in the Euro region, UK’s FTSE lost with the BREXIT drama back on the agenda, while concerns remain on Euro’s growth at present.
- Crude oil lost ground overnight, as Saudi Aramco noted they are ahead of schedule in restoring output production.
- BHP is expected to outperform the broader market after ending its US session up and equivalent of 0.59% from Australia’s previous close.
- The December SPI Futures is indicating the ASX 200 to open 16 points higher this morning, testing the 6725 level with September equity options expiry this afternoon.
Have a great day!
James & the Market Matters Team
Disclosure
Market Matters may hold stocks mentioned in this report. Subscribers can view a full list of holdings on the website by clicking here. Positions are updated each Friday, or after the session when positions are traded.
Disclaimer
All figures contained from sources believed to be accurate. All prices stated are based on the last close price at the time of writing unless otherwise noted. Market Matters does not make any representation of warranty as to the accuracy of the figures or prices and disclaims any liability resulting from any inaccuracy.
Reports and other documents published on this website and email (‘Reports’) are authored by Market Matters and the reports represent the views of Market Matters. The Market Matters Report is based on technical analysis of companies, commodities and the market in general. Technical analysis focuses on interpreting charts and other data to determine what the market sentiment about a particular financial product is, or will be. Unlike fundamental analysis, it does not involve a detailed review of the company’s financial position.
The Reports contain general, as opposed to personal, advice. That means they are prepared for multiple distributions without consideration of your investment objectives, financial situation and needs (‘Personal Circumstances’). Accordingly, any advice given is not a recommendation that a particular course of action is suitable for you and the advice is therefore not to be acted on as investment advice. You must assess whether or not any advice is appropriate for your Personal Circumstances before making any investment decisions. You can either make this assessment yourself, or if you require a personal recommendation, you can seek the assistance of a financial advisor. Market Matters or its author(s) accepts no responsibility for any losses or damages resulting from decisions made from or because of information within this publication. Investing and trading in financial products are always risky, so you should do your own research before buying or selling a financial product.
The Reports are published by Market Matters in good faith based on the facts known to it at the time of their preparation and do not purport to contain all relevant information with respect to the financial products to which they relate. Although the Reports are based on information obtained from sources believed to be reliable, Market Matters does not make any representation or warranty that they are accurate, complete or up to date and Market Matters accepts no obligation to correct or update the information or opinions in the Reports. Market Matters may publish content sourced from external content providers.
If you rely on a Report, you do so at your own risk. Past performance is not an indication of future performance. Any projections are estimates only and may not be realised in the future. Except to the extent that liability under any law cannot be excluded, Market Matters disclaims liability for all loss or damage arising as a result of any opinion, advice, recommendation, representation or information expressly or impliedly published in or in relation to this report notwithstanding any error or omission including negligence.