How far could the “yield play” stocks correct? (RIO, PGH, TCL, SYD, TLS, CBA)
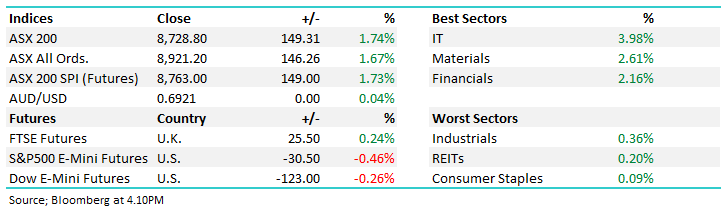
The ASX200 rallied strongly on the penultimate day of the financial year closing up 25-points, a solid 1% above its early morning low. While there were more winners than losers it was certainly more of a case of who rallied which sent the market to within 0.4% of fresh decade highs, our largest 2 companies CBA +1% and BHP +1.9% lead the charge and that certainly underpinned the move at the index level. On the sector front it was again another “risk on day” with solid gains by the Energy and Resources sectors while Healthcare & Utilities again disappointed.
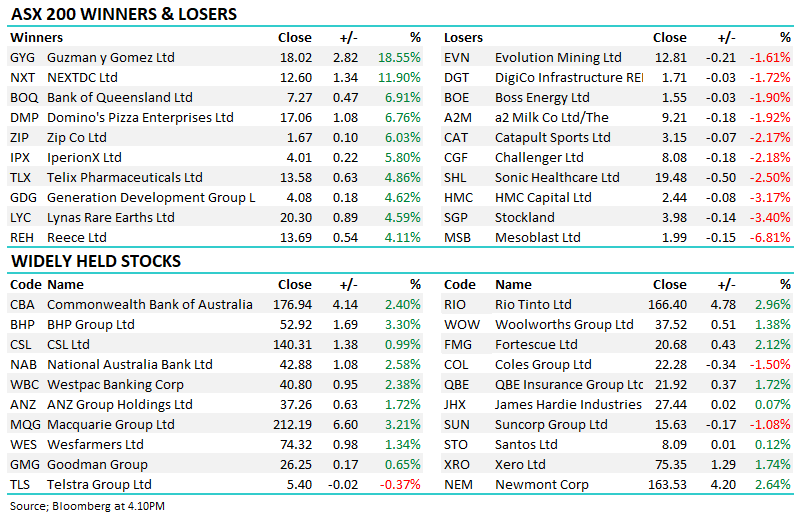
The EOFY has finally brought out some volatility under the hood with over 12% of the ASX200 moving by over 4% with the winners trumping the losers by almost 3:1. A few obvious dynamics are at play this week with bond yields bouncing slightly taking the gloss from the “yield play” stocks while iron ore and oil are rallying, taking with them the “risk on theme” as optimism clearly grows ahead of this weekends G20 meeting.
Yesterday we touched on Bitcoins huge surge over recent weeks and in a timely manner the crypto currency reminded us it’s a market which is vulnerable to supply & demand, just like any other plunging ~25% in just a few hours! We are not trying to alarm investors with regards to stocks but after an almost uninterrupted 1300-point / 24% rally a decent pullback would be normal market behaviour. Ideally for us we will see a small pop higher next week after the G20 meeting which may provide the opportunity to take further $$’s off the table.
MM is now in “sell mode” looking to adopt a more conservative stance than over the previous 6-months.
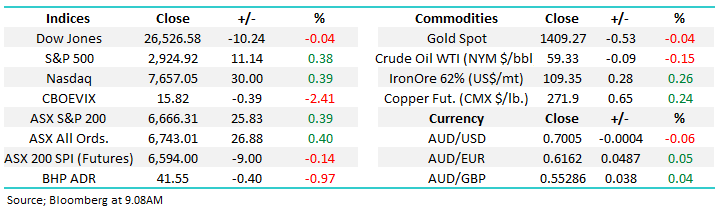
Overnight US stocks closed mixed as investors wait on this weekends G20 meeting, the SPI futures are calling the ASX200 down ~10-points early this morning with BHP closing down ~1% in the US.
In today’s report we are going to look at the “yield play” side of the market which has kept a lid on ASX200 gains over the last week.
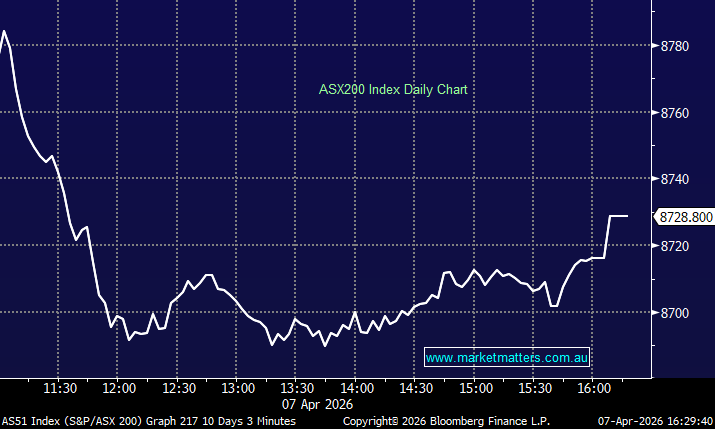
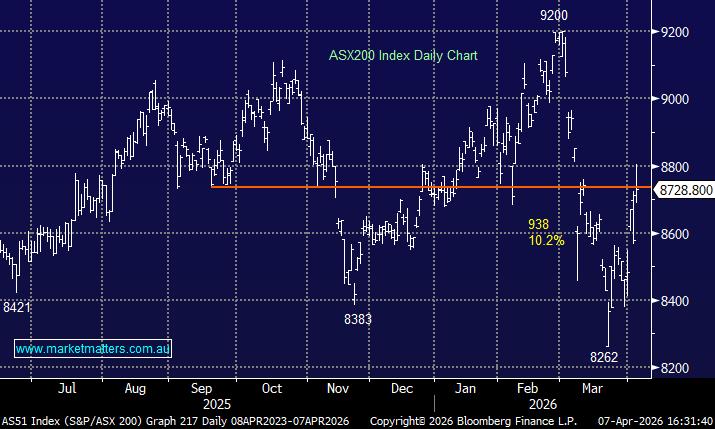
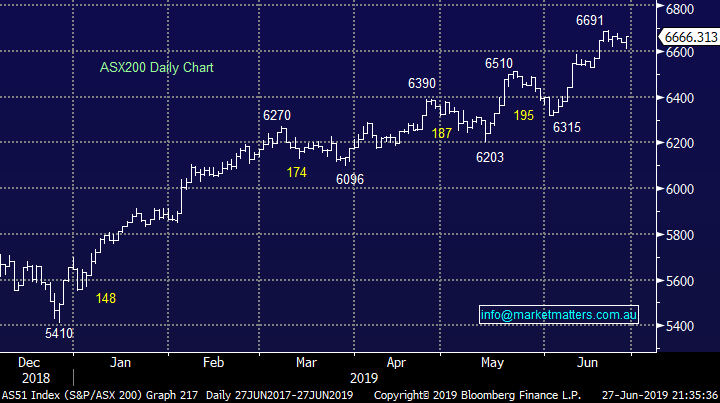
ASX200 Chart
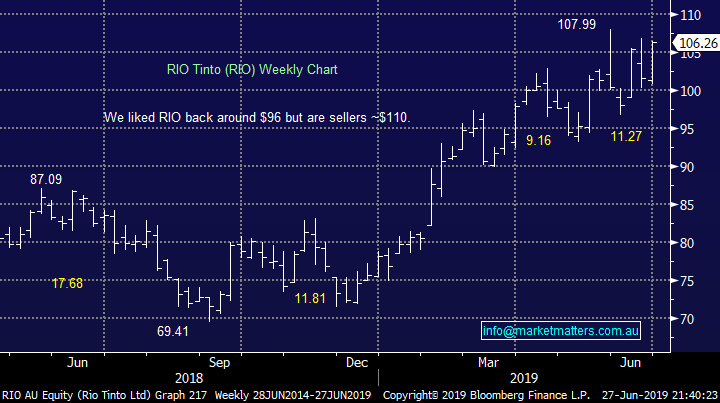
Yesterday both the iron ore price and respective stocks enjoyed another strong session with BHP closing at 8-year highs, Fortescue up over 5% testing post GFC highs and RIO now less than 4% below our technical target.
MM still believes this current push by the bulk commodity is one to fade, or at least take some $$ from the table.
Rio Tinto (RIO) Chart
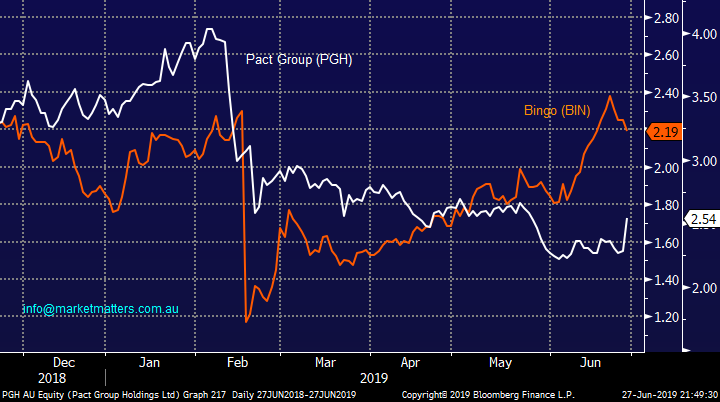
Yesterday MM took a healthy 57% profit on our Bingo (BIN) position and averaged our Pact Group position (PGH) which is still ~7% underwater:
1 – Bingo (BIN) $2.19
MM likes the company medium-term and probably will own it again, however it now feels the short-term picture simply has too many ‘what if’s’ for its current valuation i.e. 26x. Feedback from this week’s BIN site tour was overall positive, plus it was incredibly well attended – about 100pax on two coaches which shows a lot of interest in this stock (normally these tours get around 30pax), suddenly its been followed closely which in itself implies it’s an ideal time to get off the train to at least be an observer for a while.
On the positive side, BIN now hold truly strategic assets in growth corridors of Sydney and management are doing a very good job on integrating Dial-a-Dump. The combination of businesses and the cross section of recycling / waste management facilities that tap into infrastructure spend in Australia should ultimately be a positive for earnings – but that’s more a FY21/22 and beyond story. The near term negatives are around residential construction volumes plus BIN are about to amend their benchmark pricing across the book and it seems likely that they’ll forgo volumes to push through these increases. These increases have been a long time coming and joining the dots one could assume that margins may well have been under some pressure in the meantime which could come through at their 21st August full year result.
Throw the ACCC in the mix, a reasonably young management team + significant changes in customer pricing at a time when a large acquisition is being bedded down and the risks are building after the stocks positive rerating – hence our decision to book a nice profit.
2 – Pact Group (PGH) $2.54
We liked the news from PGH yesterday, which lead to the stock rallying +11.4%. In short, the market has been concerned about high debt and weak earnings leading to a potential capital raise and this crunched the stocks valuation. PGH addressed both of those issues yesterday refinancing $380m of debt plus re-confirmed earnings guidance, albeit at the lower end of prior guidance. No capital raise now likely in our opinion and given the markets negative positioning towards the stock, it should now have some clearer air. On a P/E of 10x, this stock is cheap (5 year average 14.2x) and while they’ll deliver flat earnings growth this year, next year the market is factoring in +8%.
PGH historical P/E Band
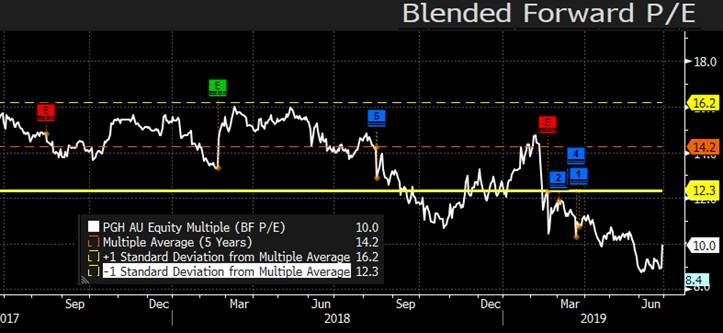
PGH shares are around 40% cheap relative to its 5 year history and lastly there has been some solid “insider buying” in PGH with no selling, a bullish indicator to MM.
We are bullish PGH and can see it outperforming BIN into 2020 although we do look at these investments as very much independent of each other.
Pact Group (PGH) and Bingo (BIN) Chart
Do the “yield play” stocks face a worrying run into 2020?
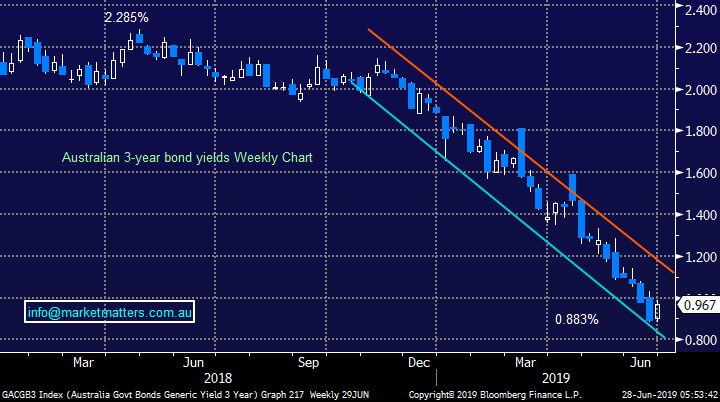
This week we’ve seen a very small bounce in the Australian 3-year bond yield, hardly registering on the chart below, but the stocks / sectors which have benefitted the most from the markets about turn on interest rates have received some noticeable attention from sellers as a more “risk on” theme has unfolded over the week. If we see any positive news from this weekends G20 meeting around US – China trade investors should expect further rotation between these sectors.
Its important to look forward at least 6-months with regard to major macro-economic views and in this case markets are already factoring in at least an additional 2 interest rate cuts by the RBA in 2019 i.e. from todays 1.25% to 0.75%. At MM we believe all the room for surprises is now on the disappointment side of the ledger for equities e.g. only one cut to 1% and the RBA then decide to wait and see while they have a little powder remaining in the keg. Hence with significantly lower interest rates are already baked into the equities cake, while very little consideration towards a deteriorating economy appears to be factored into stock prices - we feel risks are increasing for a market pullback.
MM has been comfortably long equities in 2019 and while we’re not saying “run-away” the easy money looks to be behind us and investors should become slightly more defensive & flexible.
MM believes the short-term risks for a bounce in bond yields are increasing.
Australian 3-year Bond yields Chart
Today we have looked at 5 stocks / sectors that are largely influenced by bond yields.
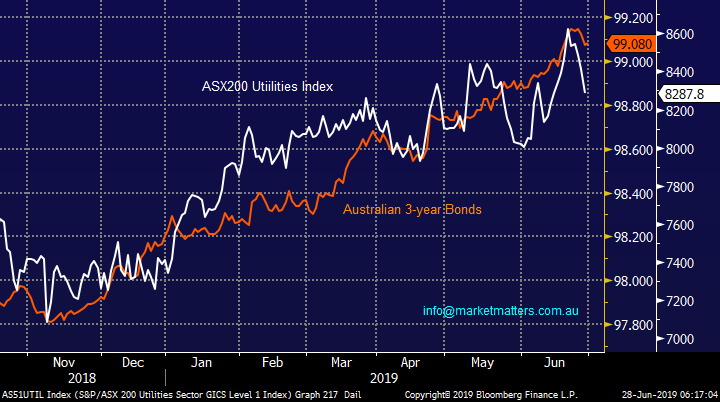
1 ASX200 Utilities Sector.
The below chart illustrates the excellent correlation between the Australian Utilities Sector and 3-year Bonds – remember the inverse relationship between 3-year bonds and their underlying yield i.e. as bonds rally their yields fall.
The last few days has seen an almost 4% correction by stocks in this sector following just a blip in bond yields implying to us that much of the good news is already factored into the sector. MM believes the Utilities stocks have at least another 3-4% to go on the downside, taking this pullback to a meaningful ~8%.
MM has no current interest in the likes of AGL Energy (AGL), Ausnet (AST), Spark Infrastructure (SKI) and APA group (APA).
ASX200 Utilities Sector v Australian 3-year Bonds Chart
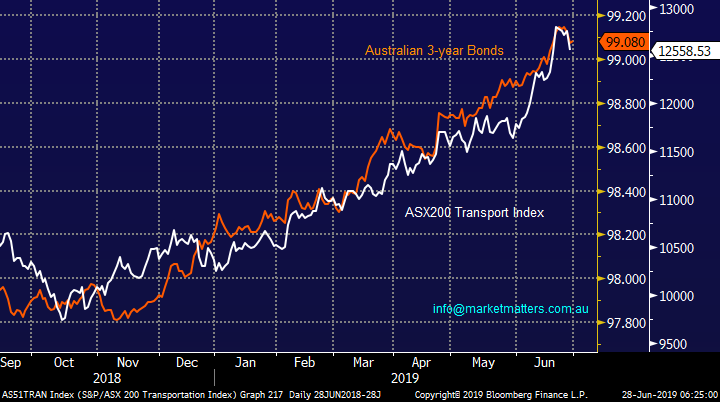
2 ASX200 Transport Sector
Similarly the below chart shows the excellent correlation between the Australian Transport Sector and 3-year Bonds. The last few days has seen only seen a 1.5% correction by stocks in this sector showing far more resilience than the Utilities. MM is neutral the overall Transport sector today.
However below we will take a brief quick look at 2 of the most popular stocks within the group.
ASX200 Transport Sector v Australian 3-year Bonds Chart
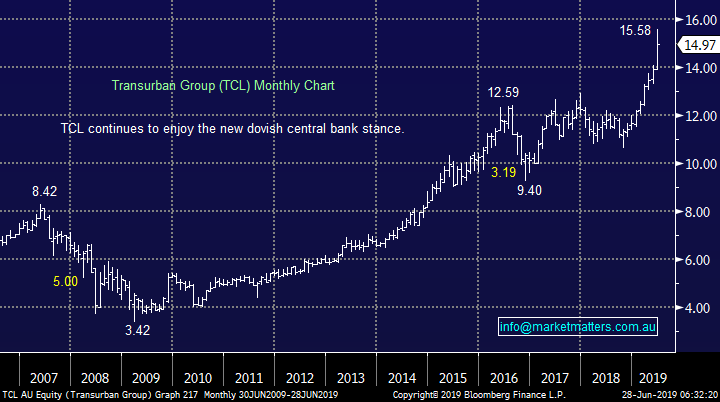
Transurban (TCL) has enjoyed an excellent few years as interest rates have trended lower and its this stage while we believe the stocks upside feels limited its popularity remains intact.
MM is neutral TCL.
Transurban (TCL) Chart
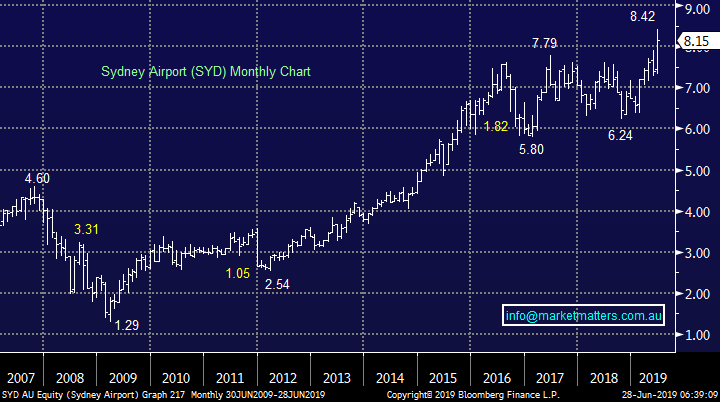
Sydney Airports (SYD) not surprisingly looks very similar to TCL just with slightly less euphoria. Again we have no reasons to sell SYD but technically the stocks is becoming very extended and is slowly appearing less attractive.
MM is neutral / negative SYD.
Sydney Airports (SYD) Chart
3 Healthcare Sector
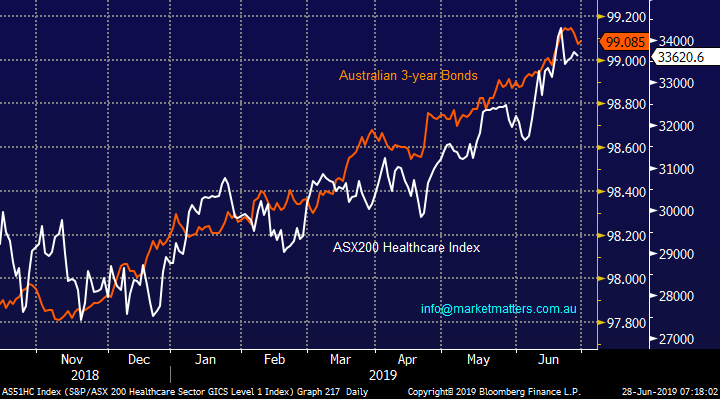
The Healthcare Sector has also demonstrated an excellent correlation to 3-year Bonds. In this case we are very mindful of the sharp decline in the sector in late 2018 where virtually all stocks with a high valuation were smacked, we feel this may have been a warning shot, as markets often give us, for what lies ahead.
At MM we are also bullish the $A over the next few years which will become a major headwind to the sector assuming we are correct, after having previously been a major tailwind since the GFC.
MM is not a fan of the Healthcare Sector at current levels / valuations.
ASX200 Healthcare Sector v Australian 3-year Bonds Chart
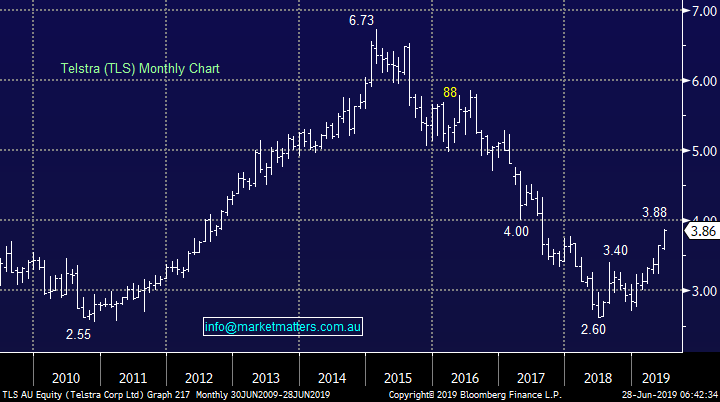
4 Telstra (TLS) $3.88
This week we held our Institutional Charity day where all brokerage raised on Wednesday from institutions was donated to worthwhile charities. 200k was donated this year, down from around 500k last year - the main difference being Telstra. On the day of the event last year, Telstra downgraded earnings and was sold off hard, hitting a $2.60 low with a huge amount of negativity hitting the stock - a significant amount of flow that day was in Telstra.
Fast forward 12 months and Australia’s largest Telco has bounced almost 50% - happily we enjoyed most of the stocks recovery but at this stage it does appear we have taken profit a little early.
Now as interest rates have fallen TLS’s 4.9% fully franked yield is still appealing to many investors – more so the sustainability of the dividend rather than the size. We’ve seen this with NAB (outperformance post dividend cut) recently and BHP / RIO a while ago when they stepped away from their ridiculous ‘progressive dividend policies’. Sustainability and predictability of yield remains the key and Telstra has clearly addressed this issue.
While we like TLS in terms of yield & defensives earnings qualities, there is now a lot of optimism build into the share price leading into an earnings report.
MM likes TLS but with an ideal entry ~3.70.
Telstra (TLS) Chart
5 The Banks
The banking sector has rallied strongly in 2019 for a number of reasons but their strong fully franked dividend’s clearly remains a factor with Westpac (WBC) still yielding 6.7% fully franked, well over double a term deposit. The relief that the Royal Banking Commission is largely behind us has also added a tailwind to the shares along with an underweight market following years of negativity / bad press, especially towards the risk of falling housing prices.
Importantly banks margins improve when interest rates rise hence they should fundamentally be relatively insulated if the market has again got bonds wrong and the RBA / Fed start increasing rates in the years ahead.
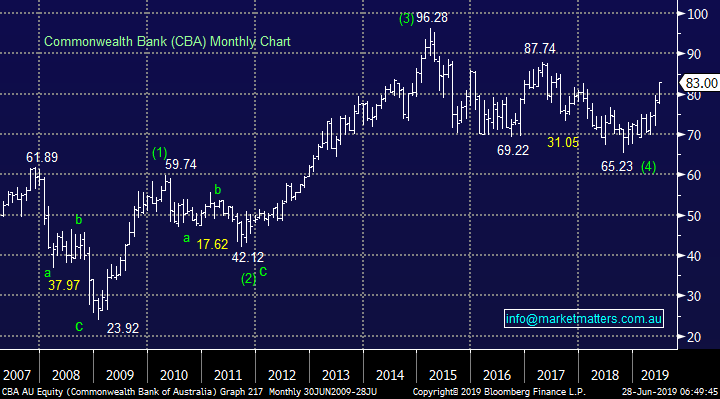
Market and sector heavyweight Commonwealth Bank has rallied ~27% from its 2018 low paying very healthy dividends along the way – at current levels CBA is still yielding 5.2% fully franked. Technically the stocks remains bullish but a 3-4% pullback would not surprise in the short term.
MM remains positive the banks.
Commonwealth Bank (CBA) Chart
Conclusion (s)
Investing for yield is all about targeting predictable and sustainable income streams and right now, banks and even Telstra are delivering on this. We remain bullish the banks & TLS into a pullback.
Global Indices
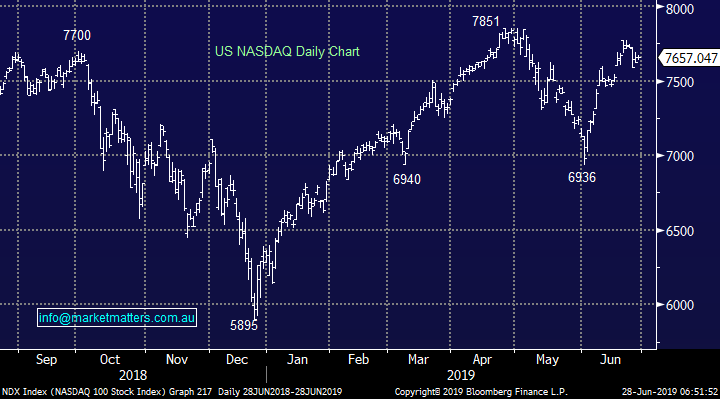
No change, while the S&P500 and small cap Russell 2000 are generating a few short-term sell signals the IT based NASDAQ looks poised to make a fresh all-time high – perhaps on positive news from the G20 meeting.
The technical target for the NASDAQ is ~3% higher.
US NASDAQ Index Chart
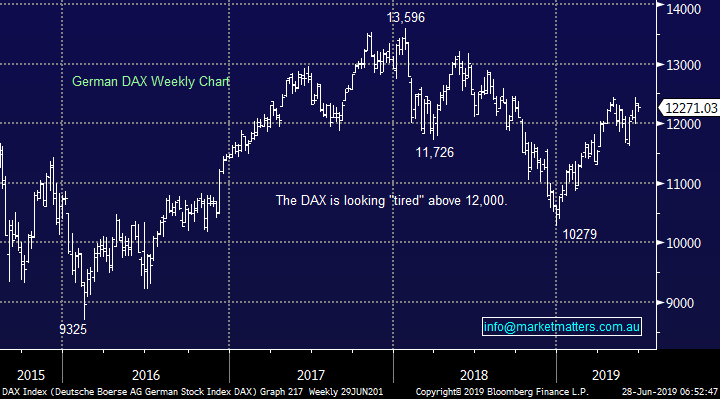
No change again with European indices, we remain cautious European stocks but the tone has improved recently and fresh highs in 2019 look a strong possibility.
German DAX Chart
Overnight Market Matters Wrap
· The US equities were little changed overnight ahead of the G20 meeting this weekend and the much waited head to head between US President Donald Trump and the Chinese President Xi Jinping to discuss the current trade dispute between both nations.
· The NASDAQ 100 closed a tad firmer as investors stood on the sidelines ahead of the talks, from which investors are looking for some signs of a resolution on trade tariffs. The banking sector in particular was firmer across the board, led by Citigroup ahead of the Federal Reserve stress test results due later today.
· Commodities were easier, with gold back to US$1409.27/oz. and oil also slightly easier after yesterday’s gains.
· Iron ore however hit a fresh 5 year high however BHP is expected to underperform the broader market after ending its US session off an equivalent of -0.97% from Australia’s previous close.
· The September SPI Futures is indicating the ASX 200 to open marginally lower, testing the 6660 level this morning.
Have a great day!
James & the Market Matters Team
Disclosure
Market Matters may hold stocks mentioned in this report. Subscribers can view a full list of holdings on the website by clicking here. Positions are updated each Friday, or after the session when positions are traded.
Disclaimer
All figures contained from sources believed to be accurate. Market Matters does not make any representation of warranty as to the accuracy of the figures and disclaims any liability resulting from any inaccuracy. Prices as at 28/06/2019
Reports and other documents published on this website and email (‘Reports’) are authored by Market Matters and the reports represent the views of Market Matters. The MarketMatters Report is based on technical analysis of companies, commodities and the market in general. Technical analysis focuses on interpreting charts and other data to determine what the market sentiment about a particular financial product is, or will be. Unlike fundamental analysis, it does not involve a detailed review of the company’s financial position.
The Reports contain general, as opposed to personal, advice. That means they are prepared for multiple distributions without consideration of your investment objectives, financial situation and needs (‘Personal Circumstances’). Accordingly, any advice given is not a recommendation that a particular course of action is suitable for you and the advice is therefore not to be acted on as investment advice. You must assess whether or not any advice is appropriate for your Personal Circumstances before making any investment decisions. You can either make this assessment yourself, or if you require a personal recommendation, you can seek the assistance of a financial advisor. Market Matters or its author(s) accepts no responsibility for any losses or damages resulting from decisions made from or because of information within this publication. Investing and trading in financial products are always risky, so you should do your own research before buying or selling a financial product.
The Reports are published by Market Matters in good faith based on the facts known to it at the time of their preparation and do not purport to contain all relevant information with respect to the financial products to which they relate. Although the Reports are based on information obtained from sources believed to be reliable, Market Matters does not make any representation or warranty that they are accurate, complete or up to date and Market Matters accepts no obligation to correct or update the information or opinions in the Reports. Market Matters may publish content sourced from external content providers.
If you rely on a Report, you do so at your own risk. Past performance is not an indication of future performance. Any projections are estimates only and may not be realised in the future. Except to the extent that liability under any law cannot be excluded, Market Matters disclaims liability for all loss or damage arising as a result of any opinion, advice, recommendation, representation or information expressly or impliedly published in or in relation to this report not with standing any error or omission including negligence.