How bad could this “WAAAX selling” become? (CGC, PDL, NAB, WTC, APX, ALU, APT, XRO)
The ASX200 ended Wednesday like the rest of the week, giving back early gains although this time the selling continued unabated all day leaving the index down over -0.5% by the final bell. Less than 30% of the ASX200 closed up with notable losses in the high valuation IT sector which we will cover today while the large cap resource stocks, and previously out of favour fund managers, enjoyed solid gains on a day when red dominated screens. No surprise to MM who remain bullish cyclicals like banks / resources and bearish growth / defensives e.g. The IT and Healthcare Sectors.
One sector of the market we haven’t looked too closely at within the cyclical group is the Energy Sector, the MM Growth Portfolio has some exposure via BHP while in the Income Portfolio we hold Woodside Petroleum (WPL) – is the enough considering our current views? The US energy sector has generated technical buy signals unlike our own but we are getting very close, after further inspection MM feels any increase to its resources position may come via the Energy Sector, well take a closer look in future report.
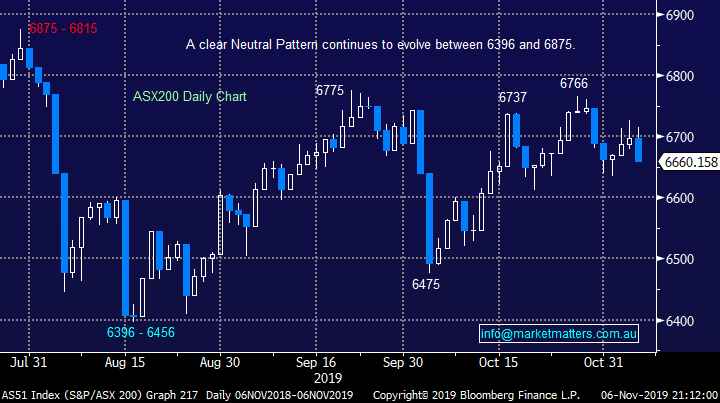
Technically when the ASX continues to close towards its intra-day lows it’s often a precursor for a more aggressive move to the downside, our initial target is again the 6600 area. One of our favourite sayings at MM is a market which cannot rally on good news is a weak / bearish market, the US S&P500 has made fresh all-time highs all week yet we closed over 3% below Julys high, not an encouraging sign.
Short-term MM remains neutral the ASX200 with a downside bias – 6600 is again looming fast.
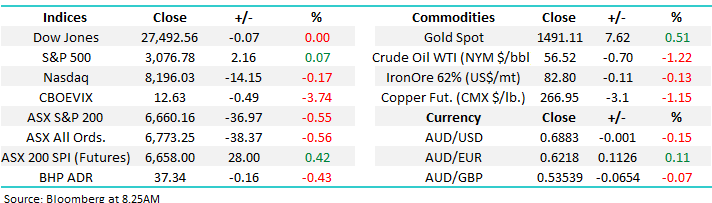
Overnight global stocks were firm led by Europe where the EuroStoxx climbed 0.3%, the ASX looks poised to open up a similar amount today.
This morning MM has looked at the almost panic like selling that’s rolling through the Australian IT sector with one eye as always on when may value present itself, its relatively easy to write an interesting piece on the whys and wherefores but it’s the levels that we should consider putting our hard earned $$ to work that matters the most.
ASX200 Chart
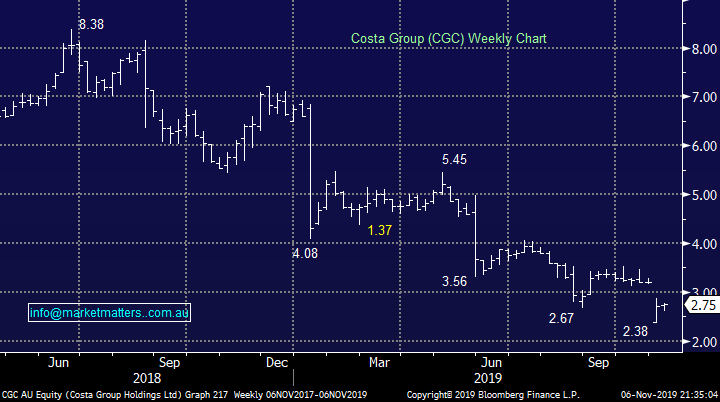
Yesterday MM reduced our holding in Costa Group (CGC) from 7.2% to 5%. The 7.2% weighting included the renounceable rights we have to buy more stocks at $2.20 per share. It’s important that subscribers understand this was more of an exercise in money management than any increase of concern with this position i.e. given we plan to take up new shares through the raise at $2.20 we felt our position was simply a touch too large.
Just a reminder, the rights are to buy 1 new share for every 4 we held as at the record date of the 31st October. Information on this entitlement was sent to retail shareholders yesterday.
MM remains comfortable with our lower 5% holding in CGC.
Costa Group (CGC) Chart
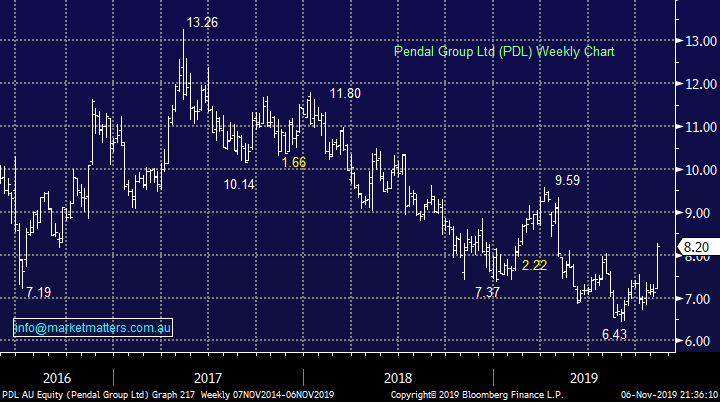
Our second alert yesterday was frustrating, initially we tried to buy Pendal Group (PDL) at $7.75 and then at $8, both to no avail – it looks like our bullish comments in the last morning report were on the money. The question this morning is where or do we chase it higher following yesterday’s 10% advance. We still want to be long this stocks and believe that yesterday’s result was enough to see the stock commence a re-rate , they still experienced outflows of $4.7bn, profits were down 24% and performance fees fell almost 90% following its severing of ties with Westpac, a good platform going forward but arguably not one to chase too aggressively right now.
The previous BT is an active manager who’ve had a tough few years but with sector rotation coming back into vogue and BREXIT feeling close to a resolution we feel PDL is well positioned moving forward, however we are maintaining discipline with an $8 limit price on our buy call.
MM remains bullish PDL initially targeting ~15 to 20% upside.
Pendal Group (PDL) Chart
**NAB Result – has just reported full year results with underlying cash earnings coming in line with market expectations. No capital raise (other than underwriting their DRP) and interestingly underlying income was up 1.1% while costs increased by 0.4%, which is good relative to what we saw from WBC and ANZ - this is known as positive Jaws. Dividend was maintained at 83c as was expected. All in all, holding up well in a tough environment.**
WAAAX stocks remain under pressure
The Australian IT stocks had became so popular in recent times that the dominant players were named the WAAAX stocks i.e. Wisetech (WTC), Appen (APX), Altium (ALU), Afterpay Touch (APT) and Xero (XRO). While these are all exciting companies with great prospects and we should applaud them for the success they’ve had, we simply saw valuations become too high. P/E’s are not as relevant here given the companies are in growth mode however using Altium as an example, this is a $4.2bn producing revenue of ~$200m, a multiple of 20x sales. I’m a happy seller of most businesses on that metric, my own included!
However, when momentum traders and FOMO (Fear of Missing Out) is dominating proceedings stocks tend to run much further than common sense would usually dictate. Suddenly now I’m reading numerous reports around the “WAAAX off” theme but at MM we would rather stand back and say “great we’ve avoided the current carnage but where could panic selling create opportunities”.
The growth stocks have thoroughly enjoyed the economic tailwind of falling bond yields (interest rates) but since they’ve plateaued in September the sector buyers appear to have vanished on mass. Also the improvement in trade relations between the US & China has led to some definite rotation back into the value stocks, considering there has been many years of outperformance by the growth stocks common sense suggests that far more than a few weeks rotation is ahead of us.
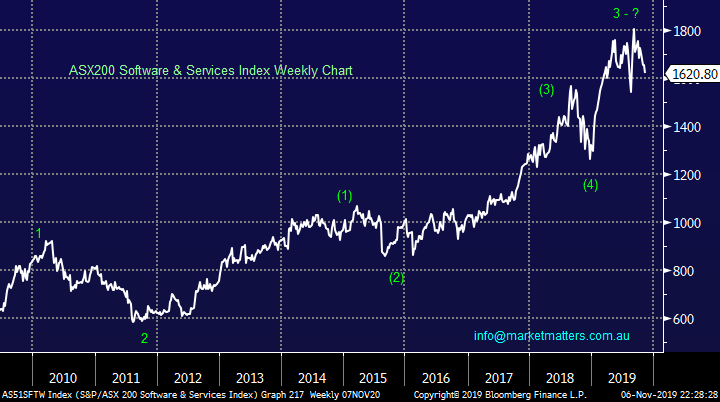
Technically we remain short-term bearish with an initial target ~5% lower but if we return to the sectors medium-term rhythm we could return to the late 2018 lows, almost 20% lower – caution is warranted even after the current 10% pullback.
MM remains bearish the Australian IT Sector.
ASX200 Software & Services Index Chart
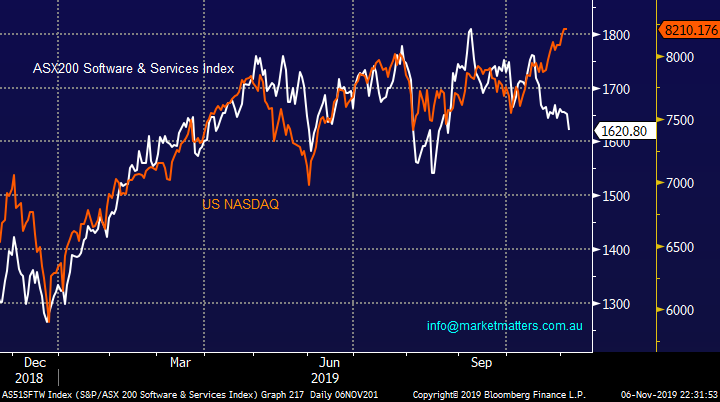
Interestingly the correction by our IT stocks has not been accompanied by the US NASDAQ which has continued to make fresh all-time highs. However when we stand back and compare the 2 groups we see far more quality and proven track records in the US group e.g. Apple (AAPL US), Microsoft (MSFT US), Amazon (AMZN US) and Facebook (FB US). In the past 6-months we’ve said we like the US tech space to outperform our own and we stick with this opinion into 2020.
ASX200 Software & Services Index v NASDAQ Chart
Moving onto the 5 stocks within the named WAAAX group:
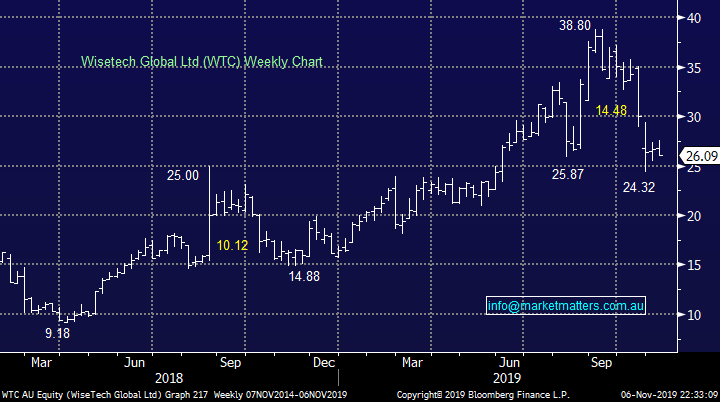
1 Wisetech Global (WTC) $26.09
Global provider of cloud-based software solutions for the logistics sector WTC has been hammered over 35% since being on the receiving end of a damning report from Hong Kong hedge fund J Capital which basically called WTC a big sell with allegations around inflated profits – the report was well written and investors have clearly listened. This was a stock priced for perfection, not question makes over its accounting practices.
We can see a trading opportunity around $23.50 but only for the aggressive player, to us it’s simply in the too hard basket.
MM is neutral / bearish WTC at current levels.
Wisetech Global (WTC) Chart
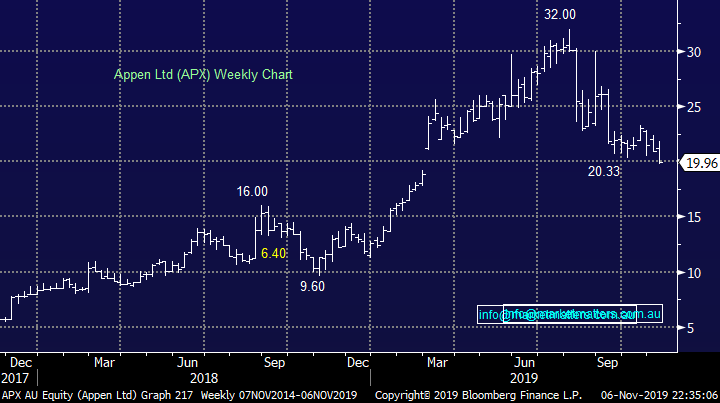
2 Appen Ltd (APX) $19.96
APX is a global leader in the machine learning & artificial intelligence space but its shares have tumbled well over -35% from their 2019 highs as the stock demonstrates that crazy valuations usually come down to earth at some point. APX has more foundation to it in terms of earnings and their customer base has proven to be very sticky which doesn’t seem to be the case with WTC. That suggests their products have real competitive advantage.
APX is trading on a P/E for 2019 of ~40x – lofty but when anchored to expected earnings growth of ~30% over the next couple of years this is a business we are more comfortable with.
MM is growing more positive on APX below $20
Appen Ltd (APX) Chart
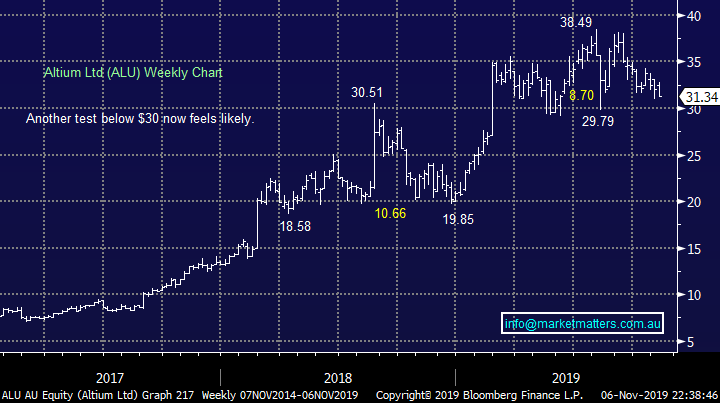
3 Altium Ltd (ALU) $31.34
ALU develops electronic PCB software, including design automation (EDA) software for the Microsoft Windows operating system, the company believes they can continue to grow until 2025 with a target then of ~$US500m revenue. China is a growth area for ALU hence the trade wars haven’t helped the stock but in a world where technology growth appears almost guaranteed ALU’s goals appear realistic.
The stock is very expensive on traditional metrics trading on an estimated P/E for 2020 of 46.5x however their Altium 365 product is cutting edge and this should underpin future growth. The current almost 20% pullback could become a major opportunity if the negativity towards the sector gathers momentum as we believe it will.
MM likes ALU around $28-$29.
Altium Ltd (ALU) Chart
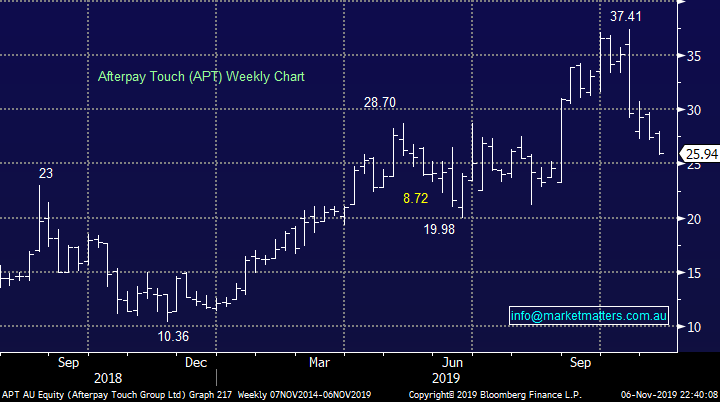
4 Afterpay Touch (APT) $25.94
Afterpay APT is a story we haven’t fully embraced at MM which has looked daft at times but today its nice to have avoided the current 30% correction. Broking powerhouse UBS recently dropped a bomb on APT’s share price citing concerns around competition in the US, an area of intended huge expansion for the buy now pay later operator.
UBS has a target for APT of $17.25, still over 30% lower and with the stock trading on a P/E for 2020 of 665x!! there’s certainly plenty of room for a correction on valuation grounds. At this stage, we think 2020 will be a year characterised by higher competition and higher regulatory scrutiny.
MM can see APT again testing the $20 area.
Afterpay Touch (APT) Chart
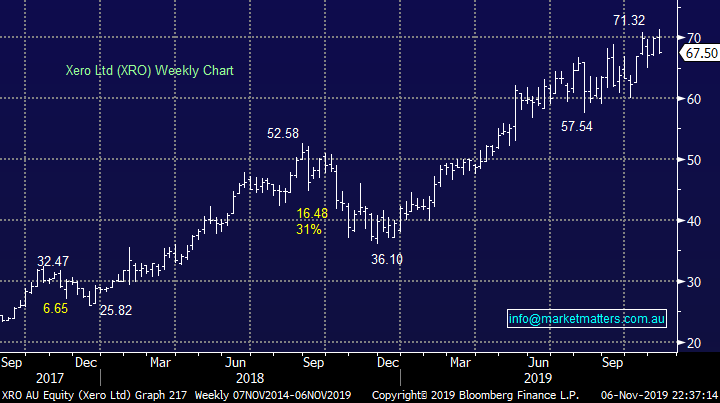
5 Xero Ltd (XRO) $67.50
Lastly XRO which has just reported 1H20 results this morning booking subscriber growth of 30% and revenue growth of 32% - these numbers look strong with market expectations for around 25% subscriber growth - importantly, they also booked free cash flow of $4.8m. They surpassed 2m subscribers which is a few more than MM at this stage - this is a real milestone for the business. Interestingly, it took them ~10 years to get their first 1m and only 2.5 years to get their 2nd showing the power of the platform and their distribution strategy.
This is clearly a great business which has enjoyed 2019 to date. Today should have another solid day today however ultimately we believe it’s too rich at current levels. We are looking for a pullback with a simple mild valuation rerating by the sector.
We feel patience should reward those in XRO at some point.
MM likes XRO around $57.
Xero Ltd (XRO) Chart
Conclusion (s)
MM sees at least another 5% downside for the Australian IT sector and potentially 20%.
At this stage the stocks we are keenest on are APX & ALU, while we could buy XRO around $57.
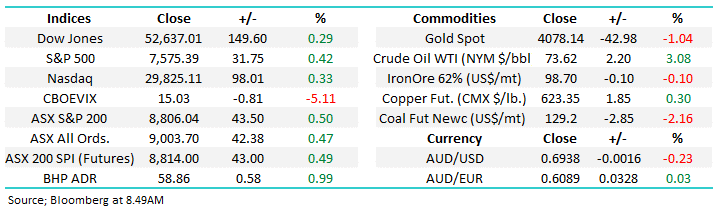
Global Indices
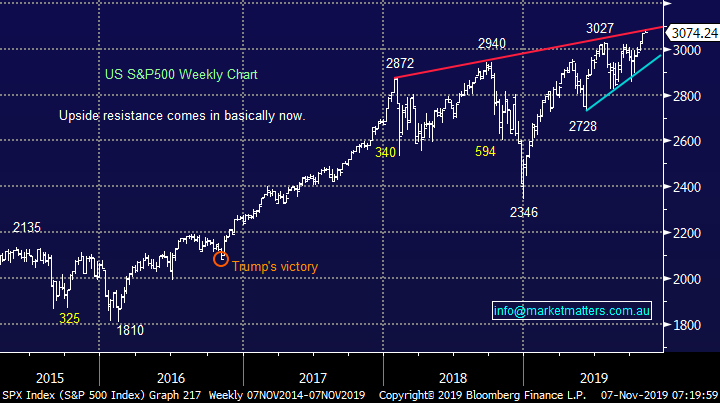
No change, we had given the benefit of the doubt to the post GFC bull market and fresh all-time highs have been achieved as anticipated but major resistance is now being tested reverting us to a neutral stance. A break below 3000 is required to switch us to a bearish short-term stance, still over 1% away.
MM is now neutral US stocks.
US S&P500 Index Chart
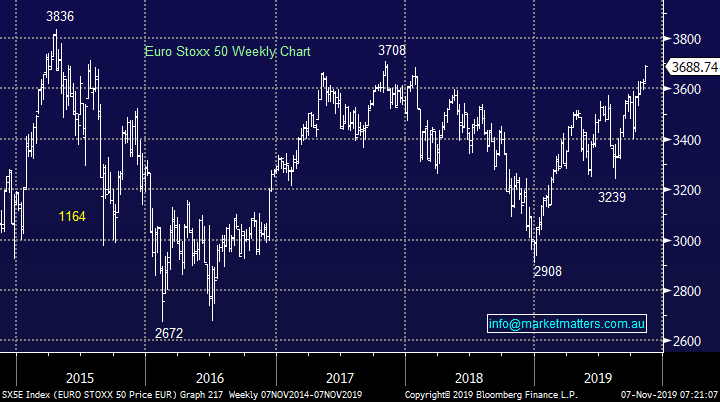
European indices continue to “climb a wall of worry” at this point in time MM is neutral but we maintain our slight positive bias.
Euro Stoxx50 Chart
Overnight Market Matters Wrap
- The US equity markets closed with little change yet again overnight, as investors’ fears start to cloud their minds on the on again, off again US-China trade deal progress. At present, we are now sitting on a delay of at least December.
- Crude oil slid on the back of the resurfaced uncertainty, currently off 1.22% at US$56.52/bbl.
- BHP is expected to underperform the broader market after ending its US session off an equivalent of -0.43% from Australia’s previous close.
- The December SPI Futures is indicating the ASX 200 to open 26 points higher, around the 6685 level this morning.
Have a great day!
James & the Market Matters Team
Disclosure
Market Matters may hold stocks mentioned in this report. Subscribers can view a full list of holdings on the website by clicking here. Positions are updated each Friday, or after the session when positions are traded.
Disclaimer
All figures contained from sources believed to be accurate. All prices stated are based on the last close price at the time of writing unless otherwise noted. Market Matters does not make any representation of warranty as to the accuracy of the figures or prices and disclaims any liability resulting from any inaccuracy.
Reports and other documents published on this website and email (‘Reports’) are authored by Market Matters and the reports represent the views of Market Matters. The Market Matters Report is based on technical analysis of companies, commodities and the market in general. Technical analysis focuses on interpreting charts and other data to determine what the market sentiment about a particular financial product is, or will be. Unlike fundamental analysis, it does not involve a detailed review of the company’s financial position.
The Reports contain general, as opposed to personal, advice. That means they are prepared for multiple distributions without consideration of your investment objectives, financial situation and needs (‘Personal Circumstances’). Accordingly, any advice given is not a recommendation that a particular course of action is suitable for you and the advice is therefore not to be acted on as investment advice. You must assess whether or not any advice is appropriate for your Personal Circumstances before making any investment decisions. You can either make this assessment yourself, or if you require a personal recommendation, you can seek the assistance of a financial advisor. Market Matters or its author(s) accepts no responsibility for any losses or damages resulting from decisions made from or because of information within this publication. Investing and trading in financial products are always risky, so you should do your own research before buying or selling a financial product.
The Reports are published by Market Matters in good faith based on the facts known to it at the time of their preparation and do not purport to contain all relevant information with respect to the financial products to which they relate. Although the Reports are based on information obtained from sources believed to be reliable, Market Matters does not make any representation or warranty that they are accurate, complete or up to date and Market Matters accepts no obligation to correct or update the information or opinions in the Reports. Market Matters may publish content sourced from external content providers.
If you rely on a Report, you do so at your own risk. Past performance is not an indication of future performance. Any projections are estimates only and may not be realised in the future. Except to the extent that liability under any law cannot be excluded, Market Matters disclaims liability for all loss or damage arising as a result of any opinion, advice, recommendation, representation or information expressly or impliedly published in or in relation to this report notwithstanding any error or omission including negligence.