Have the RBA just moved the goalposts? (TCL, GMG, BLD)
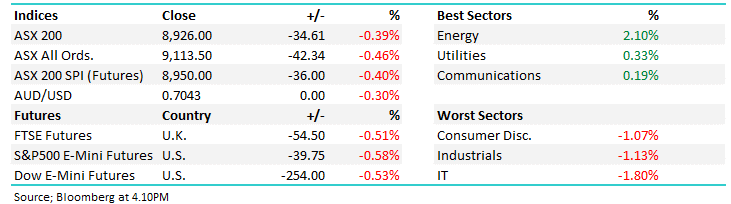
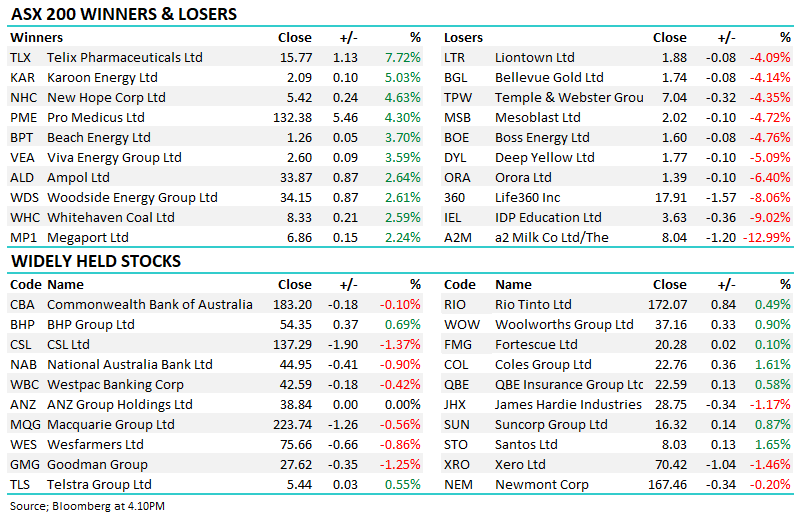
The ASX200 surged 63-points yesterday taking the rally from last Thursdays low to 215-points, or 3.2% in just a few days. The buying remains very broad-based with all 11 of the major sectors closing up on the day although the Telco’s were the only group that managed to rally over 2% courtesy of Telstra’s (TLS) +2.8% gain.
The RBA appears to have lit the fire beneath our market this week with Australia’s most closely followed economist, Bill Evans from Westpac (WBC), now calling the RBA to cut official interest rates to 0.25% before the next financial year. Also, he is anticipating Quantitative Easing will commence in the second half of 2020, clearly, he has no faith that Australia’s Central Bank can achieve their growth, inflation and unemployment targets without further major stimulus.
MM also anticipates fiscal stimulus to be implemented by the Liberal Party in 2020, certainly plenty of fuel for equities to continue their rally – the question we ask today is has the RBA altered our view for stocks into 2020.
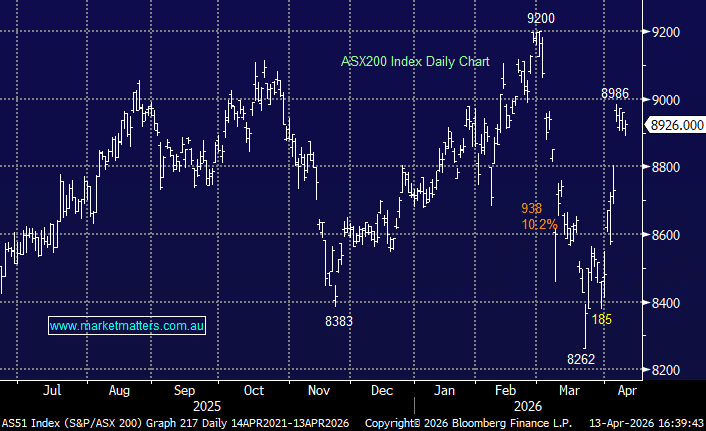
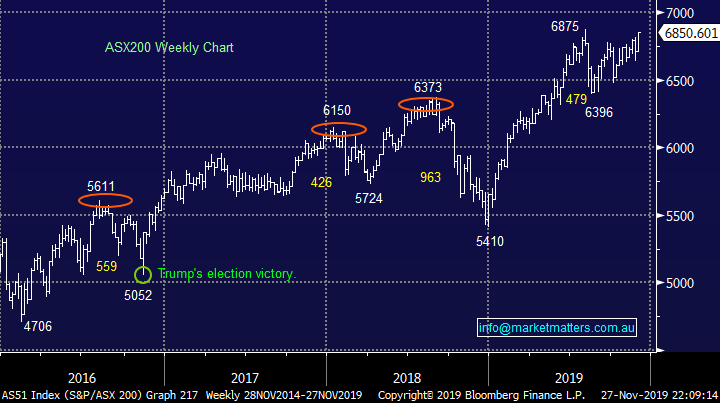
Following yesterday’s strong +0.9% rally the ASX200 is a buy technically with stops under 6800 – less than 1% risk.
Local stocks are also enjoying support from global markets with the major US indices making fresh all-time highs almost daily as cashed up fund managers appear to be slowly forced into stocks or risk some bad quarters on the relative performance front – no change appears likely in 2019.
Short-term MM remains neutral the ASX200 with an increasing upside bias.
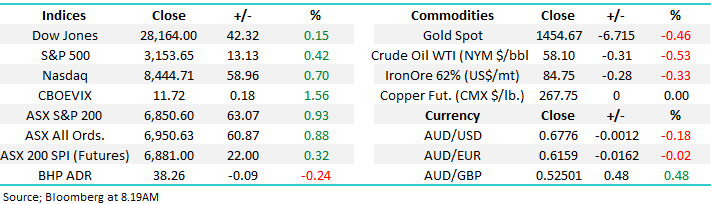
Overnight global stocks were again stronger with gains being led by the tech sector, the NASDAQ rallied +0.7% and the SPI futures are calling the ASX200 top open at a fresh all-time high – next stop 6900!
This morning MM has focused on the RBA’s updated stance this week and our expected ramifications into 2020, we’ve deliberately kept the report relatively short to ensure clarity with our views moving forward.
**No trade tonight in the US – closed for Thanksgiving and half day Friday**
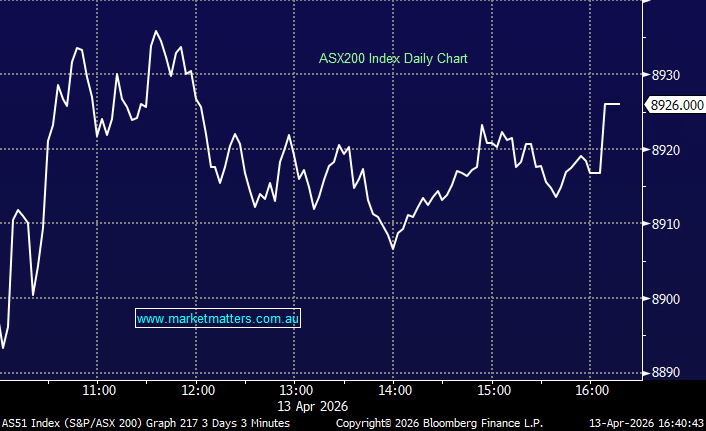
ASX200 Chart
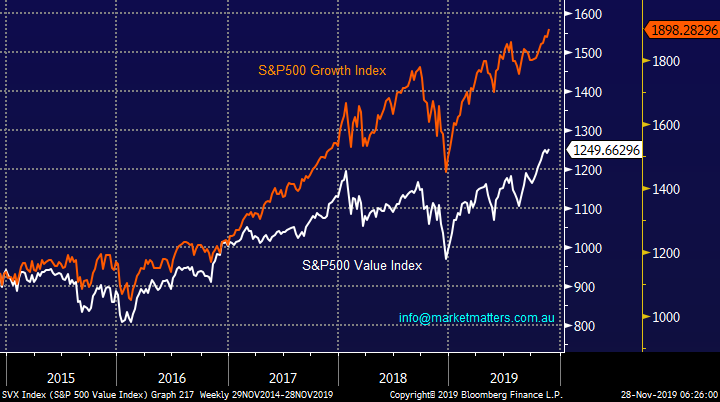
While global bond yields remain on target to make the fresh all-time lows we expect, growth stocks have outperformed value although the later has recently broken out to fresh all-time highs – a bullish indicator in itself.
MM expects the likes of Healthcare, Tech and “yield Play” stocks to outperform Banks / Resources until bond yields turn up again.
US S&P500 Value & Growth Indices Chart
The Ramifications of Philip Lowes (RBA) speech
We actually believe Westpac’s chief economists interpretation of Mr Lowes comments are probably more important than the content itself – he’s arguably the most closely watched in the field at present and if he says 2 more cuts in the next 6-months and QE in the second half of 2020 many fund managers are going to price these changes into their portfolio decision making mix moving forward.
He’s now calling the RBA to drop its official cash rate from 0.75% to 0.25% i.e. slashing interest rates by over 65% in an effort to kick start our economy. My concern is that when rates are around zero the RBA will have fired its major bullets. While things feel tough on the street it’s not close to deep recession levels which these interest rates imply. MM feels the next downturn in stocks will be triggered by anticipation of an unstoppable recession or central banks being forced to raise interest rates relatively fast to stave off inflation – both feel a distant way off at this point in time but worth pondering none-the-less.
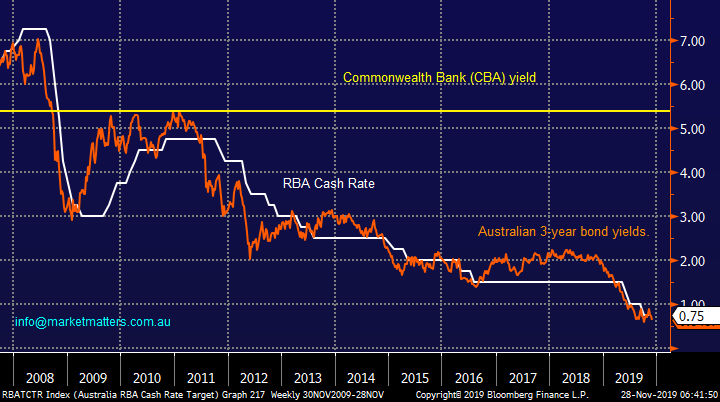
Markets simply feel entrenched in a yield chasing mood at present, no great surprise when term deposits look destined to plummet under 1% compared to say CBA which is paying an attractive ~5.3% fully franked yield (albeit with greater volatility / risk). An almost panic like chase for yield feels to be still brewing under the surface hence our view that the ASX200 will breach 7000 in 2019.
RBA Cash Rate v Australian 3-year Bonds & CBA yields Chart
At MM we have been anticipating 2 scenarios to unfold into 2020:
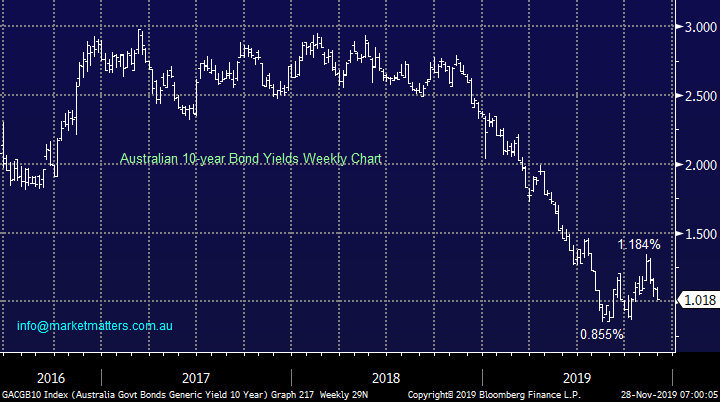
1 – A bottom to form in bond yields with our best guess for the closely watched Australian 10-years around the 0.75% level i.e. coincidentally todays RBA Cash Rate.
2 - A plateau in official interest rates that may last longer than many anticipate, we previously thought at 0.5% but now 0.25% feels more likely.
We remain comfortable with both of the above scenarios although rates approaching zero is likely to be even more supportive of stocks with relatively decent sustainable yield. When bond yields eventually turn higher, we envisage we will see money flow from the likes of Healthcare and IT stocks into Banks and Resources, but this elastic band should still have further to stretch.
MM is targeting a low for Australian Bond Yields in Q1 of 2020.
NB, we expect bond yields to bottom before official rates.
Australian 10-year Bonds Chart
Looking at relative valuations for a moment, the Australian market overall is expensive, trading on 17.4x projected earnings however it’s certainly not the banks nor the materials that are driving this valuation.
The banks are trading on 13.48x which is in the 84% percentile of valuation in absolute terms, however not overly stretched when thinking about interested rates going to 0.25%
Banks – Price to Earnings (P/E)
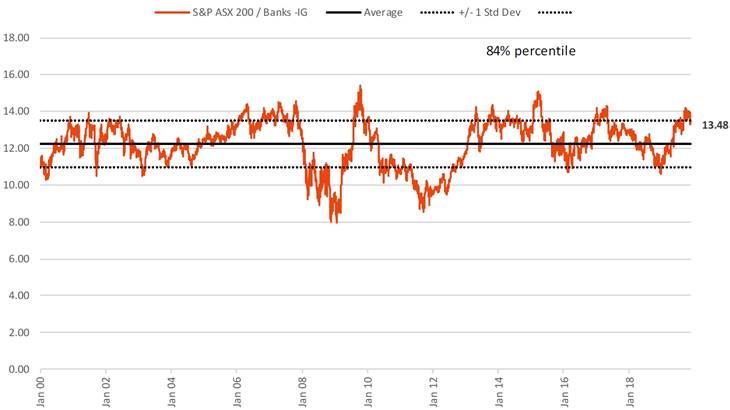
Source: Shaw and Partners
The Materials sector includes building material stocks as well as resources and a few other bits and pieces – this sector is cheap and a hunting ground for MM moving forward.
Materials – Price to Earnings (P/E)
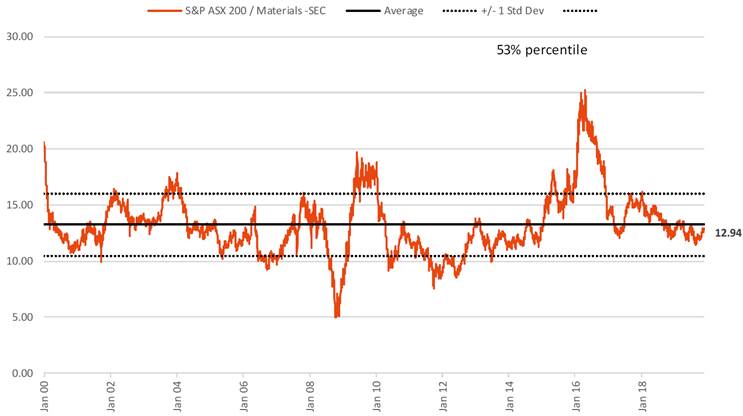
Source: Shaw and Partners
Looking at ‘everything else’ as determined by the industrials ex-banks, this is where the money is clearly flowing, putting these stocks on the highest valuation in history.
Industrial excluding Banks – Price to Earnings (P/E)
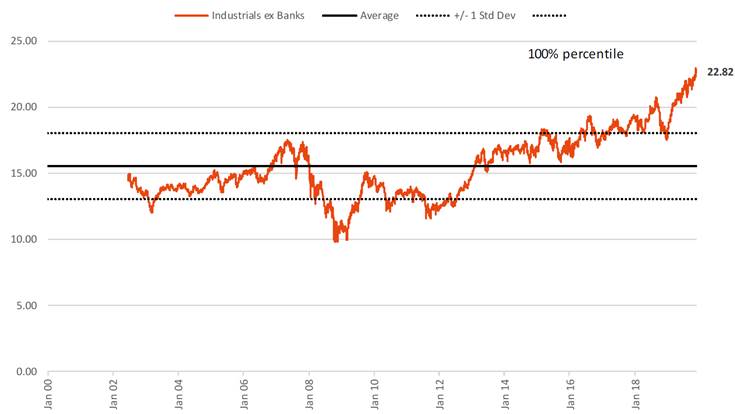
Source: Shaw and Partners
At MM we believe that although it might be the last bite of the proverbial sandwich for this yield driven over a decade long bull market it’s highly unlikely that investors will be selling stocks that pay them sustainable yield anytime soon – term deposits paying under 1% are not an exciting option. Remember what we said earlier - until we see / believe that a recession is unavoidable, or inflation kicks in to force central banks to raise rates the market looks set to enjoy ongoing strong tailwinds in 2020. While valuations are clearly stretched, some areas more than others with interest rates approaching zero stocks remain the most attractive asset class (we covered this in am income note recently – click here)
The stocks that we have considered earlier remain well positioned into even after strong years by the first 2:
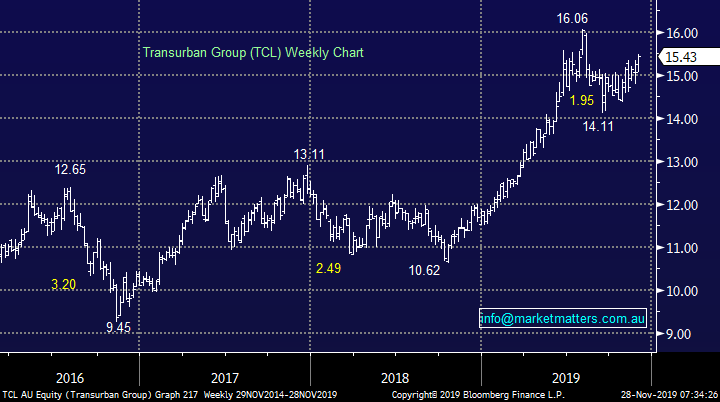
1 Transurban (TCL) $15.43
Toll road operator Transurban (TCL) has rallied strongly since late 2018 but when your yielding 4%, slightly franked, it makes sense.
MM is bullish TCL targeting fresh all-time highs.
We own TCL in our Income Portfolio.
Transurban (TCL) Chart
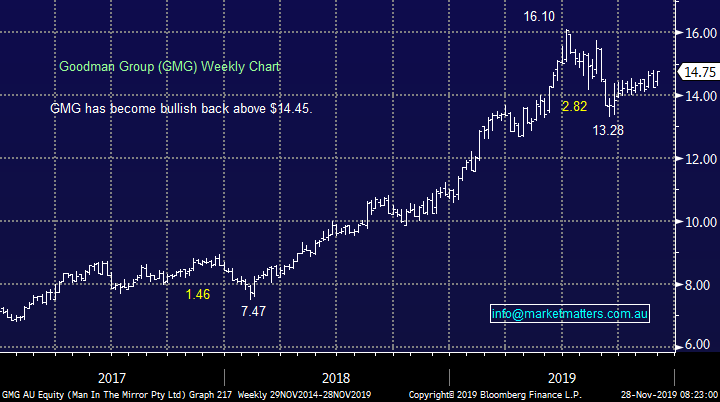
2 Goodman Group (GMG) $14.75
Integrated industrial property group is another large winner since late 2019 and although its unfranked 2% yield is not going to have investors flocking in droves the business does love a low interest rate environment.
MM is bullish GMG targeting fresh all-time highs.
Goodman Group (GMG) Chart
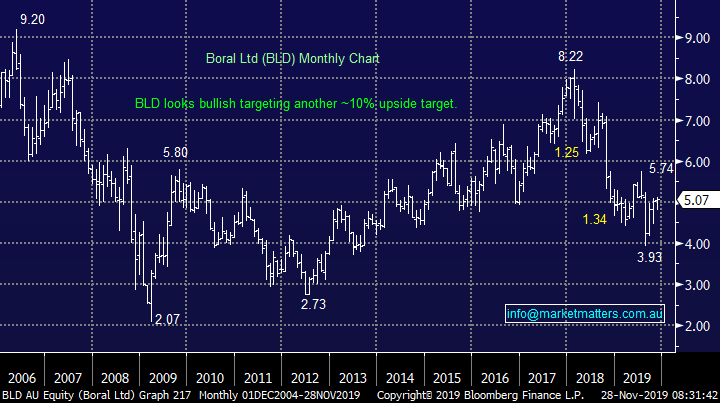
3 Boral Ltd (BLD) $5.07
Looking outside of the more traditional “yield play” stocks Boral (BLD) is well positioned for an improving property market courtesy of collapsing interest rates and potential fiscal stimulus which we expect to be unveiled in the second half of 2020 hence its `yield above 5%, 50% franked, is likely to garner some attention moving forward.
MM remains long and bullish BLD.
We own BLD in our Growth Portfolio
Boral Ltd (BLD) Chart
Conclusion (s)
MM is bullish TCL, GMG and BLD into Q1 of 2020, importantly we believe the time is approaching rapidly when money will flow into less traditional high yielding plays like Boral (BLD) as valuations rise elsewhere.
Global Indices
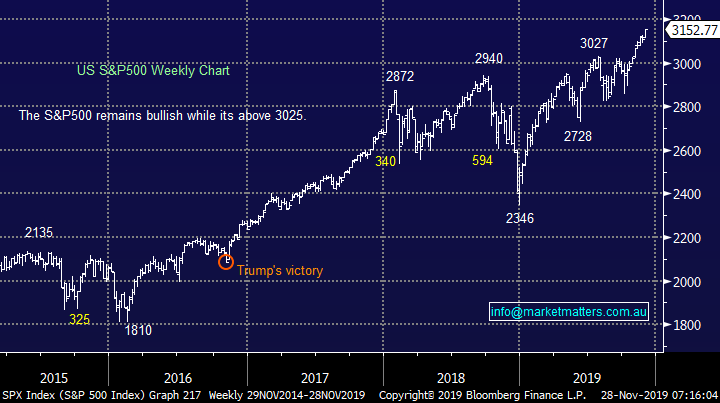
No major change, we had given the benefit of the doubt to the post GFC bull market and fresh all-time highs have been achieved as anticipated, a close well under 3025 is required for the S&P500 to switch us to a bearish short-term stance.
MM is now neutral / positive US stocks.
US S&P500 Index Chart
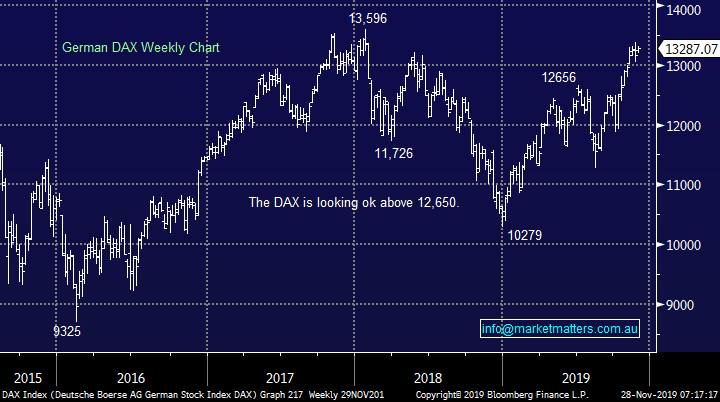
European indices continue to “climb a wall of worry” at this point in time MM is neutral but we maintain our slight positive bias with a target ~8% higher looking realistic.
German DAX Chart
Overnight Market Matters Wrap
- US equity markets gained overnight ahead of its Thanksgiving holiday tonight following the release of better than expected US economic data including an upward revision of the 3rd quarter GDP from 1.9% to 2.2%, a solid 0.3% increase in consumer spending, as well as a strong rebound of 0.6% in durable goods orders in October.
- Commodities were mostly weaker overnight as seen with the three musketeers, gold, crude oil and iron in the red sea, while dr. copper was unchanged
- BHP is expected to underperform the broader market after ending its US session off an equivalent of 0.24% from Australia’s previous close.
- The December SPI Futures is indicating the ASX 200 to open 28 points higher and hit fresh new highs towards the 6880 level this morning.
Have a great day!
James & the Market Matters Team
Disclosure
Market Matters may hold stocks mentioned in this report. Subscribers can view a full list of holdings on the website by clicking here. Positions are updated each Friday, or after the session when positions are traded.
Disclaimer
All figures contained from sources believed to be accurate. All prices stated are based on the last close price at the time of writing unless otherwise noted. Market Matters does not make any representation of warranty as to the accuracy of the figures or prices and disclaims any liability resulting from any inaccuracy.
Reports and other documents published on this website and email (‘Reports’) are authored by Market Matters and the reports represent the views of Market Matters. The Market Matters Report is based on technical analysis of companies, commodities and the market in general. Technical analysis focuses on interpreting charts and other data to determine what the market sentiment about a particular financial product is or will be. Unlike fundamental analysis, it does not involve a detailed review of the company’s financial position.
The Reports contain general, as opposed to personal, advice. That means they are prepared for multiple distributions without consideration of your investment objectives, financial situation and needs (‘Personal Circumstances’). Accordingly, any advice given is not a recommendation that a particular course of action is suitable for you and the advice is therefore not to be acted on as investment advice. You must assess whether or not any advice is appropriate for your Personal Circumstances before making any investment decisions. You can either make this assessment yourself, or if you require a personal recommendation, you can seek the assistance of a financial advisor. Market Matters or its author(s) accepts no responsibility for any losses or damages resulting from decisions made from or because of information within this publication. Investing and trading in financial products are always risky, so you should do your own research before buying or selling a financial product.
The Reports are published by Market Matters in good faith based on the facts known to it at the time of their preparation and do not purport to contain all relevant information with respect to the financial products to which they relate. Although the Reports are based on information obtained from sources believed to be reliable, Market Matters does not make any representation or warranty that they are accurate, complete or up to date and Market Matters accepts no obligation to correct or update the information or opinions in the Reports. Market Matters may publish content sourced from external content providers.
If you rely on a Report, you do so at your own risk. Past performance is not an indication of future performance. Any projections are estimates only and may not be realised in the future. Except to the extent that liability under any law cannot be excluded, Market Matters disclaims liability for all loss or damage arising as a result of any opinion, advice, recommendation, representation or information expressly or impliedly published in or in relation to this report notwithstanding any error or omission including negligence.