Goodbye August, it’s been a fascinating month (BHP, ORE, HVN, and VOC)
A solid rally by the ASX200 yesterday enabled the local market to close down only 6-points / 0.1% for the month, making it 6 out of the 9 occasions since the GFC that we have finished in the red for August. However, the weakness in August is magnified as a statistic when we consider that equities have been in a strong bull market since 2009, gaining 83% plus dividends – the average return over the last 9 Augusts is now -0.87%, clearly not a particularly exciting time of year for Australian equities, even in strong bull markets.
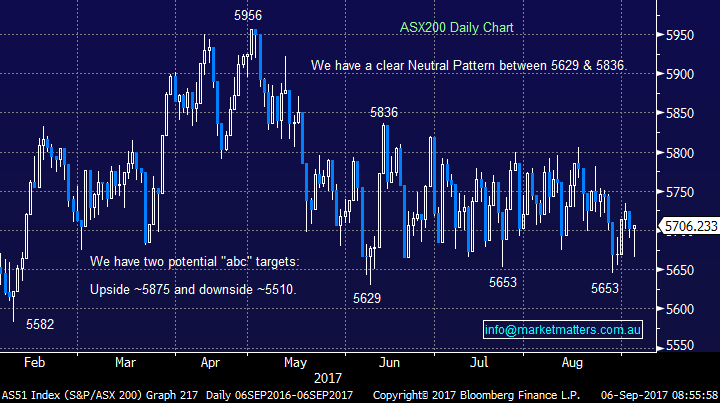
Now let’s consider this month as we welcome the first day of spring. Since the GFC the ASX200 has finished down an average of -0.44% for the month of September, but the standout numbers are the variance in performance i.e. twice the market has closed up +4%, or more and twice its closed down over -5.5%. Perhaps this month we will see the overdue breakout in the index while the wild swings between stocks will abate now reporting season is behind us.
ASX200 Monthly Chart
US Stocks
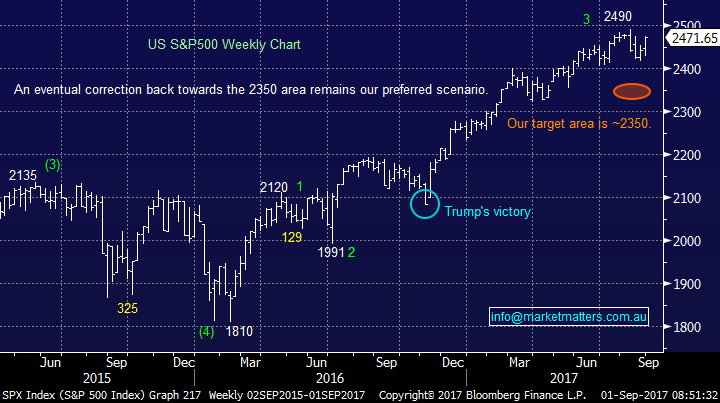
US equities continued with their recent strength overnight, gaining almost 0.6% with all 10 sectors of the S&P500 in positive territory. The US market feels like it wants to retest the 2500 area before it contemplates a pull back to our targeted 2350 area.
We remain mildly bearish US stocks targeting a correction of ~5% over the coming weeks / month as sell signals slowly emerge.
US S&P500 Weekly Chart
European Indices
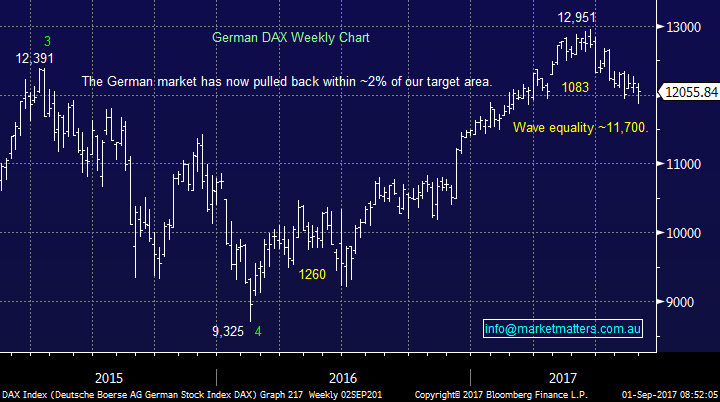
European stocks again bounced ~0.5%, following US stocks higher overnight, but they remain ~7% below their 2017 highs.
We continue to see a little further downside for European stocks but they are rapidly approaching the area where we will switch from bearish to neutral / bullish.
German DAX Weekly Chart
Seasonality of our banks
As we’ve discussed earlier in the report, August and September are on average poor months for the ASX200, but with the occasional strong performance thrown in for good measure in September. This is useful information but not as compelling as the strong statistics telling us to lighten equity holdings in late April / early May or those telling us to be very long stocks from mid-December.
However, the data around our banks is far more informative:
1. The banks have rallied well over 4% over the last 7-years from the 3rd week of September until the end of October i.e. investors get long before the big dividends.
2. This implies that if the ASX200 falls into this period it’s time to expect a bounce at least.
3. The ASX200 has experienced volatile Novembers over the last 7-years and usually suffers a decent correction during the month.
ASX200 Seasonality Chart
ASX200 Banking Index Seasonality Chart
Following on from yesterday’s thoughts around switching from resources to banks, this banking seasonality is very useful. A few more weeks of resources outperforming banks and we are likely to push the “switch” button as banks will be entering their seasonal “purple” patch.
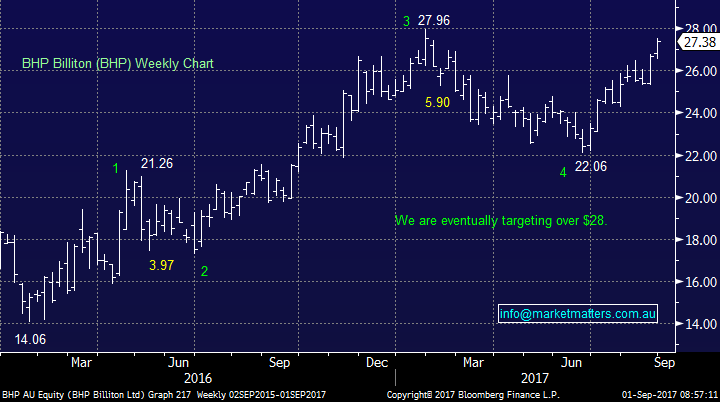
Yesterday we took profit on a small part of BHP position close to $27.50 as the stock traded within 2% of our minimum target which has been in place since mid-2017. The action was simple money management in practice, after the last few months of gains in the resources sector we were happy to lighten our exposure to 17.5% of the MM Portfolio i.e. 5% BHP Billiton (BHP), 5% Alumina (AWC) and 7.5% Newcrest Mining (NCM).
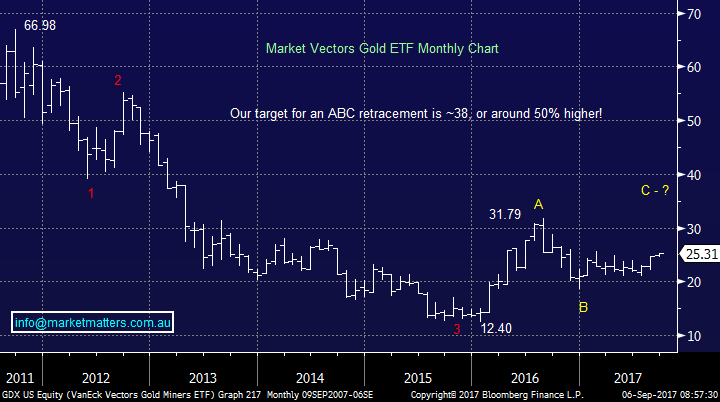
As we have stated a number of times we will have no hesitation liquidating these positions into our targeted areas. Interestingly / happily last night gold stocks rallied another 2.3% to challenge their April highs.
BHP Billiton (BHP) Weekly Chart
Three more stocks again caught our eye yesterday as the volatility remained strong amongst many individual names, we have touched on them below and importantly included our respective views.
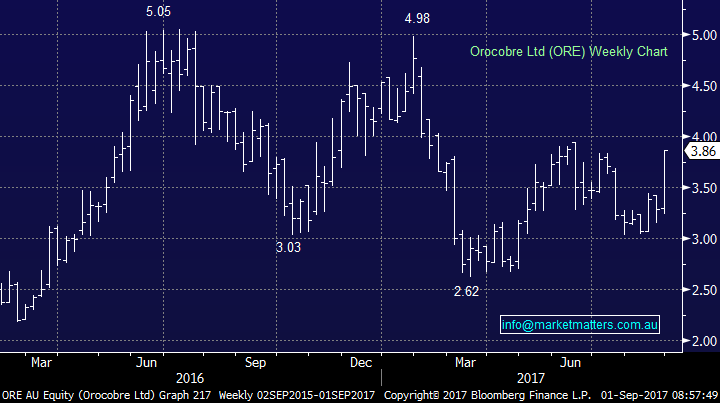
1 Orocobre (ORE) $3.86
We’ve been bullish ORE over recent weeks but unfortunately in hindsight clearly too fussy on entry as the stock surged over 14% yesterday following an excellent profit result. The lithium producer delivered a net profit of $19.4m and importantly guided for higher production this financial year.
Technically we remain bullish ORE targeting ~$5, its now about a good risk / reward entry level.
Orocobre (ORE) Weekly Chart
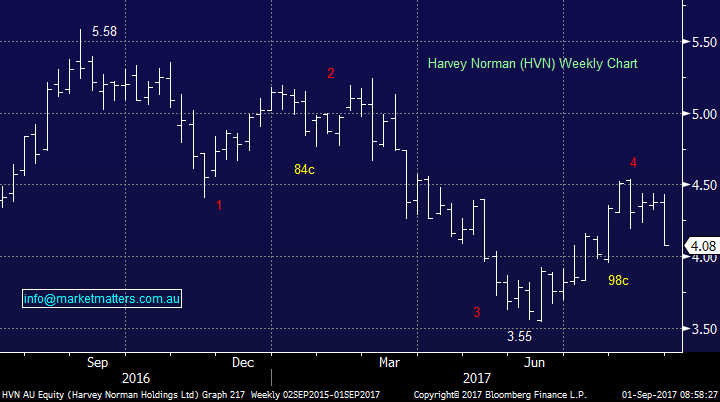
2 Harvey Norman (HVN) $4.08
HVN was whacked over 7% yesterday after disappointing investors with its earnings as discussed in the afternoon report yesterday. This reaction suggests that HVN may be in the sin bin for some time however for now, we’ll continue to hold in the Income Portfolio.
The technical view is now neutral here however the BUY level sits under $3.50 if weakness continues.
Harvey Norman (HVN) Weekly Chart
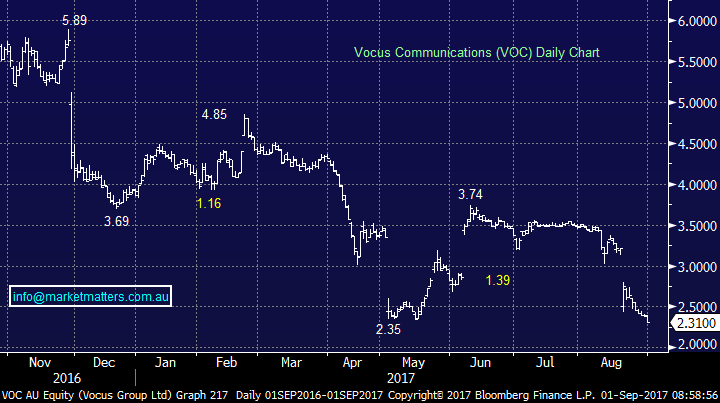
3 Vocus Communications (VOC) $2.31
VOC has been many investors’ nemesis over the last ~12-months – including our own - but it has now made the fresh multi-year lows that we flagged as likely in recent reports.
We think VOC is a very aggressive technical buy ~$2.20.
Vocus Communications (VOC) Daily Chart
Conclusion (s)
September is likely to be a volatile month for the ASX00 with seasonally a strong potential buying opportunity in the banks ~3-weeks in, we may actually consider switching some resource stock exposure at this point.
On the stock front, we like ORE but entry is hard just here, we like HVN under $3.50 and VOC as an aggressive trade ~$2.20.
Overnight Market Matters Wrap
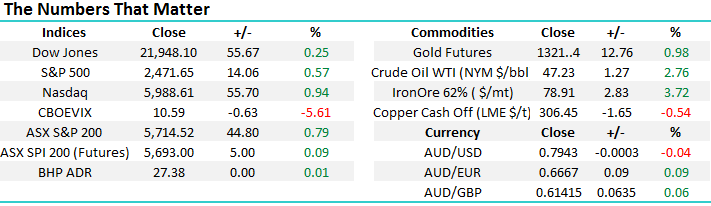
· On Wall St all 3 indices recorded gains with the tech heavy Nasdaq leading the way as it climbed 0.9% back to set a another record high of 6428.
· Better than expected growth numbers from both the US and China yesterday helped boost commodity prices across the board with base metals, iron ore and oil all stronger boosted in particular yesterday by healthy China Manufacturing data (PMI of 51.7).
· The September SPI Futures is indicating little change on the opening of the ASX 200 this morning around the 5715 level.
Disclosure
Market Matters may hold stocks mentioned in this report. Subscribers can view a full list of holdings on the website by clicking here. Positions are updated each Friday.
Disclaimer
All figures contained from sources believed to be accurate. Market Matters does not make any representation of warranty as to the accuracy of the figures and disclaims any liability resulting from any inaccuracy. Prices as at 01/09/2017. 8.00AM.
Reports and other documents published on this website and email (‘Reports’) are authored by Market Matters and the reports represent the views of Market Matters. The MarketMatters Report is based on technical analysis of companies, commodities and the market in general. Technical analysis focuses on interpreting charts and other data to determine what the market sentiment about a particular financial product is, or will be. Unlike fundamental analysis, it does not involve a detailed review of the company’s financial position.
The Reports contain general, as opposed to personal, advice. That means they are prepared for multiple distributions without consideration of your investment objectives, financial situation and needs (‘Personal Circumstances’). Accordingly, any advice given is not a recommendation that a particular course of action is suitable for you and the advice is therefore not to be acted on as investment advice. You must assess whether or not any advice is appropriate for your Personal Circumstances before making any investment decisions. You can either make this assessment yourself, or if you require a personal recommendation, you can seek the assistance of a financial advisor. Market Matters or its author(s) accepts no responsibility for any losses or damages resulting from decisions made from or because of information within this publication. Investing and trading in financial products are always risky, so you should do your own research before buying or selling a financial product.
The Reports are published by Market Matters in good faith based on the facts known to it at the time of their preparation and do not purport to contain all relevant information with respect to the financial products to which they relate. Although the Reports are based on information obtained from sources believed to be reliable, Market Matters does not make any representation or warranty that they are accurate, complete or up to date and Market Matters accepts no obligation to correct or update the information or opinions in the Reports.
If you rely on a Report, you do so at your own risk. Any projections are estimates only and may not be realised in the future. Except to the extent that liability under any law cannot be excluded, Market Matters disclaims liability for all loss or damage arising as a result of any opinion, advice, recommendation, representation or information expressly or impliedly published in or in relation to this report notwithstanding any error or omission including negligence.
To unsubscribe. Click Here


