Gold stocks are “wobbling”, MM updates where we plan to start accumulating (NCM, NST, RRL, EVN, SAR)

The ASX200 enjoyed a strong start to the week, and month, courtesy of a positive close on Wall Street following encouraging economic data out of China both over the weekend and in the morning. The stars are aligning for stocks at the moment with the added tailwind of positive noises from the US – China trade talks & almost synchronized dovish central banks, at this stage only BREXIT and increasing risks of a recession both locally and overseas appear to be weighing on stocks but the “glass is clearly half full” and fighting this sentiment has proven a futile game.
On the sector level investors appeared to move up the risk curve following the positive news from China with selling evident in the “yield play” focused REIT’s, Telco’s and Utilities while the Resources enjoyed another strong session. Interestingly the high flying Software & Services sector came off the boil slightly with over half of the names closing down on the day. Although the ASX200 rallied +0.6% yesterday, it was fairly lacklustre performance compared most of Asia e.g. China +2.6%, Hong Kong +1.8% and Japan +1.4%.
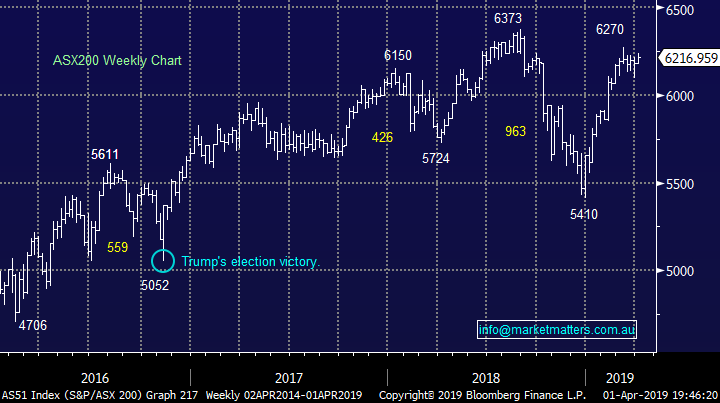
We continue to target a 6000 – 6300 less sanguine trading range for this quarter with upper band appearing the most likely to be visited first.
The ASX200 achieved our initial downside target switching back to a neutral stance short-term.
Overnight US markets followed through on their strong showing during our day time session with the Dow rallying over 300-points, the SPI futures are pointing to an open around 6250 for the local market, up around +0.5%.
Today we are going to look at 5 gold stocks as we continue to refine our targeted “buy areas” of this much loved sector.
ASX200 Chart
The correlation which MM will be watching the closest as we move into Q2 of 2019 is between “Junk Bonds” and the S&P500 which we believe is a great indicator of liquidity. Over time markets simply move on supply and demand with liquidity a measure of the supply which drives stocks higher. When this liquidity / money dries up so must the buying usually leading to market corrections.
We are watching for periods where the high yield / “Junk Bond” ETF fails to rally higher with equities, last night was the first instance in a while but one day does not make a summer!
US “Junk Bond” ETF v S&P500 Chart

The below chart caught our eye yesterday, it shows the MSCI AC Asia Index which includes large and mid-caps across both Developed Market countries and Emerging Market countries in Asia, excluding Japan. It includes over 1,250 stocks, the index basically covers approximately 85% of the market capitalization in each country. The largest members are no surprise – Tencent, Alibaba and Samsung.
What’s interesting is the long-term technical picture is pretty average and from a purely chart based process we would not be buyers, although that’s just one piece of the puzzle for successful investing i.e. the markets currently correcting the strong sell-off from early 2018.
MSCI Asia ex-Japan Index (MXASJ in $US) Monthly Chart

Updating MM’s outlook for the gold space.
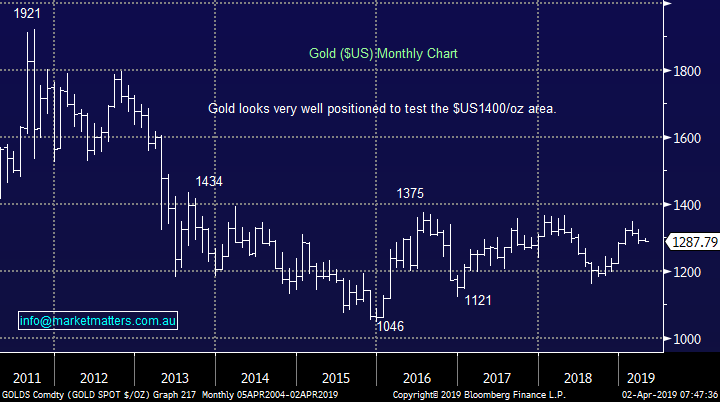
Gold has remained in a relatively tight trading range for over 5-years, our preferred scenario remains a rally above $US1400/oz but there’s nothing impulsive about the moves at present.
The precious metal complex is enjoying lower rates and a stable $US but lacks inflation / major market worries to ignite any meaningful advance.
MM is bullish gold medium-term targeting a break over $US1400/oz.
Gold $US/oz Chart
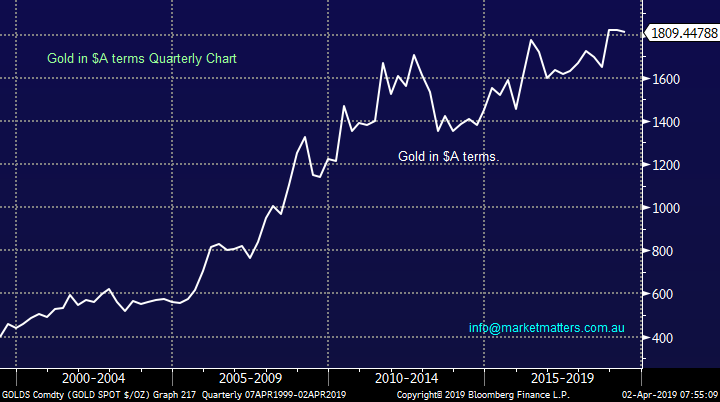
However we are mindful of our bullish $A call for the years ahead which will remove the tailwind of a depreciating currency for the Australian gold sector.
The below chart illustrates golds appreciation in $A terms over the last two decades, if we are correct the hedging desks at our gold miners will need to be on their game after some easy years.
Gold $A/oz Chart
Now quickly moving on to 5 major Australian gold miners and importantly identifying our current ideal updated buy zones.
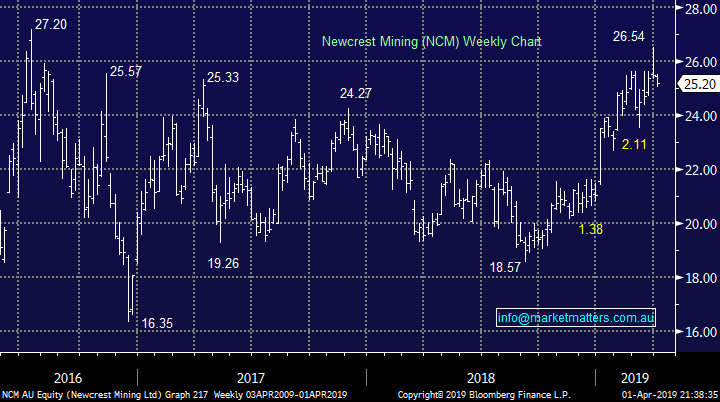
1 Newcrest Mining (NCM) $25.20.
In the bigger picture both fundamentally and technically NCM looks good which is reflected by the stocks solid performance over the last year.
MM ideally likes NCM around the $23 area.
Newcrest Mining (NCM) Chart
2 Northern Star Resources (NST) $8.74.
NST has been on a relatively choppy ride of late with Februarys pop higher courtesy of both better exploration and profit results early that month. However we feel the almost vertical appreciation in the stock since late 2016 is slowly running out of steam.
MM still has an ideal buying zone for NST closer to $7.
Northern Star Resources (NST) Chart

3 Regis Resources (RRL) $5.12.
RRL is another local gold miner who has ran strongly but looks likely to have reached an intermediate swing high.
MM likes RRL but around the $4 area.
Regis Resources Chart

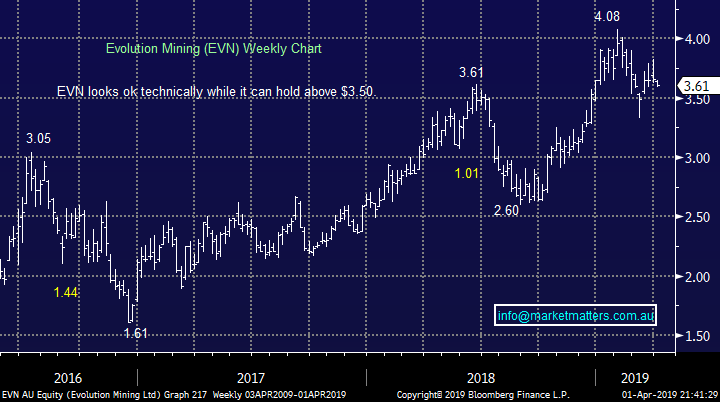
4 Evolution Mining (EVN) $3.61.
The EVN chart is almost a carbon copy of the Regis Resources (RRL) one with just slightly different prices.
At this stage MM likes EVN below $3.
Evolution Mining (EVN) Chart
5 Saracen Mining (SAR) $2.81.
SAR has already corrected over 25% from its 2019 illustrating the volatility the sector can often throw out.
At this stage our ideal buy zone for SAR is ~$2.10.
Saracen Mining (SAR) Chart

Conclusion
MM likes all 5 of the gold stocks reviewed today but we are being patient at this point in time. However we do anticipate establishing a bullish exposure to the sector this quarter.
Global Indices
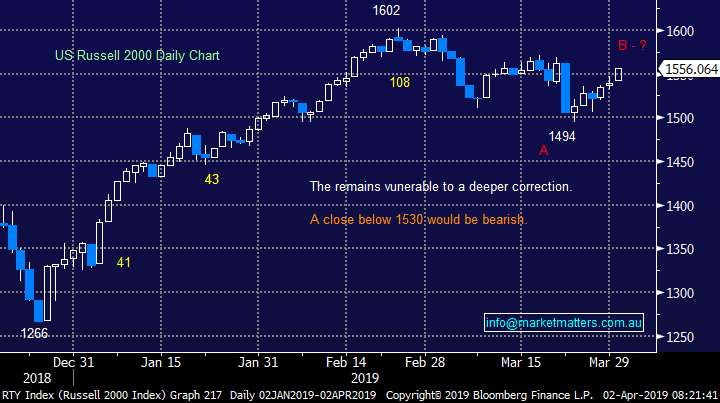
US stocks again closed higher last night with the small cap Russell 2000 reaching its major resistance area ~1560.
With both the S&P500 and tech based NASDAQ reaching fresh 2019 highs we have again turned neutral / negative US stocks.
US Russell 2000 Chart
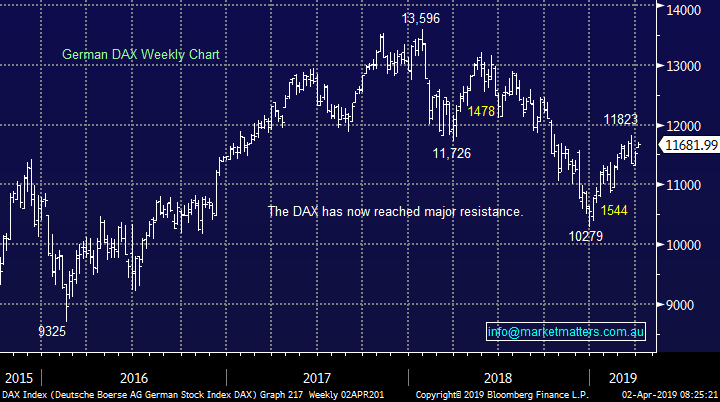
No change with European indices even as the BREXIT fiasco rolls on, markets are encountering some selling from our targeted “sell zones”, we remain cautious or even bearish the region at this stage, especially into fresh 2091 highs.
German DAX Chart
Overnight Market Matters Wrap
· The US equity majors rallied over1.1% overnight, led by material and financial stocks, after US manufacturing bounced back strongly in March and the China PMI data hit an 8 month high.
· The US PMI data jumped from a read of 54.2 in February to 55.3 in March. UK manufacturing levels also hit their highest levels in over a year, ahead of the looming Brexit deadline – this morning all of ‘plan B’s’ have been denied in parliament. The unexpectedly set of stronger growth numbers propelled Wall St to near six month highs, with the Dow rising over 300 pts back above the 26,000 level. European indices also rallied strongly despite no signs of a Brexit resolution.
· Not surprisingly, commodities jumped on the growth news with iron ore higher and crude oil settling 2.69% higher at US$61.76/bbl, helping boost global resource shares. RIO is this morning expected to test post GFC highs of over $100, while BHP looks to test the $40 level for the first time in 8 years.
· The March SPI Futures is indicating the ASX 200 to extend its recent strength this morning and open 39 points higher, testing the 6250 level.
Have a great day!
James & the Market Matters Team
Disclosure
Market Matters may hold stocks mentioned in this report. Subscribers can view a full list of holdings on the website by clicking here. Positions are updated each Friday, or after the session when positions are traded.
Disclaimer
All figures contained from sources believed to be accurate. Market Matters does not make any representation of warranty as to the accuracy of the figures and disclaims any liability resulting from any inaccuracy. Prices as at 02/04/2019
Reports and other documents published on this website and email (‘Reports’) are authored by Market Matters and the reports represent the views of Market Matters. The MarketMatters Report is based on technical analysis of companies, commodities and the market in general. Technical analysis focuses on interpreting charts and other data to determine what the market sentiment about a particular financial product is, or will be. Unlike fundamental analysis, it does not involve a detailed review of the company’s financial position.
The Reports contain general, as opposed to personal, advice. That means they are prepared for multiple distributions without consideration of your investment objectives, financial situation and needs (‘Personal Circumstances’). Accordingly, any advice given is not a recommendation that a particular course of action is suitable for you and the advice is therefore not to be acted on as investment advice. You must assess whether or not any advice is appropriate for your Personal Circumstances before making any investment decisions. You can either make this assessment yourself, or if you require a personal recommendation, you can seek the assistance of a financial advisor. Market Matters or its author(s) accepts no responsibility for any losses or damages resulting from decisions made from or because of information within this publication. Investing and trading in financial products are always risky, so you should do your own research before buying or selling a financial product.
The Reports are published by Market Matters in good faith based on the facts known to it at the time of their preparation and do not purport to contain all relevant information with respect to the financial products to which they relate. Although the Reports are based on information obtained from sources believed to be reliable, Market Matters does not make any representation or warranty that they are accurate, complete or up to date and Market Matters accepts no obligation to correct or update the information or opinions in the Reports. Market Matters may publish content sourced from external content providers.
If you rely on a Report, you do so at your own risk. Past performance is not an indication of future performance. Any projections are estimates only and may not be realised in the future. Except to the extent that liability under any law cannot be excluded, Market Matters disclaims liability for all loss or damage arising as a result of any opinion, advice, recommendation, representation or information expressly or impliedly published in or in relation to this report not withstanding any error or omission including negligence.