Evaluating 5 of the top ASX200 performers (BHP, WSA, ASB, SSM, PME, CUV, APX)
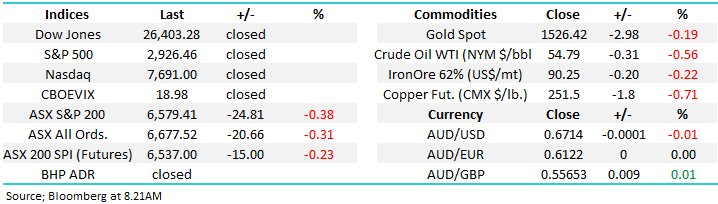
The ASX200 commenced the week on the back foot as it followed the US futures lower courtesy of implemented additional tariffs over the weekend by both the US and China. Action was fairly muted as is often the case ahead of a US holiday but we did notice a little sector rotation yesterday as banks generally traded lower while resources enjoyed a distinct tone led by nickel stocks but well supported by the iron ore titans. On the macro front we saw improved numbers out of China as the Manufacturing PMI came in ahead of expectations which helped the resources stocks on a day when Indonesia had already sent nickel stocks soaring by suggesting they would ban exports of the industrial metal by December.
NB Although US stock markets were closed last night for Labor Day the S&P500 futures continued with business as usual, at 9am AEST they are down -0.6%.
The UK has now seen consumer confidence hit a 6-year low as the BREXIT debacle continues - over 3-years since the leave vote surprised the world – if you’re interested watch the movie “The Great Hack” which focuses on how / why traditional polls got it so wrong, an intriguing documentary about Cambridge Analytica. If the UK can take over 3-years to get nowhere with BREXIT how long will the US and China take to resolve their trade differences and more worryingly for stocks what if China decides to wait until next November to see if Trump losses the election in hope of an easier / more predictable administration - more than a year of uncertainty is unlikely to help risk assets like stocks.
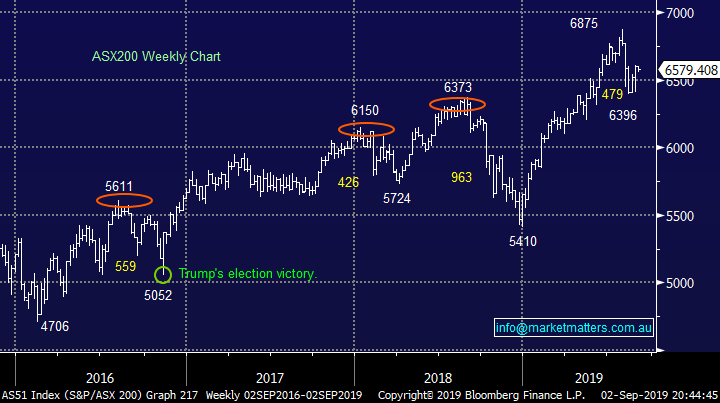
MM remains comfortable adopting a conservative stance towards equities, especially around the 6600 area.
Overnight US stocks were closed for Labor Day but US futures were volatile falling -0.6% on continued concerns around trade talks, Trump needs to get this sorted if he wants to focus on next years election. The SPI futures are pointing to the ASX200 opening down around 10-points this morning.
Today with overseas markets quiet we have looked at 5 stocks who have rallied by more than 50% over the last year for clues whether we should be boarding these runaway trains or indeed disembarking at the next opportunity.
ASX200 Chart
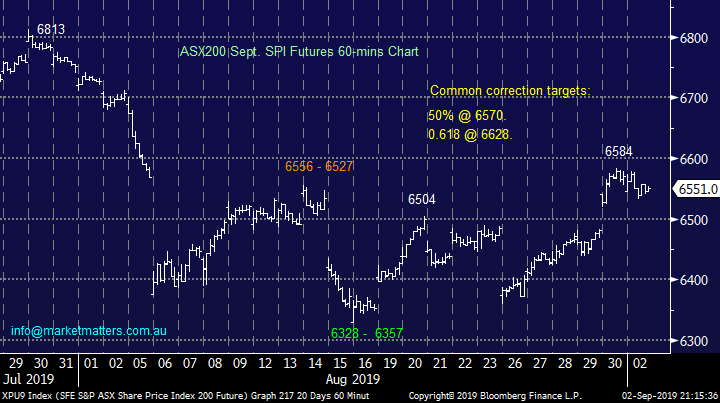
For the short-term subscribers we have a pretty clear technical picture for the SPI futures, which generally leads the ASX200:
1 – Our preferred scenario is the SPI initially rallies another ~1% towards its 6630 resistance area.
2 – Decent volume and a close below 6527 will trigger sell signals.
The important point is we are looking for an ideal opportunity to move our Growth Portfolio to a more defensive stance hence we are watching the short-term market gyrations far closer than is our usual custom.
Short-term MM can see another 1% upside for local stocks.
ASX200 SPI September Futures 60-mins Chart
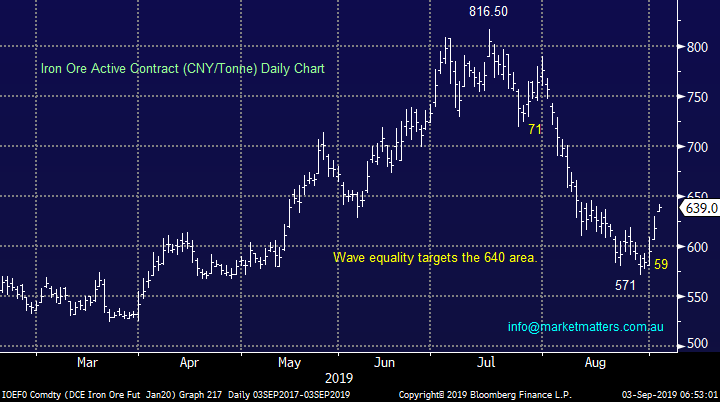
Iron ore was already bouncing before China’s Caixin Manufacturing data came in better than expected, actually managing to expand in August refuting the forecasts of most economists. However export sales fell which is no great surprise considering the escalating US – China trade war.
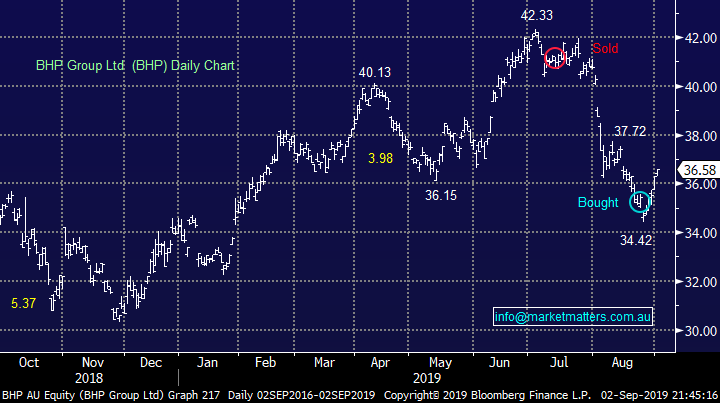
From a risk / reward perspective MM are reviewing our exposure to the bulk commodity after recent gains and Fortescue Metals (FMG) traded ex-dividend yesterday – 24c fully franked. We have now enjoyed healthy dividends from both RIO and FMG with heavyweight BHP trading ex-dividend 78c fully franked on Thursday. If BHP squeezes higher above $37 before Thursday MM will consider taking a relatively small profit on our position.
MM is targeting the 650 area for iron ore.
Iron Ore Active Contract (CNY/Tonne) Chart
BHP Group (BHP) Chart
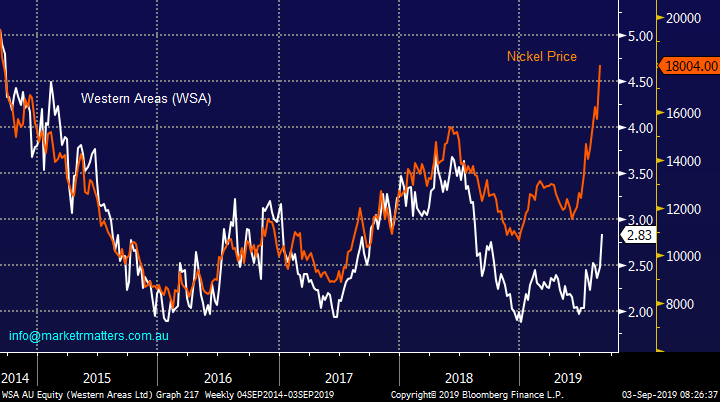
When we look at Western Areas (WSA) compared to the nickel price some catch up feels almost inevitable and more importantly the risk / reward looks ok even if nickel pulls back as it would appear investors are expecting.
Perhaps a switch for our BHP position.
MM likes WSA at current levels.
Western areas v Nickel Price Chart
Still no change in our opinion for US stocks: “MM believes we have entered a new short-term cycle for US stocks where bounces should be sold by the active trader”.
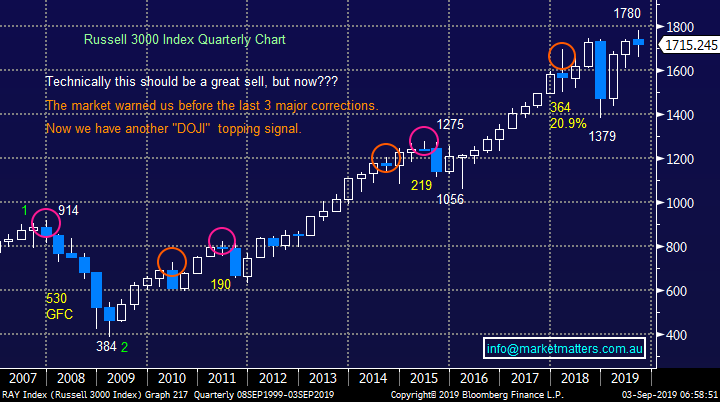
Medium-term the picture evolving in the Russell 3000 is a touch disconcerting as it points to a potential 20% pullback towards the lows of last November / December, while not a big deal when compared to the gains since the GFC most certainly unsettling to investors who watch their portfolio’s week to week. Hence as subscribers know MM are looking to adopt a more defensive stance than we did in the first half of 2019.
Our initial target for this pullback by US stocks is ~6% lower.
US Russell 3000 Index Chart
Evaluating 5 of the top ASX200 performers
Over the last year the ASX200 has seen over 12% of its members rise or fall be over 50% with winners trumping the losers 15-10 a great advert for “running your winners & cutting the losers”. This morning I have briefly looked at 5 winners deliberately picking out a few stocks we have not looked at in a while. As MM believes there is a strong possibility of a decent correction in the coming months, identifying areas to buy strong stocks / companies dovetails nicely with our general investment strategy.
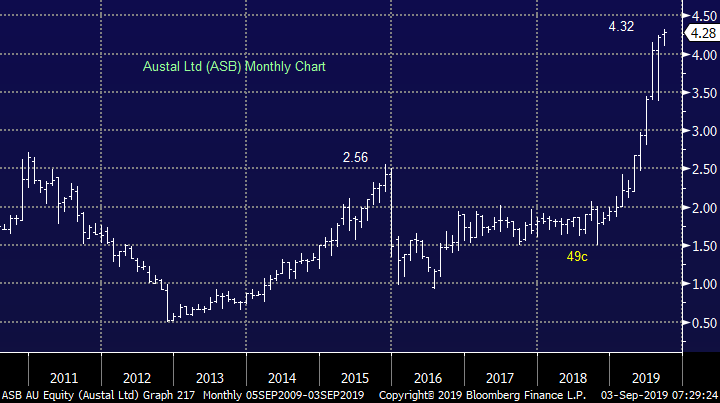
1 Austal Ltd (ASB) $4.28
Global defence contractor / ship builder ASB has enjoyed a stellar run over the last 3-years but previous corrections illustrate the stock is not immune to major market setbacks. This $1.5bn business is currently trading on an ok valuation for a growth stock with an Est P/E for 2020 of 21x, while it yields 1.4% pa unfranked.
The companies latest full year results showed a big 64% increase in profit to over $61m with guidance implying further strong growth to come.
MM likes ASB below $3.50 or over 20% lower.
Austal Ltd (ASB) Chart
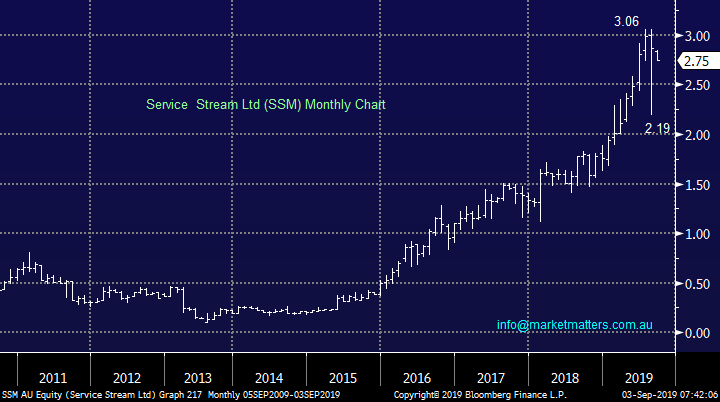
2 Service Stream Ltd (SSM) $2.75
Specialist telecommunications provider SSM has also basically been rallying unabated for the last 3-years but technically the stock now looks set for a period of consolidation, not surprising considering its performance since early 2018. The stock’s currently trading on a reasonable Est P/E for 2020 of under 17x while yielding a healthy (in today’s environment) 3.45% fully franked, hence making it a potential yield play if the stock corrects over 10%.
The company reported a strong 35% increase in revenue to $852m for the year but no real guidance was given for 2020 although the CEO remained understandably upbeat.
MM likes SSM well under $2.50, or over 10% lower.
Service Stream Ltd (SSM) Chart
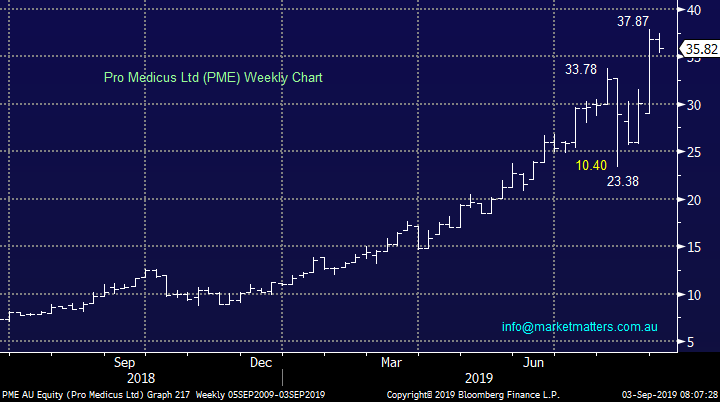
3 Pro Medicus Ltd (PME) $35.82
PME develops and supplies proprietary software and IT solutions for large medical companies and clearly its good at it! Their services are diverse ranging from billing, diagnostic imaging to appointment systems.
The company delivered excellent full year profit of $19.1m, up over 90%, in 2019.
Currently MM likes PME below $30, or over 15% lower.
Pro Medicus Ltd (PME) Chart
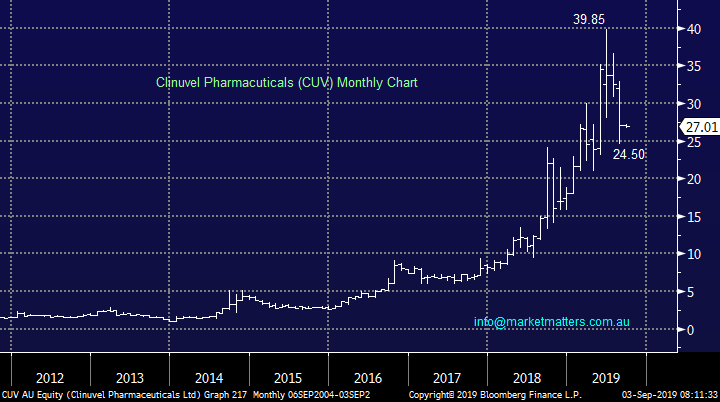
4 Clinuvel Pharmaceuticals (CUV) $27.01
CUV is a Melbourne based biopharmaceutical company which focuses on dermatology products for a range of UV-related skin disorders. This $1.3bn business has a huge valuation trading on an Est P/E of 112x for 2020 hence investors should not be surprised with the almost 40% in the last couple of months, it’s a high risk growth stock.
The stock primarily fell in June / July because of issues around a drug release although may only become a 3-month delay the stock is expensive / priced for perfection.
MM is neutral CUV.
Clinuvel Pharmaceuticals (CUV) Chart
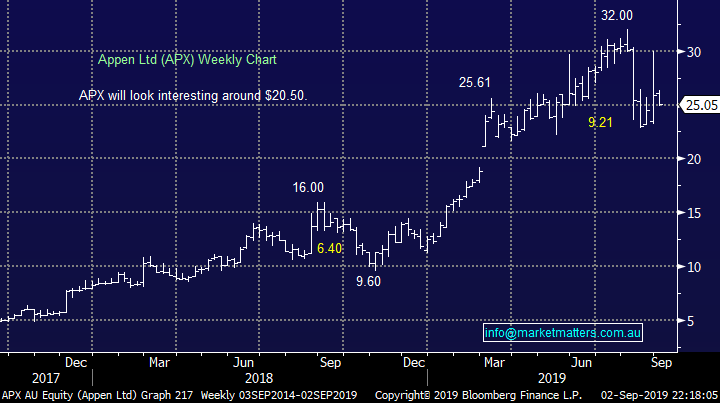
5 Appen Ltd (APX) $25.05
Lastly APX which has been on our radar for a few weeks, the stock was the 5th worst performing stock on the index yesterday making our “buy zone” feel very realistic into a market pullback.
MM likes APX below $21, or 15% lower.
Appen Ltd (APX) Chart
Conclusion (s)
MM likes 4 of the 5 stocks discussed today into weakness but the risk / reward is not compelling for any at today’s prices.
Also, MM is considering switching our BHP position into WSA should BHP trade above $37 pre-dividend.
Global Indices
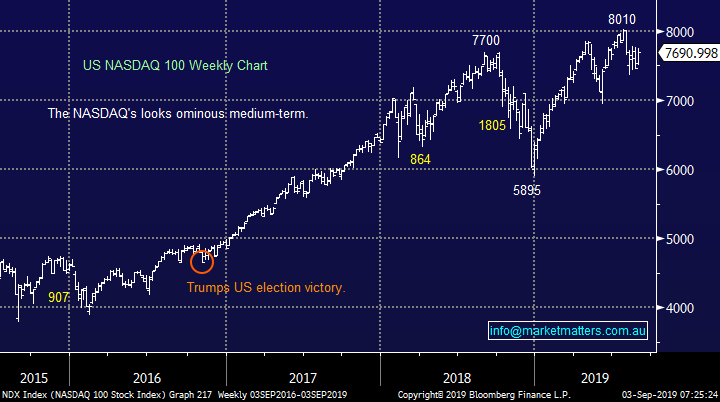
No change, we believe US stocks are now bearish as discussed over recent weeks, the tech based NASDAQ’s short-term resistance comes in around 7800, only 1% higher, while initial support is around 8% lower.
US stocks have generated technical sell signals medium-term.
US NASDAQ Index Chart
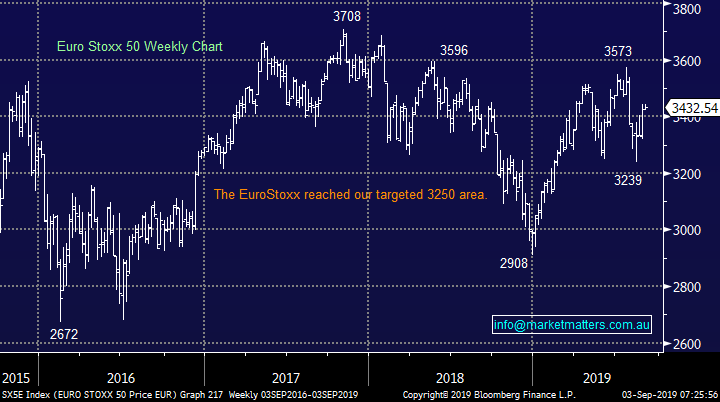
No change again with European indices, while we remain cautious European stocks as their tone has become more bearish over the last few months, however we had been targeting a correction of at least 5% for the broad European indices, this has now been achieved.
The long-term trend is up hence any “short squeezes” might be harder and longer than many anticipate.
Euro Stoxx 50 Chart
Overnight Market Matters Wrap
· The European markets started their first session of the month on a positive tone, with all major indices ending in positive territory, while the US equity markets was closed for bank holiday.
· On the commodities front, the iron ore price rallied 7% overnight, back above US$90/tonne. Nickel firmed again overnight by about 0.7% to set 5 year highs, having rallied strongly over the weekend on looming Indonesian nickel ore export bans. Gold also rallied 0.5% to around US$1530/oz., while other commodities were generally weaker, with oil in particular lower, currently at US$54.79/bbl.
· The September SPI Futures is indicating the ASX 200 to open 20 points lower, testing the 65650 level this morning, while the RBA meet this afternoon with a widely expected no change of its key interest rate at 1%.
Have a great day!
James & the Market Matters Team
Disclosure
Market Matters may hold stocks mentioned in this report. Subscribers can view a full list of holdings on the website by clicking here. Positions are updated each Friday, or after the session when positions are traded.
Disclaimer
All figures contained from sources believed to be accurate. All prices stated are based on the last close price at the time of writing unless otherwise noted. Market Matters does not make any representation of warranty as to the accuracy of the figures or prices and disclaims any liability resulting from any inaccuracy.
Reports and other documents published on this website and email (‘Reports’) are authored by Market Matters and the reports represent the views of Market Matters. The Market Matters Report is based on technical analysis of companies, commodities and the market in general. Technical analysis focuses on interpreting charts and other data to determine what the market sentiment about a particular financial product is, or will be. Unlike fundamental analysis, it does not involve a detailed review of the company’s financial position.
The Reports contain general, as opposed to personal, advice. That means they are prepared for multiple distributions without consideration of your investment objectives, financial situation and needs (‘Personal Circumstances’). Accordingly, any advice given is not a recommendation that a particular course of action is suitable for you and the advice is therefore not to be acted on as investment advice. You must assess whether or not any advice is appropriate for your Personal Circumstances before making any investment decisions. You can either make this assessment yourself, or if you require a personal recommendation, you can seek the assistance of a financial advisor. Market Matters or its author(s) accepts no responsibility for any losses or damages resulting from decisions made from or because of information within this publication. Investing and trading in financial products are always risky, so you should do your own research before buying or selling a financial product.
The Reports are published by Market Matters in good faith based on the facts known to it at the time of their preparation and do not purport to contain all relevant information with respect to the financial products to which they relate. Although the Reports are based on information obtained from sources believed to be reliable, Market Matters does not make any representation or warranty that they are accurate, complete or up to date and Market Matters accepts no obligation to correct or update the information or opinions in the Reports. Market Matters may publish content sourced from external content providers.
If you rely on a Report, you do so at your own risk. Past performance is not an indication of future performance. Any projections are estimates only and may not be realised in the future. Except to the extent that liability under any law cannot be excluded, Market Matters disclaims liability for all loss or damage arising as a result of any opinion, advice, recommendation, representation or information expressly or impliedly published in or in relation to this report notwithstanding any error or omission including negligence.


