Evaluating 3 dominant forces as the ASX200 marches to new decade highs (CSL, ANZ, CBA, BHP)
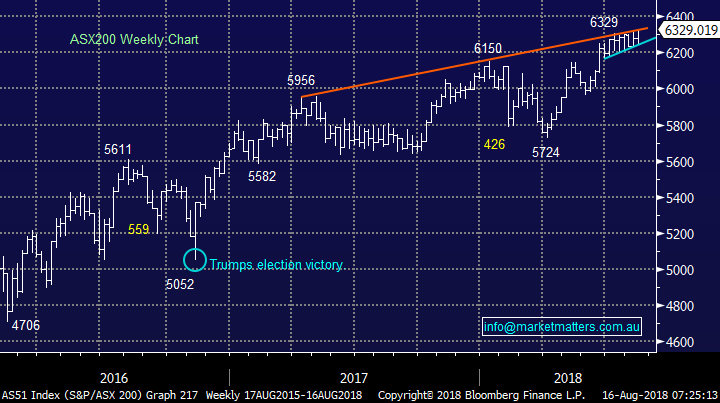
The ASX200 closed at fresh 10-year highs yesterday propelled by both the banking and healthcare sectors while the resources did their best to rein in the runaway market. Over 65% of the days 29-point gain was courtesy of CSL illustrating perfectly that the current market advance is not broad based with a few “high flying quality” stocks performing virtually all the heavy lifting.
What did catch our eye yesterday was the strength in local stocks even while Asia and the US futures were weak, plus copper was making fresh lows for 2018 just for good measure. It feels to us that parts of our market are receiving “safe haven” money as funds look for “relatively safe” places to park their cash as the overall global market uncertainty slowly but surely rises.
· We are now neutral the ASX200 while the index holds above 6250 but we remain in “sell mode” albeit in a patient manner.
Overnight stocks were weak following on from yesterday’s lead by the S&P futures but with BHP down almost 4% in the US, copper and oil both falling well over 3% and the local SPI futures calling an initial drop of over 50-points things look set for a tough day on the local bourse.
Today’s report is going to look at 3 highly influential but uncorrelated sectors of the ASX200:
- The high flyers continually making all-time highs e.g. CSL Ltd (CSL) and Computershare (CPU).
- The banking stocks e.g. Commonwealth Bank (CBA) et al.
- The resources sector e.g. BHP Billiton and OZ Minerals (OZL).
ASX200 Chart
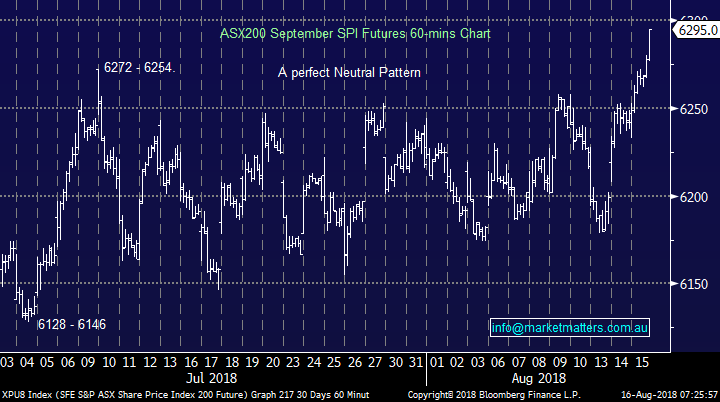
As we’ve discussed a few times recently the best vehicle to identify a “sell signal” in the Australian market at this time of year is the September futures (SPI).
The September futures actually closed up 49-points yesterday which equates to the ASX200’s 29-point gain plus primarily the points from CBA and Suncorp trading ex-dividend. i.e. The SPI’s price considers the looming company dividends.
Overnight the SPI futures closed at 6241, we get a technical sell signal generated by a close below 6250, i.e. strong likelihood today!
· MM will get a technical “sell signal” for local stocks if the SPI trades back below 6250.
ASX200 September SPI Futures Chart
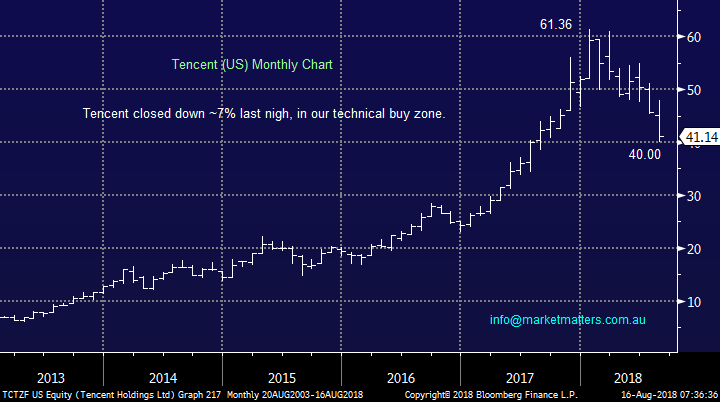
Last night Tencent tumbled another 7% as it announced its first profit drop in over a decade, providing one important lesson for subscribers:
· The market is not a perfect vehicle, the 35% decline from its 2018 high is probably because “people do often get a sniff of pending news” illustrating that Technical Analysis has an important part to play in the investors armoury.
This savage decline also illustrates the risks to high growth / valuation stocks at this stage of the stock market / economic cycles – especially when they are so euphorically endorsed by retail investors.
· MM likes Tencent in this current region as a slow accumulate and evaluate i.e. buy the pain.
Tencent (in the US) Chart
1 The “high Flyers”
Moving on from Tencent to the “high flyers” in the local market, an area we have touched on previously as we become increasingly concerned with high valuation / growth stocks.
Firstly, CSL which made an all-time high yesterday definitely exceeding our expectations in the process while adding almost 19-points to the ASX200 in just the one day. However as we have already witnessed in 2016 and 2017 the stock is very capable of a 15-20% correction. We feel this quality stock is basically fully valued after yesterday’s surge with a P/E of Est. 2019 earnings of 35.8x but it’s a quality stock that continues to perform hence investors’ appetite, creating a potentially dangerous degree of comfort.
· MM likes CSL but we will awaiting a 10% correction to start accumulating at this point in time.
Other “high flyers” to make new all-time highs yesterday were:
· AfterPay (APT), Computershare (CPU), ResMed (RMD) and Wesfarmers (WES) while Xero (XRO) & REA Group (REA) closed within striking distance of their equivalent milestones.
We feel this “go to “ list of stocks is being continually bought by investors who have become disenchanted with previously popular sectors obviously like the banks for example. Historically this will end badly and while at this stage we are not calling a huge decline our view is that the next 10% for this group is far more likely down than up.
A number of the above stocks have either achieved our technical targets, or are within striking distance, hence we also see the risk / reward from a technical basis agreeing with our caution towards these high flyers from a cycle perspective.
· Technically most of the high growth / valuation stocks feel ready for a 10% correction although no signals have yet been generated – remember nobody was calling Tencent down 35% in January!
CSL Ltd (CSL) Chart
2 The Banking Sector
The banks remain strong and even while CBA traded ex-dividend yesterday the sector was up +0.8% yesterday, almost double the ASX200.
No change to our view that the banks represent good value at current levels and especially if they were to correct ~5% courtesy of a falling market.
· MM believes the “big four” Australian banks will continue their recent outperformance into 2019.
Simply the negative news flow from the Hayne Royal Commission appears to be trailing off (we hope!) and the elastic band which had been stretched too far towards the negative corner is pulling back.
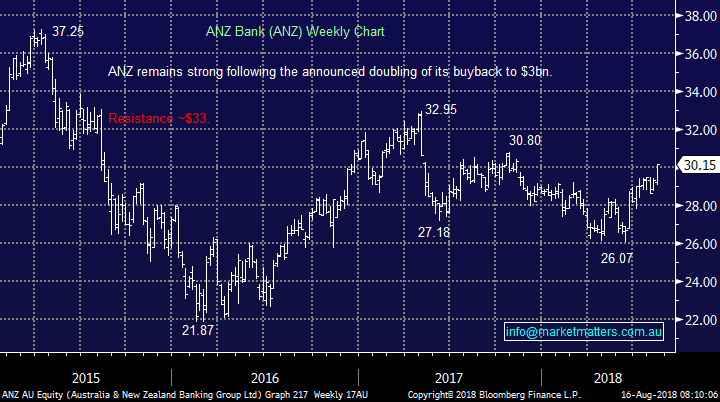
For example even after its recent 15% rally ANZ is yielding an attractive 5.3% fully franked, we like ANZ into weakness but would not be chasing just here.
ANZ Bank (ANZ) Chart
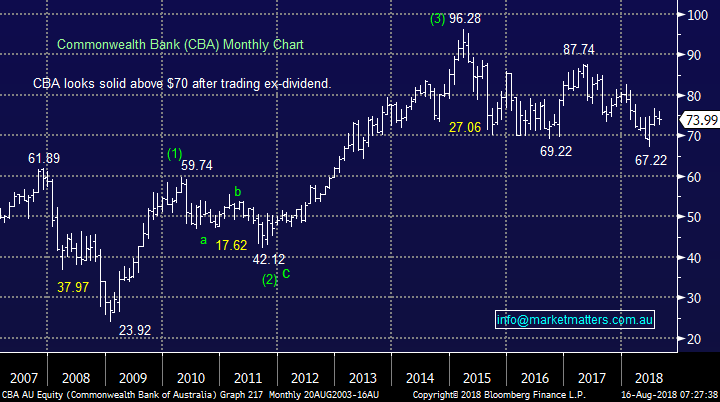
CBA traded ex-dividend $2.31 fully franked yesterday but the stock only fell $1.87 i.e. an excellent performance.
· MM likes CBA, especially into any weakness which takes its yield back over 6%; currently 5.83%.
Commonwealth Bank (CBA) Chart
3 The Resources Sector
Much of the Australian Resources sector has slipped into, or are close to, a bear market while most of the bullish pundits and analysts have been very quiet – we got this one very right!
Before are some examples of the sectors recent weakness before this morning’s looming ugly opening.
· OZ Minerals (OZL) -16%, Western Areas (WSA) -24%, Independence Group (IGO) -28%, South32 (S32) -16% and even heavyweight RIO Tinto (RIO) – 15%.
The obvious question is when / if do we put our hand up and buy the resources sector, we have 5 reasons to remain patient at this point in time:
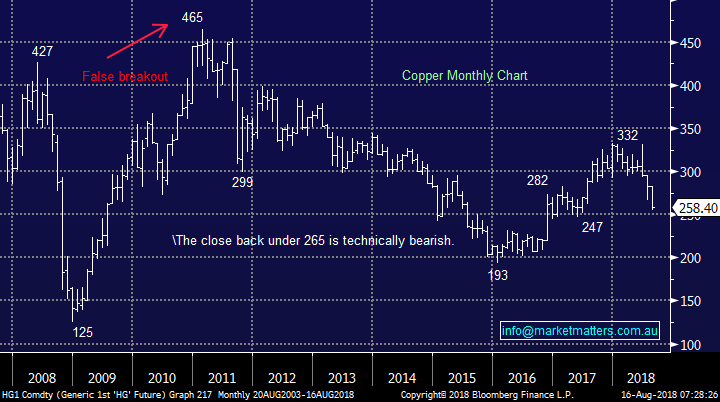
1. Economic bell weather ”Dr Copper” has broken down technically and we see at least another 5% downside.
2. We feel the “short-term money” remains very long this sector so the risks of a further sharp sell-off are high.
3. The Australian dollar remains bearish technically targeting well under 70c.
4. Our Target for market heavyweight BHP remains under $30, over 5% below where its due to open this morning.
5. We want to see / hear about the sectors pain in the Australian Financial Review (AFR) – it won’t be quiet forever.
While obviously we may tweak this opinion moving forward there feels no hurry to jump on the resources band wagon just yet as we believe a number are still trying to get off!
Copper Chart
As most subscribers know we sold our BHP around $34 a while ago and so far “the big Australian” has not made us feel like it was an error.
The stock reports next week with expectations high, often a risky scenario but not always as we saw with CSL Ltd yesterday.
· MM remains keen to re-buy back into BHP below $30 but we will not be paying up at this stage.
BHP Billiton (BHP) Chart

Conclusion
- MM is very wary high growth / valuation stocks at this stage of the stock market / economic cycle.
- MM believes the banking sector will outperform into 2019.
- MM is remaining patient on accumulating the current weakness in the resources sector.
Overseas Indices
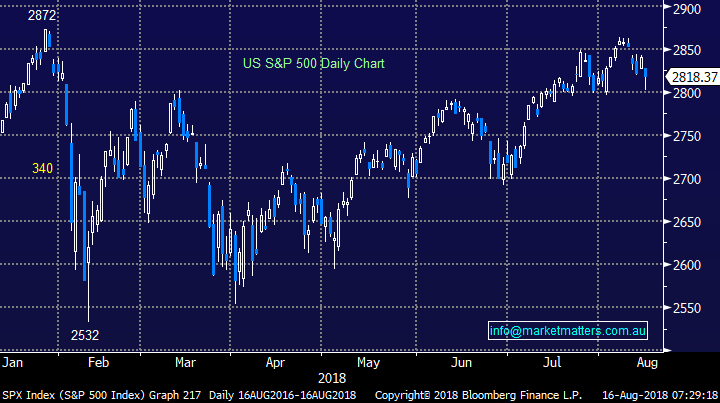
The US S&P500 is threatening to breakdown but this morning’s recovery from the important 2800 area still has us neutral short-term.
However we remain bearish the UK FTSE targeting 6-7% downside following last night’s aggressive -1.5% decline.
US S&P500 Chart
UK FTSE Chart
Overnight Market Matters Wrap
- A commodity rout and further weakness in global markets overnight, driven by continued trade fears and Turkey’s growing financial crisis, will weigh on the local market with the futures pointing to a 1% selloff this morning.
- Resource stocks in particular will be under pressure as the copper price hit a 1 year low, tumbling ~4%, driven by increasing concerns that escalating tariffs will impact growth. All key commodities suffered heavy selloffs, with zinc hardest hit, -7%, as investors became more defensive. Gold hit an 18 month low of US$1177/oz. US bonds rallied to 2.85%.
- It was a sea of red on markets with the Euro zone indexes falling about 1.5% and the Nasdaq hardest hit on Wall St, with a tech selloff leading the index 1.3% lower. The Dow lost 0.6% and the S&P 500 -0.7%. Chinese tech giant Tencent‘s US listed shares fell nearly 7% after reporting weaker than expected earnings, sparking the broader tech selloff.
Have a great day!
James & the Market Matters Team
Disclosure
Market Matters may hold stocks mentioned in this report. Subscribers can view a full list of holdings on the website by clicking here. Positions are updated each Friday, or after the session when positions are traded.
Disclaimer
All figures contained from sources believed to be accurate. Market Matters does not make any representation of warranty as to the accuracy of the figures and disclaims any liability resulting from any inaccuracy. Prices as at 16/08/2018
Reports and other documents published on this website and email (‘Reports’) are authored by Market Matters and the reports represent the views of Market Matters. The MarketMatters Report is based on technical analysis of companies, commodities and the market in general. Technical analysis focuses on interpreting charts and other data to determine what the market sentiment about a particular financial product is, or will be. Unlike fundamental analysis, it does not involve a detailed review of the company’s financial position.
The Reports contain general, as opposed to personal, advice. That means they are prepared for multiple distributions without consideration of your investment objectives, financial situation and needs (‘Personal Circumstances’). Accordingly, any advice given is not a recommendation that a particular course of action is suitable for you and the advice is therefore not to be acted on as investment advice. You must assess whether or not any advice is appropriate for your Personal Circumstances before making any investment decisions. You can either make this assessment yourself, or if you require a personal recommendation, you can seek the assistance of a financial advisor. Market Matters or its author(s) accepts no responsibility for any losses or damages resulting from decisions made from or because of information within this publication. Investing and trading in financial products are always risky, so you should do your own research before buying or selling a financial product.
The Reports are published by Market Matters in good faith based on the facts known to it at the time of their preparation and do not purport to contain all relevant information with respect to the financial products to which they relate. Although the Reports are based on information obtained from sources believed to be reliable, Market Matters does not make any representation or warranty that they are accurate, complete or up to date and Market Matters accepts no obligation to correct or update the information or opinions in the Reports. Market Matters may publish content sourced from external content providers.
If you rely on a Report, you do so at your own risk. Past performance is not an indication of future performance. Any projections are estimates only and may not be realised in the future. Except to the extent that liability under any law cannot be excluded, Market Matters disclaims liability for all loss or damage arising as a result of any opinion, advice, recommendation, representation or information expressly or impliedly published in or in relation to this report notwithstanding any error or omission including negligence.
To unsubscribe. Click Here

