Energy Stocks drag the ASX200 within a whisker of a new 10-year high, buy / sell time? (BHP, STO, ORG, WPL, OSH)
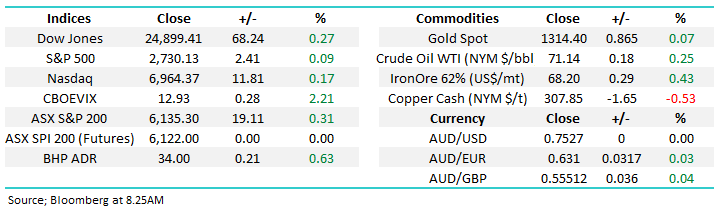
The ASX200 rallied another +0.3% yesterday, an excellent effort considering that both ANZ Bank (ANZ) and Macquarie Group (MQG) traded ex-dividend, taking ~11-points off the index. Similarly NAB trades ex-dividend today (99c fully franked) and Westpac (WBC) on Thursday (94c fully franked) putting some slight pressure on the index over the week.
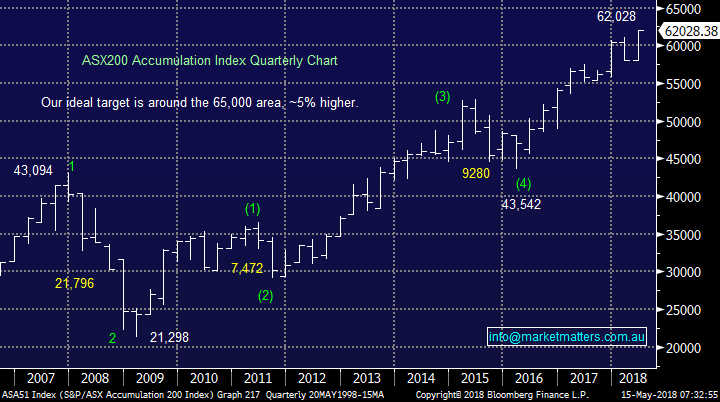
However, the ASX200 Accumulation Index again closed at fresh all-time highs and now sits only 5% below our target for an important top. We continue to believe it’s the stage of the 9-year bull market cycle to be identifying selling strategies / levels.
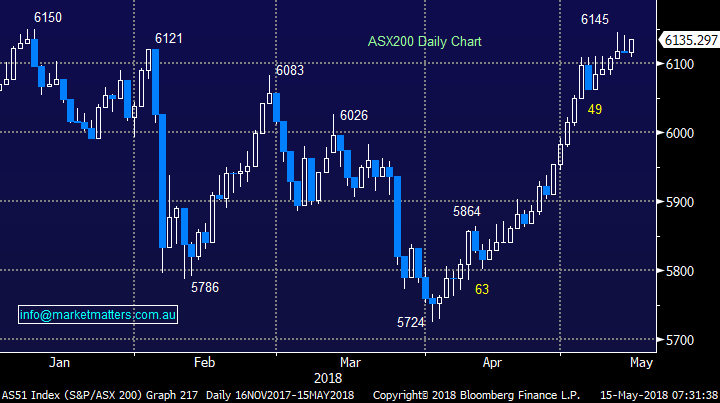
- Market Matters remains bullish the ASX200, initially targeting the 6250 area, or ~2% higher.
Overnight was fairly quiet on overseas markets with crude oil remaining supported by increasing tensions within the Middle East – crude has rallied 19% to-date in 2018.
Today’s report is going to focus on the Energy Sectorwhich along with the banks has dominated the questions we’ve received over recent weeks, not surprising when you consider that over the last 12-months the ASX200 is up 5% compared to this “blazing sector” which has rallied over 23% - everyone likes a popular stock / sector!
ASX200 Chart
ASX200 Accumulation Index Chart
The Australian Energy Sector
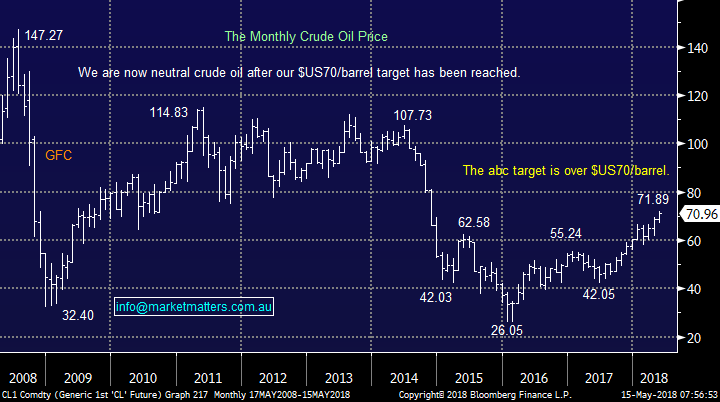
At MM we’ve been bullish crude oil for many months, targeting a break above $US70/barrel, BUT the train has now arrived in the station and we believe from a “risk/reward” perspective it’s time to be square the energy sector.
Admittedly Saudi Arabia, the leader of OPEC, wants crude oil higher so it can sell off Aramco for the highest possible price, valuations have been touted around $2 trillion - the equivalent to around six Exxon’s hence easily making it the most valuable company in the world. When we consider Saudi’s influence and the rising tensions in the Middle East it’s hard to see crude oil falling anytime soon but share prices look 6-months + into the future.
If you, like MM are a believer in the electric car, then you must question whether oil producers have a long-term large position in your portfolio i.e. over 60% of crudes usage is in transportation. We may have seen an explosion in the number of cars on the road in China but do not underestimate the governments objective to clean up their environment, this is already being illustrated by the volume of electric buses hitting their roads i.e. every 5-weeks China adds the equivalent to London’s entire iconic red bus fleet to its roads but in battery form.
Crude Oil Chart
The advance by the Australian Energy Sector has been impressive, just like the US where over the last 3-months their equivalent sector has been the clear number 1, rallying over 15%, in a market which has advanced just over 4%. Not surprisingly the sectors rally has blown away the shorts on the Australian market, they have more than halved their positions in less than 12-months.
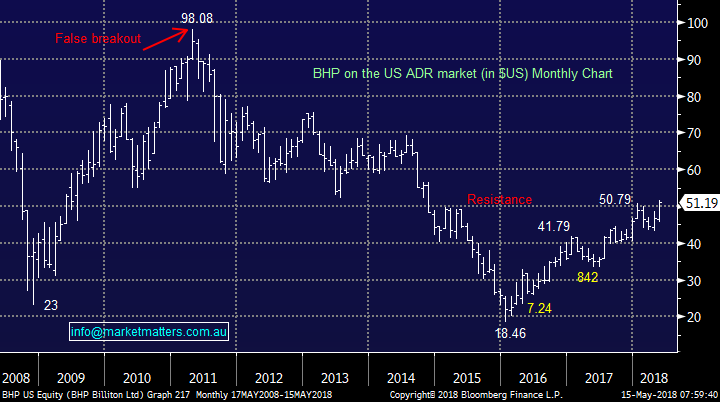
BHP Billiton (BHP) Chart $33.79
We’ve been long BHP for most of 2018, targeting a pop towards $34 (revised up from $33) assisted by our view that crude oil would break above $US70/barrel. All these pieces of the puzzle have come together and following a strong performance in the US BHP is set to open at $34 this morning.
Diversified miner BHP is obviously far from a pure energy play, but oil has a meaningful impact on its bottom line plus there has been much speculation around the sale of its US oil / gas business. We like the looming capital returns that BHP shareholders should enjoy in 2018/9 but we believe much of this is built into the recent 20% rally in the stock – we like the sidelines just here, as opposed to being outright negative.
- MM is looking to follow our plan and take a ~15% profit in BHP today around the $34 area.
BHP Billiton (BHP) on the US ADR Chart
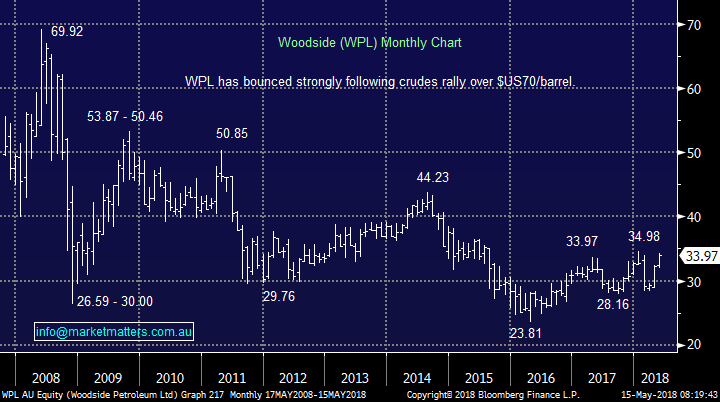
Woodside (WPL) $33.97
WPL has been a frustrating stock for MM, falling hard following a capital raising only to surge higher, outperforming the sector / market just after we took a very small profit – WPL is up 12% over the last month comparted to Origin Energy (ORG) up 9% and the ASX200 up 5.25%.
- MM is neutral WPL around the $34 area.
Woodside Petroleum (WPL) Chart
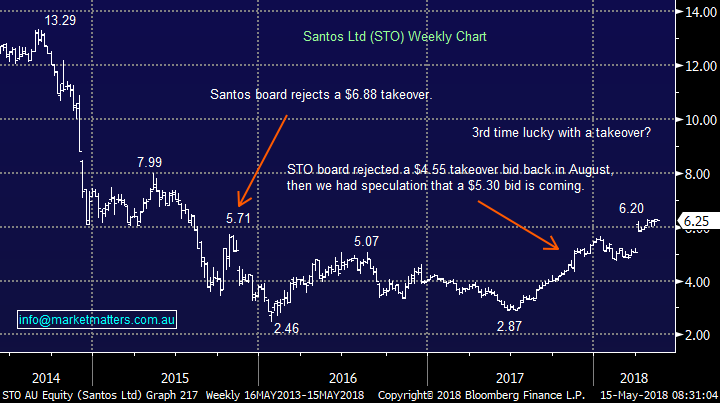
Santos (STO) $6.25
Both Healthscope (HSO) and Sirtex (SRX) have had their initial takeover bids “gazumped”, why not Santos (STO)? Santos has received a bid by Harbour Energy at $6.50, the markets clearly not too optimistic on the outcome with the stock languishing at $6.25.
Santos has a clear track record of walking away from takeover offers, arguably paying little respect to the average shareholder, perhaps this could be redemption time if they can orchestrate a higher bid. However the Foreign Investment Approval Board (FIRB) remains the large wild card in the pack and we feel this probably sits around 50-50.
- MM likes STO around $6.25 believing there is a distinct possibility of a higher bid but FIRB is a clear concern – one for the higher risk trader.
Santos (STO) Chart
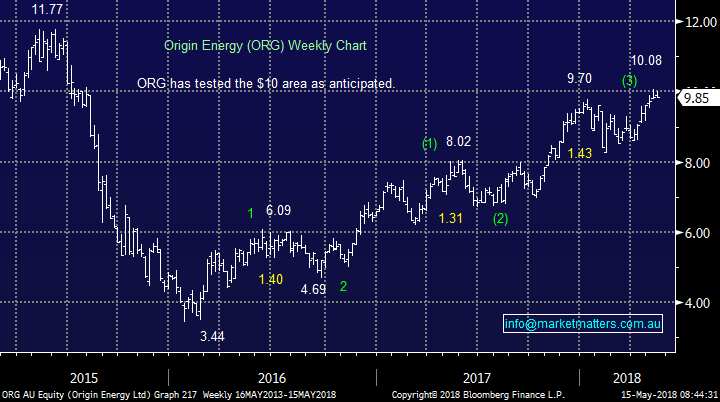
Origin Energy (ORG) $9.85
We’ve discussed ORG a number of times in our Weekend Report over recent weeks, so far being correct:
- When ORG was trading around $9 we called it a “trade” for a rally to the $10 region – tick.
- Now its reached the $10 area were looking for another pullback ~$1.40, similar to the previous 3 since its major low in early 2016 – time will tell.
If this retracement unfolds the whole sector, including BHP, is likely to experience a decent correction.
- MM is negative ORG around the current $10 area, looking for a pullback to $8.50.
Origin Energy (ORG) Chart
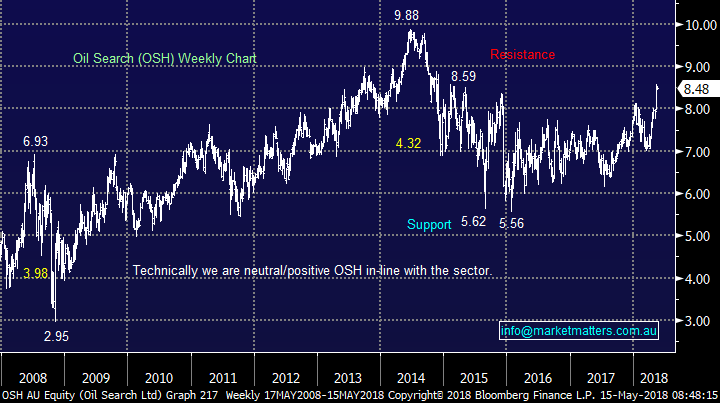
Oil Search (OSH) $8.48
OSH remains another contender in the M&A space with rumours crossing the newswires on a fairly regular basis – back in 2016 WPL made a “cheeky” and unsuccessful bid for OSH. The exit of the Papua New Guinea government from Oil Search's share register in a $210 million block trade has undoubtedly opened the door to potential M&A action, with international oil majors ExxonMobil and Total often being touted as potential suitors.
- We are neutral OSH just here but aggressive players could buy OSH with stops under $8 – less than a 6% risk.
Oil Search (OSH) Chart
Overseas Indices
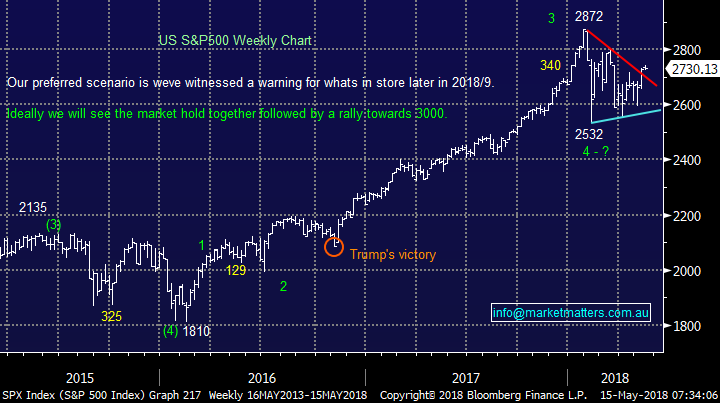
No change to our outlook for US stocks, we remain short-term bullish targeting fresh 2018 highs, around 5% for the broad based S&P500 whereas the small-cap Russell 2000, which benefits most from Trumps tax cuts, is already knocking on the door.
US S&P500 Chart
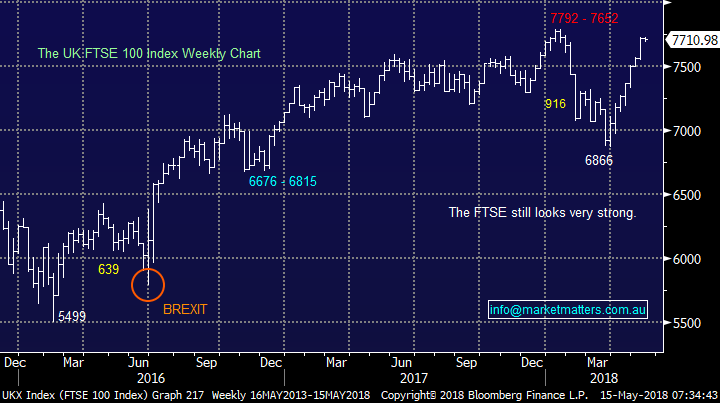
No change to our outlook for European stocks, we remain bullish targeting fresh 2018 highs, the UK FTSE is now only one decent night away.
UK FTSE Chart
Conclusion
1. MM intends to realise a 15% profit on our BHP holding this morning ~$34.
2. We a are bearish ORG around the $10 area and neutral WPL at present.
3. We see STO and ORG as potential trades / takeover plays for the aggressive investors.
Watch for alerts.
Overnight Market Matters Wrap
· The US equity indices closed up marginally, however with average volumes down nearly 20%, showing signs of fatigue after last week’s solid gains.
· Last night’s performance was seen as trade tensions between China and the US eased and geo-political issues pushed oil higher as the Gaza Strip erupted over the US moving its embassy to Israel. This occurred despite the UAE saying OPEC had spare production capacity to mitigate any impact with the sanctions imposed on Iran.
· The Volatility (VIX) index remains at complacent levels, while the ‘safe haven’ asset, gold eased.
· The June SPI Futures is indicating the ASX 200 to open 10 points lower towards the 6125 level this morning.
Have a great day!
James & the Market Matters Team
Disclosure
Market Matters may hold stocks mentioned in this report. Subscribers can view a full list of holdings on the website by clicking here. Positions are updated each Friday, or after the session when positions are traded.
Disclaimer
All figures contained from sources believed to be accurate. Market Matters does not make any representation of warranty as to the accuracy of the figures and disclaims any liability resulting from any inaccuracy. Prices as at 15/05/2018. 8.31AM
Reports and other documents published on this website and email (‘Reports’) are authored by Market Matters and the reports represent the views of Market Matters. The MarketMatters Report is based on technical analysis of companies, commodities and the market in general. Technical analysis focuses on interpreting charts and other data to determine what the market sentiment about a particular financial product is, or will be. Unlike fundamental analysis, it does not involve a detailed review of the company’s financial position.
The Reports contain general, as opposed to personal, advice. That means they are prepared for multiple distributions without consideration of your investment objectives, financial situation and needs (‘Personal Circumstances’). Accordingly, any advice given is not a recommendation that a particular course of action is suitable for you and the advice is therefore not to be acted on as investment advice. You must assess whether or not any advice is appropriate for your Personal Circumstances before making any investment decisions. You can either make this assessment yourself, or if you require a personal recommendation, you can seek the assistance of a financial advisor. Market Matters or its author(s) accepts no responsibility for any losses or damages resulting from decisions made from or because of information within this publication. Investing and trading in financial products are always risky, so you should do your own research before buying or selling a financial product.
The Reports are published by Market Matters in good faith based on the facts known to it at the time of their preparation and do not purport to contain all relevant information with respect to the financial products to which they relate. Although the Reports are based on information obtained from sources believed to be reliable, Market Matters does not make any representation or warranty that they are accurate, complete or up to date and Market Matters accepts no obligation to correct or update the information or opinions in the Reports.
If you rely on a Report, you do so at your own risk. Any projections are estimates only and may not be realised in the future. Except to the extent that liability under any law cannot be excluded, Market Matters disclaims liability for all loss or damage arising as a result of any opinion, advice, recommendation, representation or information expressly or impliedly published in or in relation to this report notwithstanding any error or omission including negligence.
To unsubscribe. Click Here


