Does MM see value in the struggling Insurance Sector? (BIN, CWY, MPL, NHF, QBE, IAG, SUN)
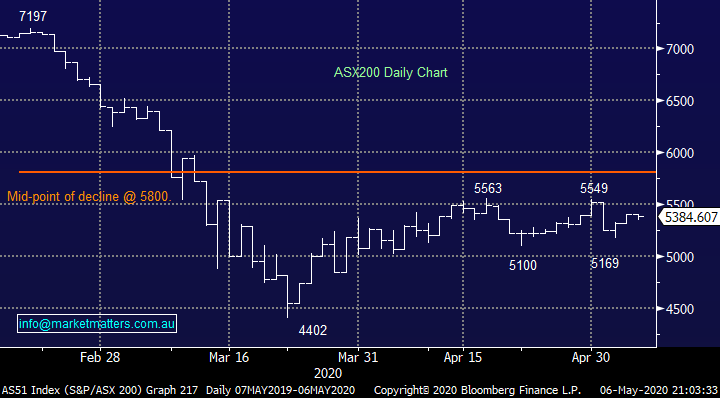
The ASX200 continues to tread water, it’s now been 20-trading days in the relatively tight band of 5100 and 5563 as the nightmare of March slowly but surely fades into the background. Yesterday the index fell 60-points into lunchtime before the buyers emerged and we rallied to close down a relatively meagre -0.42%, the short-term trend of “buy weakness and sell strength” continues. While I wouldn’t be surprised to see a” pop” of around 100-points outside of the recent range it’s a move I would be fading, in either direction. Our logic is simple, we believe it’s going to be months until we know how well both the Australian and Global economy will recover from COVID-19 hence we expect plenty of false dawns of both optimism and pessimism.
With the index relatively stable the moves catching our eye are on the stock / sector level, more like a normal market. Wednesday was primarily about the 2nd day of the Macquarie Conference as fund managers looked to read between the lines of company presentations. Two stocks which benefited from initial positive read throughs were Appen (APX) and Medibank (MPL) who rallied +8.8% and +3.8% respectively, the relatively low volumes in the SPI Futures (SPI) implies many investors are in a similar position to ourselves i.e. generally comfortable with their market exposure while looking to tweak portfolios around the edges.
I read an interesting article in the AFR last night where ASIC were warning Retail investors to be more cautious in these volatile times, they cited the disconcerting statistic below for “mums & dads” trying to become traders. More importantly I would argue the horse has bolted with regard to investors, the issue was evolving back in late 2019 as CBA announced an increase of over 50% in margin loans after they’d been stable for years, unfortunately numerous people obviously leveraged up near the top as they chased yield in a stock market where they felt comfortable, that’s clearly when warnings would have been more useful from the regulator.
“During the focus period, on more than two thirds of the days on which retail investors were net buyers, their share prices declined the following day, and on days where retail investors were net sellers, their share prices more likely increased the next day." – ASIC.
Damage has been inflicted on so many financially by the pandemic, but we believe it’s time to walk the uncomfortable path and start accumulating stocks in certain sectors of the market. There are numerous cliché phrases that apply to this logic like “buy when there’s blood on the streets” but what’s very different this time is the way we live our lives is changing at an accelerated pace. Many stocks / sectors in our opinion won’t recover particularly well from COVID-19, while others will do spectacularly well - its most definitely time to look through the windscreen and not in the rear-view mirror with regard to stock selection.
MM remains bullish equities medium-term, hence we are in net “buy mode”.
ASX200 Index Chart
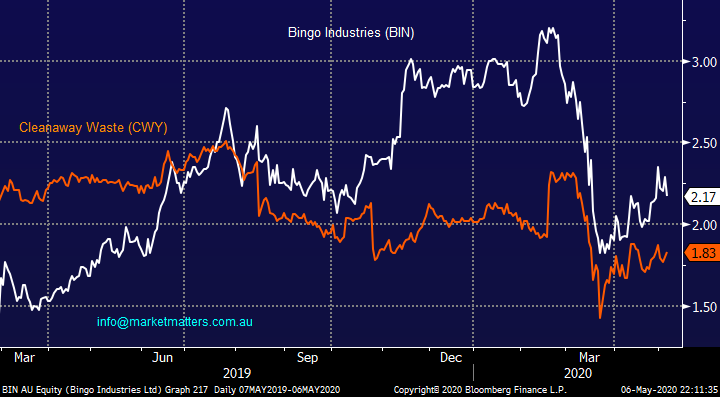
As we said previously the 2nd day of the Macquarie investors conference produced different short-term outcomes for rivals Bingo (BIN) and Cleanaway (CWY) with the former falling over 5%. Over the last few years these 2 stocks have almost taken it in turns to be the “hot play” in town hence we have taken a quick glance today at whether the comparative elastic band feels too stretched in either direction, the answer is a simple no and we are happy to stick with BIN with our exposure to the sector for now.
The update BIN provided yesterday showed some weakness in the utilization rates of their facilities and this has an impact on margins and thus earnings. While it is early days here we are conscious that it is on a fairly rich / optimistic valuation primarily because of its growth outlook in the years to come, hence we are likely to need a sustained economic pick up before the stock can embark on a solid rally.
MM remains comfortable / patient with our BIN position.
Bingo Industries (BIN) V Cleanaway Waste (CWY) Chart
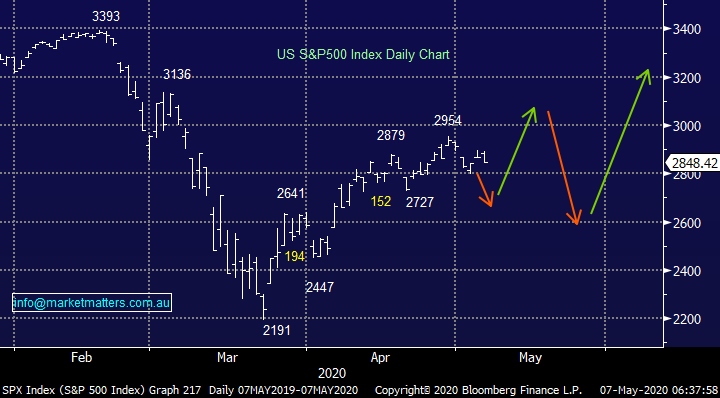
No change here, overnight US stocks closed mixed as the 2800 area continues to act like a magnet for the S&P500. We feel this could potentially be the case for a few months as investors attempt to second guess what comes next for the economy and company earnings. However people should be aware that after its strong recovery from the depths of March stocks are actually on the expensive side of the ledger compared to their historical average, in other words prices are already building in a degree of economic improvement in corporate earnings which while it makes sense will probably need a degree of confirmation before people are prepared to push P/E’s significantly higher.
MM remains bullish US stocks medium-term.
US S&P500 Index Chart
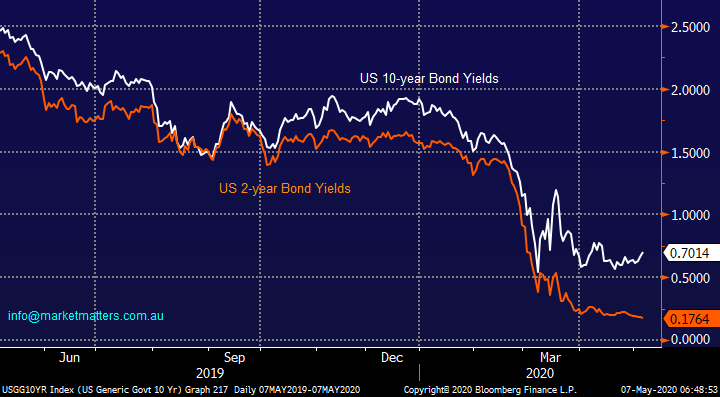
One of the most intelligent and followed market indicators is the US Yield curve and its sending a loud and clear positive message on the US economy, its currently telling us that a recovery is around the corner. Longer dated US 10-year yields are slowly ticking up compared to their shorter dated peers who are anchored to the zero level implying investors are seeing inflation / higher yields in the future, a good outcome when economic activity is your reference point.
Medium-term MM remains positive the global economy.
US 2 & 10-year Bond Yields Chart
The Australian Insurance Sector
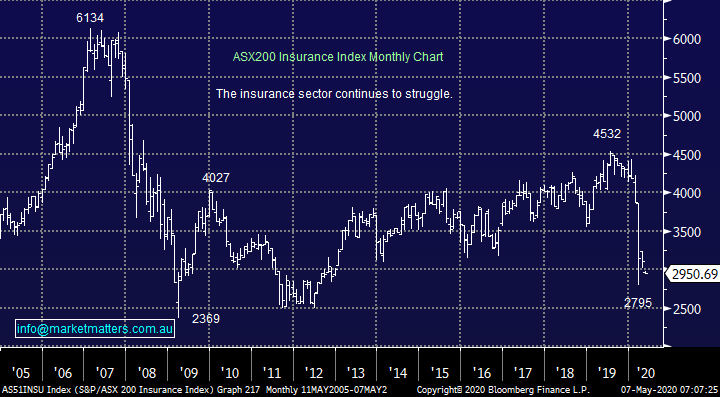
The local insurance stocks have been donning an underperformance hat of late, they are currently sitting 34% below their 2019 highs while only having managed to bounce around 5% from March’s panic lows – ouch! From a technical perspective the downside momentum looks entrenched with fresh lows for 2020 feeling likely. Insurance companies hold a float which they invest in stocks, bonds and alternative assets. We now know that both QBE and IAG have been caught holding portfolios which were too aggressive into the recent decline and this has cost them. They have now amended these allocations to be more bond focussed however the damage was done in March.
Ironically, it appears the professional money managers at these insurance companies have been caught in a similar manner to many retail investors as we illustrated earlier through CBA’s margin lending. They have moved up the risk curve as bond yields spiralled towards zero just when in hindsight, they should have been more conservative.
MM is not a fan of the Insurance Sector as a whole in 2020.
Today I have briefly looked at 4 of our local sector heavyweights in case an opportunity is lurking beneath the cloudy waters.
ASX200 Insurance Sector Chart
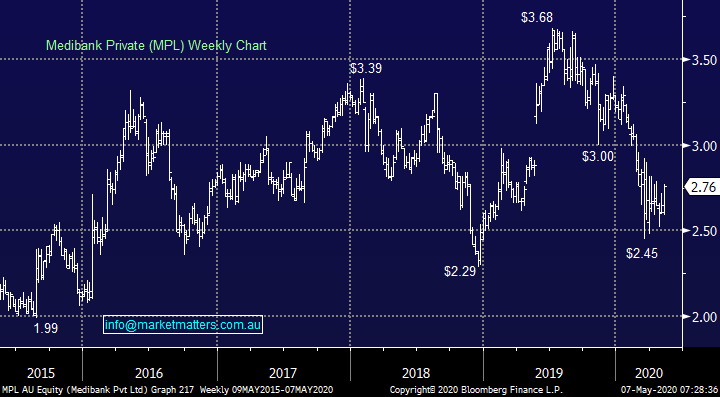
1 Medibank Private (MPL) $2.76
Yesterday private health insurer MPL enjoyed a positive reaction following its presentation at the Macquarie Conference, the underlying theme was talking down of policy growth as a result of closed stores but talking up retention. MPL has provided a $50m support package aimed at delaying premium increases and payments, it has also seen claims drop significantly with procedures being put off.
Interestingly the virus pandemic could go one of 2 ways for health insurers either it’s a wakeup call for many Australians without private health insurance as the “rainy day” event becomes more front of mind, or with the economy clearly in reverse discretionary spending will come under pressure. My feeling is the later will dominate at least this year i.e. I’m hearing lots of people worrying about money but none saying I wish I had, or I’m glad I have, private health cover!
MM has no interest in MPL, or NHF for this reason.
Medibank Private (MPL) Chart
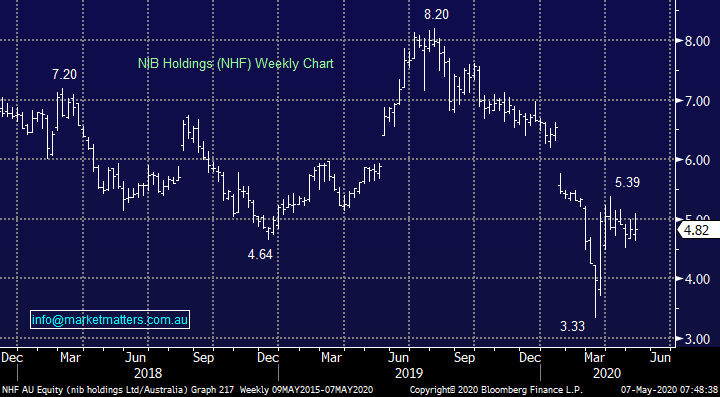
Technically NHF is more interesting than MPL with optimum entry around $4.50 but the fundamentals don’t excite us at present.
NIB Holdings (NHF) Chart
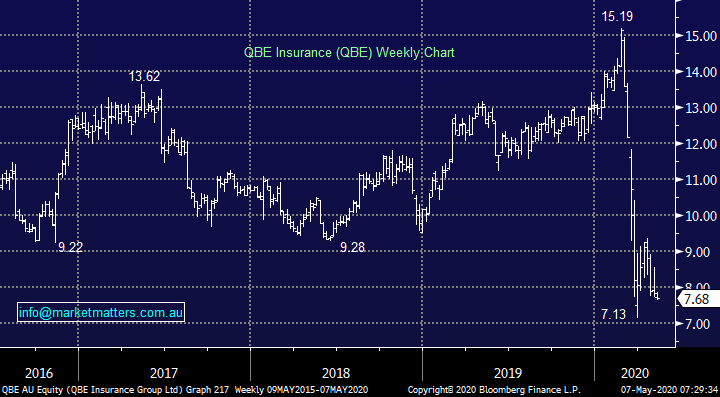
2 QBE Insurance (QBE) $7.68
QBE has been a serial underperformer since it peaked above $35 before the GFC, unlike many stocks there’s been no meaningful sustained recovery from this insurer. In mid-April they raised $US825 at $8.25, a placement that’s already showing buyers a paper loss. While the raise was prudent in today’s uncertain environment as it provided the company with a strong capital base moving forward, the size of the raise was a direct result of investment portfolio losses in the period.
In 1Q20 investment losses were US$500M pre-tax or 2% of QBE’s US$24B investment assets. This includes unrealised credit spread losses of US$350M and a risk-free rate benefit of $330M. Excluding this benefit, the loss was approximately US$830M or 3% of QBE’s investment assets.
These losses were larger than analysts expected and led to arguably a knee jerk panic reaction - QBE sold all its equities, emerging market and high yield debt and invested the proceeds in investment grade debt, this related to 10% of its investment assets.
We have previously written that buying into a recapitalised QBE has yielded results in the past however for now we see no compelling reason to buy QBE at current levels – the downside momentum suggests another challenge of the $7 area.
MM has no interest in QBE.
QBE Insurance (QBE) Chart
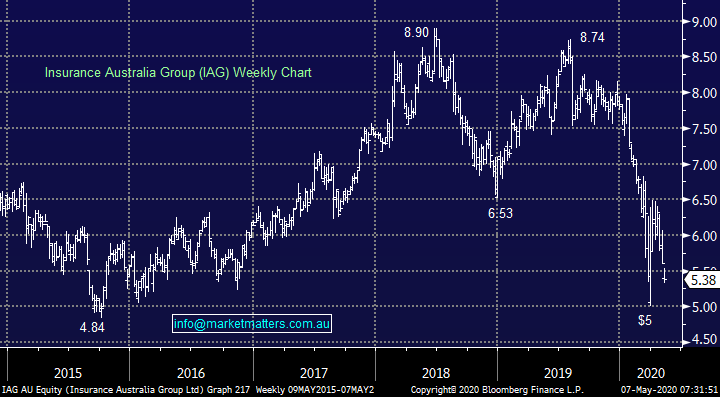
3 Insurance Australia Group (IAG) $5.38
Unfortunately, IAG walked very much in the footsteps of QBE - IAG announced an investment loss of approximately $330M on shareholders’ funds of $4B and $100M credit spread losses. The forecast investment return for IAG is a loss of $370M for 2H20, which represents 3.7% of IAG’s investment assets.
IAG has reduced its weighting in equities and alternative asset classes from 49% of shareholders’ funds (which is 20% of total investments) to 30% of shareholders’ funds (which is 12% of total investments). The reduction in risk related to 8% of investment assets.
It feels like both IAG and QBE are moving down the risk curve because they were “long & wrong” in March not necessarily because it’s how they should be positioned, the path of most pain for stocks on a comparative basis for both insurers is now up. With no dividend likely in the foreseeable future and further capital losses a very real risk we see no reason to own IAG.
MM has no interest in IAG.
Insurance Australia Group (IAG) Chart
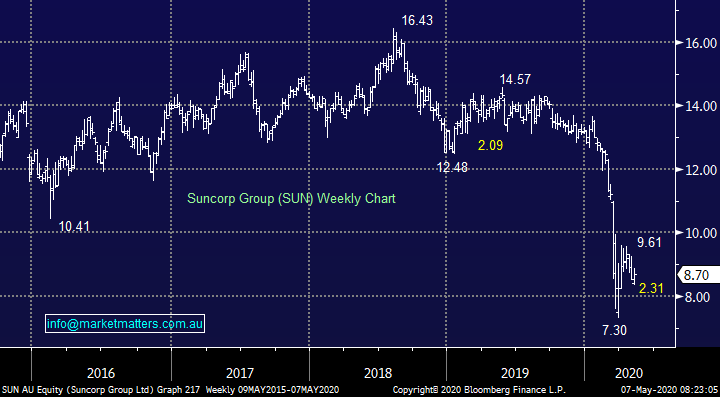
4 Suncorp (SUN) $8.70
Lastly Queensland based insurer / bank SUN which has a had a foot in 2 tough camps at present reflected by a share price that has basically halved since 2018. Like most of the banks its dividend in August is likely to be cut or vanish altogether depending on business conditions at the time. If we see further aggressive selling in the stock / sector another test of the $7 area would provide an interesting valuation opportunity in SUN.
MM is currently neutral SUN.
Suncorp (SUN) Chart
Conclusion
MM has no interest in the Australian Insurance Sector until further notice.
Overnight Market Matters Wrap
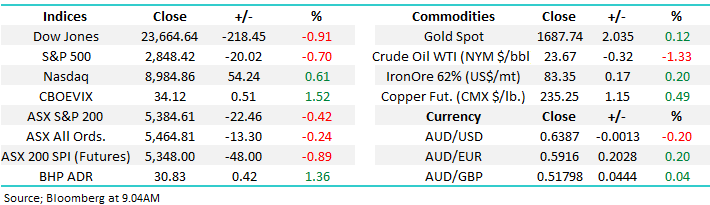
- The broader US equity markets sold off overnight while the tech. heavy Nasdaq 100 continues to outperform
- On the energy front, Crude oil slid, currently at US$23.67/bbl.
- BHP is expected to outperform the broader market after ending its US session up an equivalent of 1.36% from Australia’s previous close.
- The June SPI Futures is indicating the ASX 200 open 30 points lower, testing the 5350 level this morning.
Have a great day!
James & the Market Matters Team
Disclosure
Market Matters may hold stocks mentioned in this report. Subscribers can view a full list of holdings on the website by clicking here. Positions are updated each Friday, or after the session when positions are traded.
Disclaimer
All figures contained from sources believed to be accurate. All prices stated are based on the last close price at the time of writing unless otherwise noted. Market Matters does not make any representation of warranty as to the accuracy of the figures or prices and disclaims any liability resulting from any inaccuracy.
Reports and other documents published on this website and email (‘Reports’) are authored by Market Matters and the reports represent the views of Market Matters. The Market Matters Report is based on technical analysis of companies, commodities and the market in general. Technical analysis focuses on interpreting charts and other data to determine what the market sentiment about a particular financial product is, or will be. Unlike fundamental analysis, it does not involve a detailed review of the company’s financial position.
The Reports contain general, as opposed to personal, advice. That means they are prepared for multiple distributions without consideration of your investment objectives, financial situation and needs (‘Personal Circumstances’). Accordingly, any advice given is not a recommendation that a particular course of action is suitable for you and the advice is therefore not to be acted on as investment advice. You must assess whether or not any advice is appropriate for your Personal Circumstances before making any investment decisions. You can either make this assessment yourself, or if you require a personal recommendation, you can seek the assistance of a financial advisor. Market Matters or its author(s) accepts no responsibility for any losses or damages resulting from decisions made from or because of information within this publication. Investing and trading in financial products are always risky, so you should do your own research before buying or selling a financial product.
The Reports are published by Market Matters in good faith based on the facts known to it at the time of their preparation and do not purport to contain all relevant information with respect to the financial products to which they relate. Although the Reports are based on information obtained from sources believed to be reliable, Market Matters does not make any representation or warranty that they are accurate, complete or up to date and Market Matters accepts no obligation to correct or update the information or opinions in the Reports. Market Matters may publish content sourced from external content providers.
If you rely on a Report, you do so at your own risk. Past performance is not an indication of future performance. Any projections are estimates only and may not be realised in the future. Except to the extent that liability under any law cannot be excluded, Market Matters disclaims liability for all loss or damage arising as a result of any opinion, advice, recommendation, representation or information expressly or impliedly published in or in relation to this report notwithstanding any error or omission including negligence.


