“Doctor Coppers” not convinced about a recession (MQG, MFG, OZL, BHP, SFR)
The ASX200 put in an impressive performance on the last Wednesday of this volatile August, most external factors were pointing to a negative day but the buyers had different ideas. Over 65% of the market closed positive and if wasn’t for some apparent selling in the banks to fund Macquarie Groups major capital raise we could easily have seen a much bigger day, although the stoic rally back above 6500 would still have disappointed many bears. MM feels the path of least resistance is up, in at least the short-term, which is illustrated by how easily local stocks ignored the negative news flow yesterday:
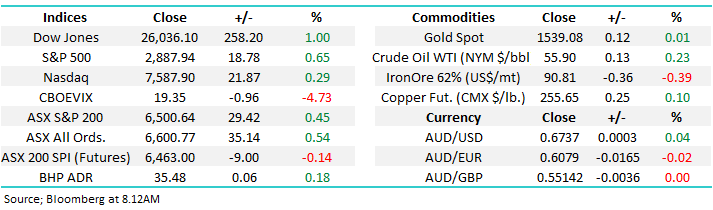
1 – The Dow closed down 120-points / 0.5%, giving back solid early gains to look like a market teetering on the edge of failure.
2 – Macquarie Group (MQG) is set to raise up to $1.6bn, including $1bn from institutional investors at $120; only a 2.8% discount to Tuesdays closing price. This significant cap raise clearly sucked some buying out of the banks but the market’s resilience showed there’s plenty of buyers lurking on the sidelines.
Importantly the aggressive bidding by institutions for MQG illustrates our repeated message that fund managers are cashed up looking for a perceived safe home, ideally paying a decent yield – MQG is forecasted to yield close to 5% part-franked next year, way above term deposits which have plunged lower towards the 1.5% level.
Today is the last real meaningful day of August reporting season and it’s been a tough one. This morning we will see results from Appen Ltd (APX), Ausdril (ASL), Ramsay Healthcare (RHC) and Woolworths (WOW) to name but a few. Reporting calendar available here. I cover Initial thoughts this morning on: APX, AS:, RHC & WOW

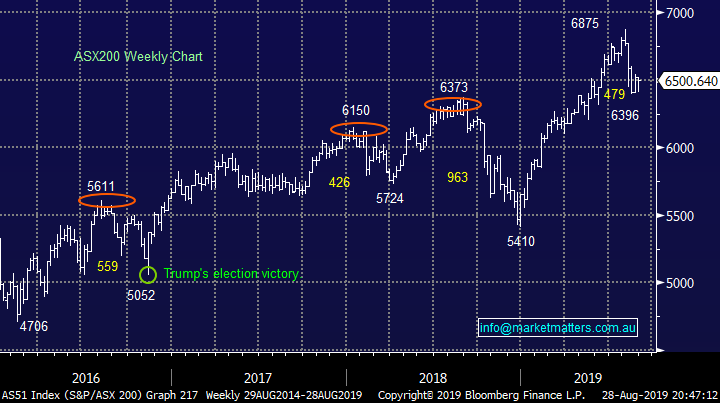
No change technically, we can still see another 1-2 weeks of consolidation for the ASX200 between 6400 and 6600. While our ultimate view is we see another decent test to the downside, for the same reasons MQG sold $1bn of stock in a few hours (lots of cash on the sidelines) we believe there will be plenty of buyers if / when value does present itself. This rotation in a range between pessimism of a recession v optimism of low rates is our best guess scenario for the market dynamics at this juncture.
MM remains comfortable adopting a conservative stance towards equities, especially around the 6600 area.
Overnight US stocks were strong as the Dow rallied 1% to close back above 26,000, the SPI futures are pointing to a flat open for the ASX200 implying the local index put in its good work / effort yesterday.
Today we have updated our thoughts on copper, and its related stocks, following this week’s reports from OZ Minerals (OZL) & Sandfire (SFR) as this closely followed economic indicator stubbornly holds onto its 2 ½ year support level.
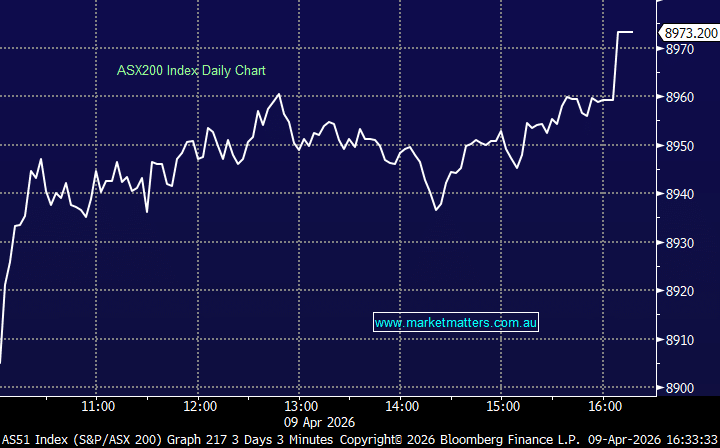
ASX200 Chart
As most of you now know Macquarie Group (MQG) have “tapped” institutions for $1bn with an additional $600m to be received from a share purchase plan. The interesting question is are the historically street smart MQG getting in early to build a war chest because they foresee a recession on the horizon and subsequent bargains to be had, or do they intend to grow in a “business as usual manner”. Only time will tell but this well oiled machine still looks attractive to MM at lower levels.
MM likes MQG below $108.
Macquarie Group (MQG) Chart
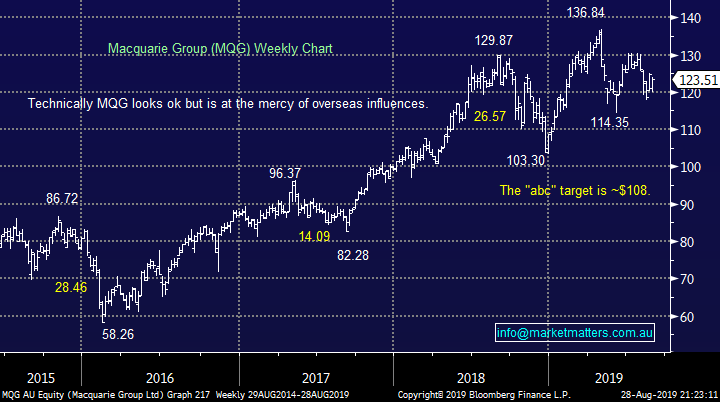
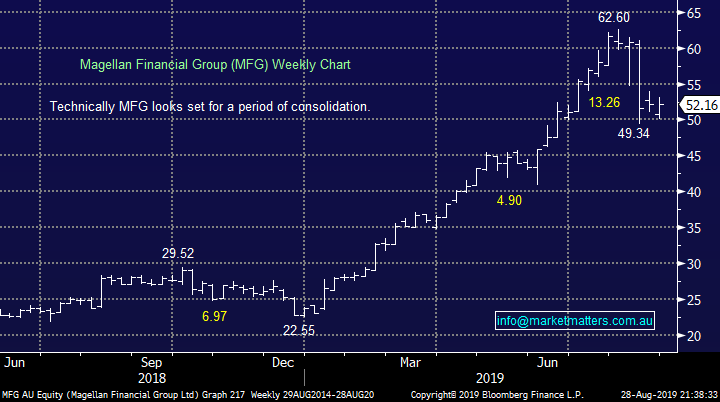
Its important that subscribers understand that just because institutions had strong appetite for MQG ~$120 this buying maybe largely satisfied, hence our target ~8% lower is not out of the question e.g. a couple of weeks ago Magellan (MFG) sold almost 5 million new shares at $55.20 adding $275m into the fund managers coffers. However within a week the share price had fallen over 10% below the placement price - if MQG follows suit it would hit our buy zone.
MM is neutral MFG at current levels.
Magellan Financial Group (MFG) Chart
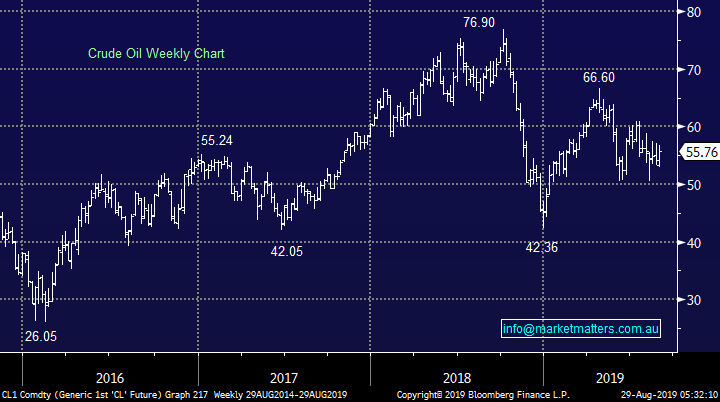
Interestingly crude oil, similarly to copper which we are covering later remains well above its 2-year lows, not the price action of a global economy plunging into a recession. Overnight the US Oil sector dragged the S&P500 higher by rallying over 1.5%, a very similar move on the day to the underlying commodity.
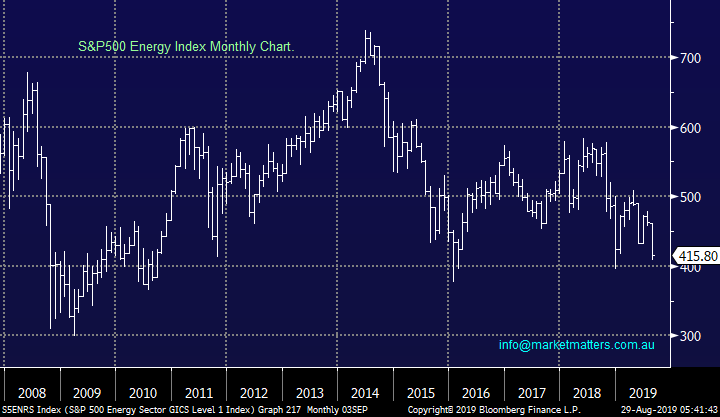
However when we look at the US Energy Sector over the last 5-years the 40% decline during an equities bull market is very disappointing, especially as a test of the GFC lows still looks a distinct possibility.
MM is neutral / bearish the US Energy Sector.
Crude Oil Chart
US S&P500 Energy Index Chart
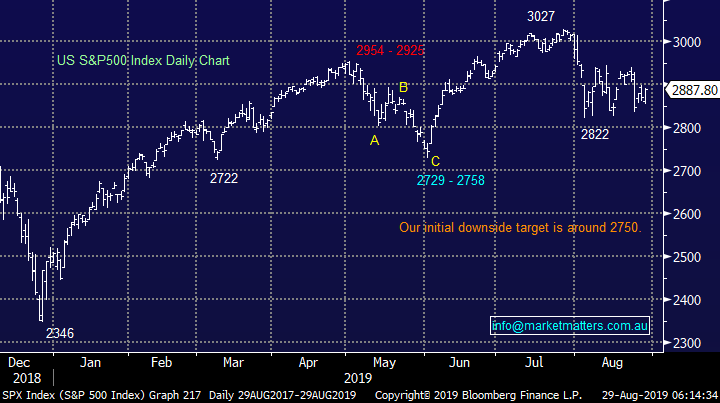
Still no change in our opinion for US stocks: “MM believes we have entered a new short-term cycle for US stocks where bounces should be sold by the active trader”.
Our medium-term target for this market correction is around 5% lower but we continue to feel a squeeze towards 2960, or 3% higher, to stop out shorts is a strong possibility i.e. remember the market likes to move in the path of most pain.
Our initial target for this pullback by US stocks is ~5% lower.
US S&P500 Chart
Revisiting the Australian copper sector
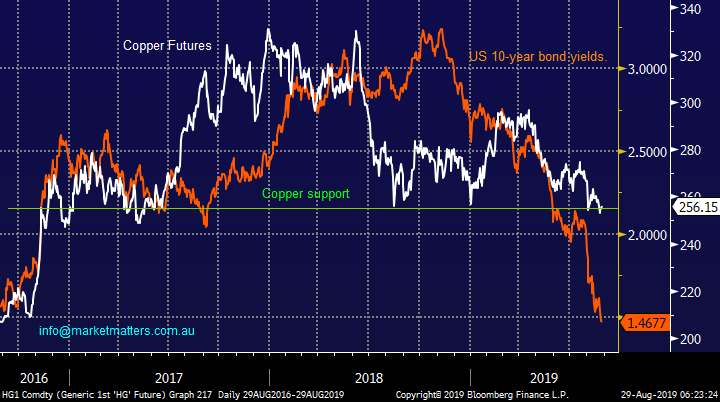
Copper is often referred to as “Doctor Copper” because of its ability to predict economic strength / weakness moving forward – a logical relationship when we consider coppers uses as an industrial metal. Historically the base metal price often follows US 10-year bond yields i.e. a weak economy is illustrated by falling copper prices and bond yields. Interestingly in 2019 bond yields have plunged towards all-time lows but copper remains resilient, trading slightly above levels tested back in 2016, we ponder is one of them getting it wrong?
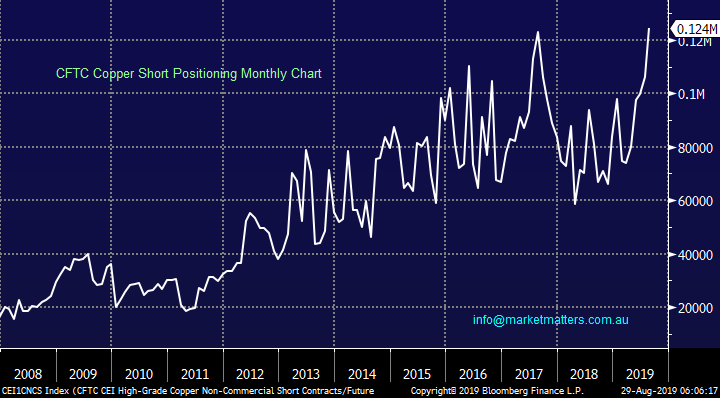
While the copper price continues to tread water its “short position” has reached extreme levels, in a comparative manner to how bond yields have plunged lower. Historically the CFTC short position is not a great timing tool but it does offer confidence to investors / traders looking for a contrarian buying opportunity i.e. copper is potentially a sector to consider if / when the S&P500 hits our targeted 2750 support.
The markets literally “all in” with its position for a global recession as indicated by bond yields and copper shorts hence the path of most pain is at least a bounce higher in both, perhaps in Q4 of 2019 – we should not forget that central banks have more tricks up their sleeves to prop up the global economy.
MM is neutral copper at present.
Copper & US 10-year bond yields Chart
CFTC Copper “Short Positioning” Chart
Today we have looked at 3 major copper stocks with one eye firmly on risk / reward buying levels in the weeks ahead.
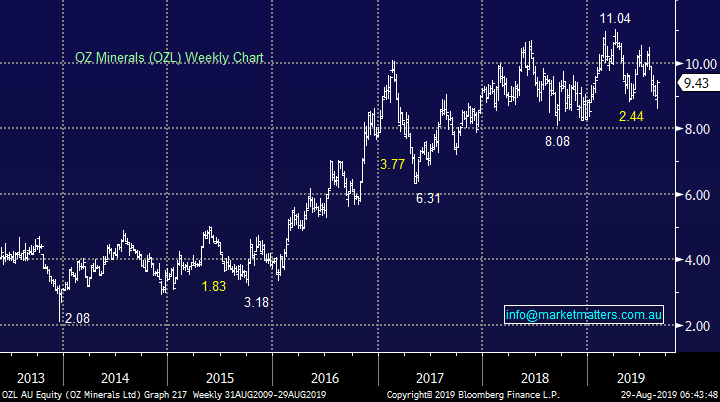
1 OZ Minerals (OZL) $9.43
OZL rallied almost 6% on its report yesterday as investors looked through the headline numbers which simply showed a lag between production and materials sold, a gap that will be closed in the second half of the year due to forward sales.
Fundamentally we still like OZL believing the market to be underestimating the medium-term quality of its assets plus we believe the companies gold production will continue to add a major tailwind to the stock in the year ahead.
MM likes OZL at current levels weakness and are considering scaling a position.
OZ Minerals (OZL) Chart
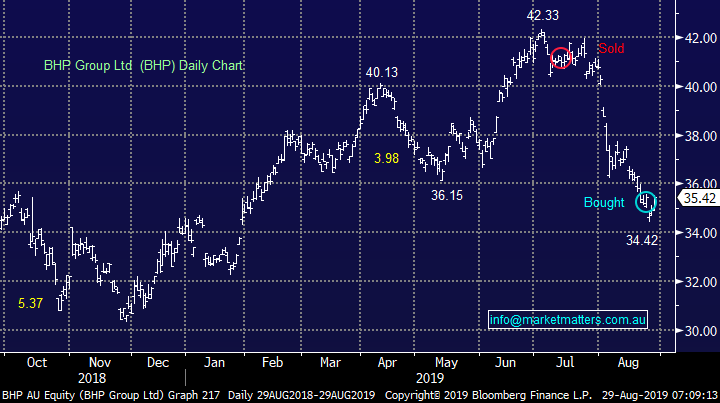
2 BHP Group (BHP) $35.42
We could have easily used RIO Tinto (RIO) in this slot with both major diversified miners enjoying significant exposure to copper but they both look very similar at present hence we simply opted for MM’s most recent purchase.
Technically BHP looks set to bounce towards $37.50 although its 78c fully franked dividend next Thursday will skew the charts slightly. We can see a trading range between $33 and $37.50 for the balance of 2019 as the volatile swings in iron ore are likely to dominate the stock’s price. Hence we are buyers / accumulators around 2019 lows but will also be potential sellers ~5% higher.
MM likes BHP at current prices.
BHP Group (BHP) Chart
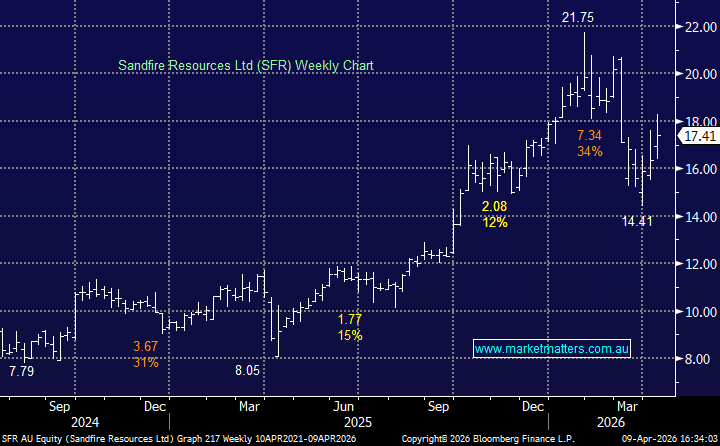
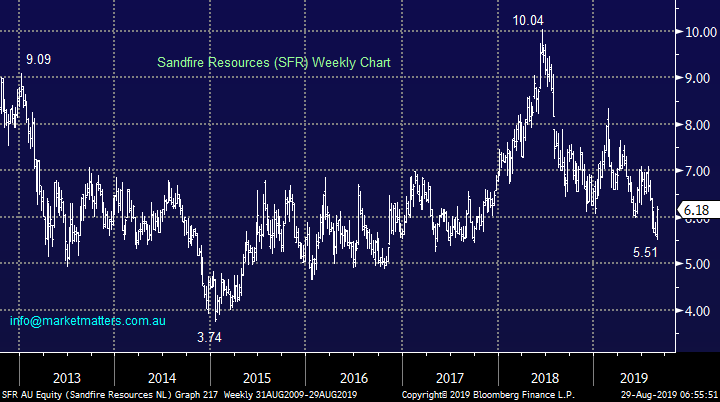
3 Sandfire Resources (SFR) $6.18
WA copper and gold producer Sandfire (SFR) has endured a tough 12-months when its peers have boomed. However the miner has rallied nicely from this month’s lows following a solid full-year earnings result and subsequent upgrades from a number of brokers (Bells, Macquarie, Credit Suisse all upgraded to buy). The company reported a $104m profit (NPAT) on revenue of almost $600m - down 13.5% on the year however the outlook now looks better.
Not our favourite stock in the sector but if / when investors do again start chasing the growth names SFR could easily pop towards the $8 area.
SFR is a candidate for a strong bounce when we see short covering start to play out in copper
Sandfire Resources (SFR) Chart
Conclusion (s)
Our favourite copper stock is currently OZ Minerals (OZL) and it’s a strong candidate for our Growth Portfolio if / when we see another leg lower by stocks in the weeks ahead.
**Watch for alerts**
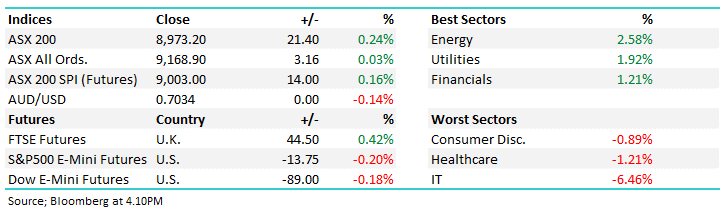
Global Indices
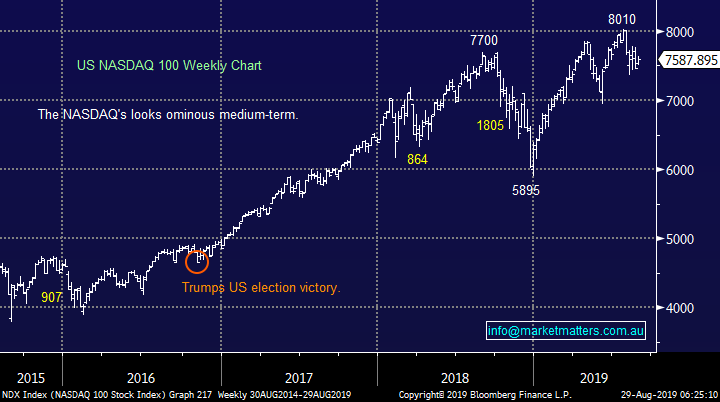
We believe US stocks are now bearish as discussed over recent weeks, the tech based NASDAQ’s short-term resistance comes in around 7800 while initial support is almost 8% lower.
US stocks have generated technical sell signals.
US NASDAQ Index Chart
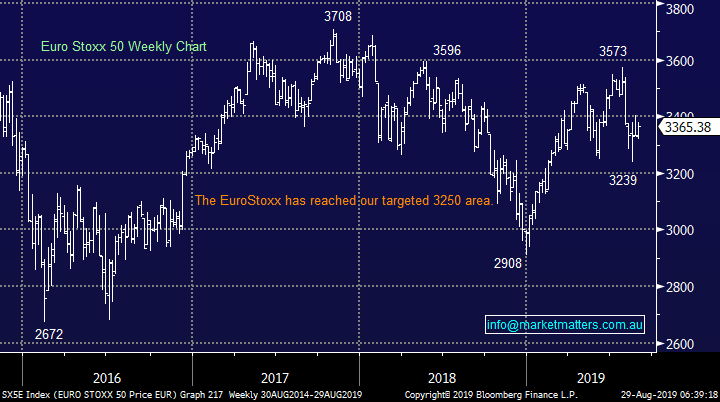
No change again with European indices, while we remain cautious European stocks as their tone has become more bearish over the last few months, however we had been targeting a correction of at least 5% for the broad European indices, this has now been achieved.
The long-term trend is up hence any “short squeezes” might be harder and longer than many anticipate.
Euro Stoxx 50 Chart
Overnight Market Matters Wrap
· The US continued its game of see-saw overnight, with the major indices all ending their session in the green, led by the energy and financial sector.
· Across in the Eurozone, British PM Johnson suspended Parliament which means MP’s may not have enough time to pass legislation to avert a hard Brexit.
· On the commodities front, crude oil rose as expected, following the anticipated data showing a decrease in stockpiles.
· The September SPI Futures is indicating the ASX 200 to open with little change, testing the 6500 level this morning with August equity index expiry this afternoon.
Have a great day!
James & the Market Matters Team
Disclosure
Market Matters may hold stocks mentioned in this report. Subscribers can view a full list of holdings on the website by clicking here. Positions are updated each Friday, or after the session when positions are traded.
Disclaimer
All figures contained from sources believed to be accurate. All prices stated are based on the last close price at the time of writing unless otherwise noted. Market Matters does not make any representation of warranty as to the accuracy of the figures or prices and disclaims any liability resulting from any inaccuracy.
Reports and other documents published on this website and email (‘Reports’) are authored by Market Matters and the reports represent the views of Market Matters. The Market Matters Report is based on technical analysis of companies, commodities and the market in general. Technical analysis focuses on interpreting charts and other data to determine what the market sentiment about a particular financial product is, or will be. Unlike fundamental analysis, it does not involve a detailed review of the company’s financial position.
The Reports contain general, as opposed to personal, advice. That means they are prepared for multiple distributions without consideration of your investment objectives, financial situation and needs (‘Personal Circumstances’). Accordingly, any advice given is not a recommendation that a particular course of action is suitable for you and the advice is therefore not to be acted on as investment advice. You must assess whether or not any advice is appropriate for your Personal Circumstances before making any investment decisions. You can either make this assessment yourself, or if you require a personal recommendation, you can seek the assistance of a financial advisor. Market Matters or its author(s) accepts no responsibility for any losses or damages resulting from decisions made from or because of information within this publication. Investing and trading in financial products are always risky, so you should do your own research before buying or selling a financial product.
The Reports are published by Market Matters in good faith based on the facts known to it at the time of their preparation and do not purport to contain all relevant information with respect to the financial products to which they relate. Although the Reports are based on information obtained from sources believed to be reliable, Market Matters does not make any representation or warranty that they are accurate, complete or up to date and Market Matters accepts no obligation to correct or update the information or opinions in the Reports. Market Matters may publish content sourced from external content providers.
If you rely on a Report, you do so at your own risk. Past performance is not an indication of future performance. Any projections are estimates only and may not be realised in the future. Except to the extent that liability under any law cannot be excluded, Market Matters disclaims liability for all loss or damage arising as a result of any opinion, advice, recommendation, representation or information expressly or impliedly published in or in relation to this report notwithstanding any error or omission including negligence.