Do we see any value in the ASX200’s 5 worst performers? (A2M, ING, IEL, SDA, CYB)
The ASX200 slipped lower on its “hump” day for the week but while losers outnumbered winners by almost 2:1 the index’s decline was limited to just -0.2% - again, buying late in the session window dressed the days weakness. The markets continuing to show a distinct lack of commitment in either direction with less than 20% of stocks closing up, or down, by more than 2% i.e. an extremely quiet day under the hood. This morning will see the expiration of both the September index futures and options, a phenomenon that we believe may have been supporting stocks over the last week – time will tell.
This weeks seen a rapid turnaround in the local bond market, sending bond yields lower in the process. Hence it’s no surprise we’ve seen improved sentiment towards the Healthcare, Gold, IT and “yield play” sectors, areas of the market which have performed strongly in 2019. We can see a few more weeks in this short-term move hence at MM we have bought back into the gold stocks through Evolution Mining (EVN) and Newcrest Mining (NCM) but we reiterate it’s a short-term play with our target for NCM only around 10% higher, not a great deal for this volatile sector.
We are slowly but surely leaning towards the view that the recent aggressive sector rotation from growth towards cyclicals was a warning sign for what’s in store for equities in 2020. If this “Gut Feel” is correct then the current pullback in cyclicals may ultimately provide an excellent buying opportunity. At MM we are not particularly exposed to the growth stocks hence our focus will be more on any weakness in the above mentioned cyclicals.
Short-term MM remains comfortable adopting a more conservative stance towards equities around current market levels.
Overnight global stocks were volatile following the US Feds decision to cut interest rates, accompanied by some conservative rhetoric leaving the market second guessing if rate cuts are finished. The Dow initially plunged over 200-points only to bounce back to close marginally higher, US stocks are matching our own for lack of conviction this September. It feels prudent to us that the Fed have maintained a degree of flexibility moving forward. The SPI futures are calling the ASX200 to open up around 15-points although weakness in the resources looks likely to weigh on stocks.
This morning MM has looked at 5 of the ASX200’s worst performers over the last month as we ponder whether elevated levels of both stock and sector rotation can bring any of these “dogs” back into favour.
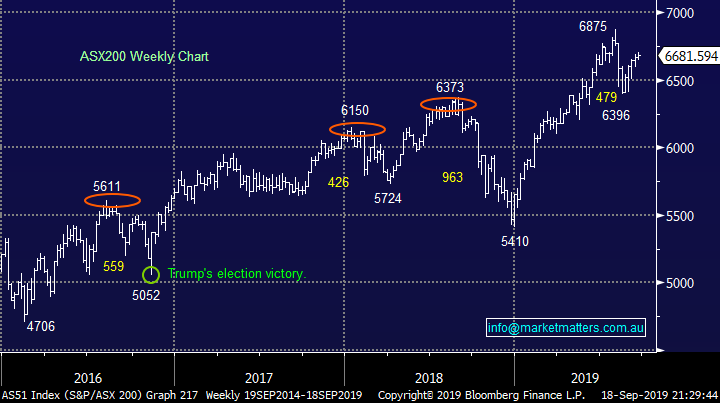
ASX200 Chart
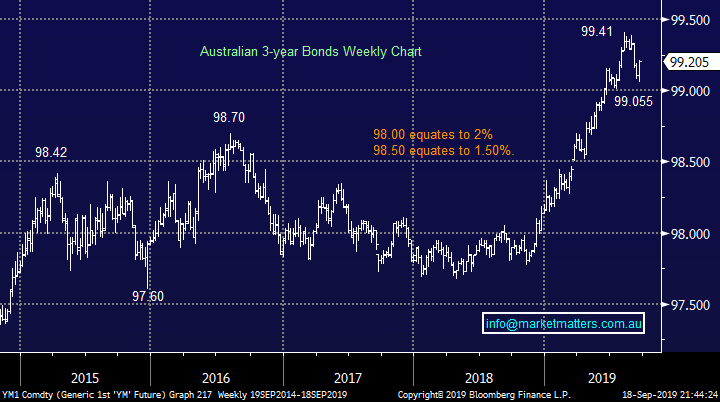
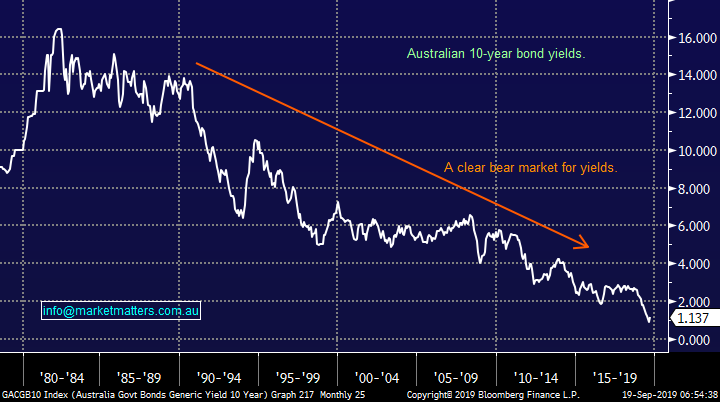
This week has seen the Australian 3-year bonds recover almost half of the previous 6-weeks losses making the pullback feel like nothing more than a blip in a huge bull market for bonds / bear market for yields. The trend suggests new highs in the weeks ahead but we are considering fading a “pop” towards 99.50, from purely a risk / reward perspective e.g. for the MM Growth Portfolio we would cut golds and switch to cyclicals.
MM is targeting the 99.50 area for Australian 3-year bonds i.e. 0.5%.
Australian 3-year Bonds Chart
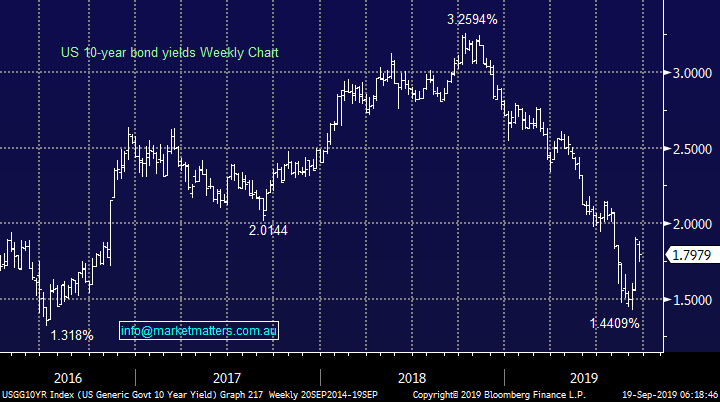
Similarly US bond yields have started to slip lower after the Feds action last night, after all they cut rates and didn’t rule out further action. From a simple risk / reward perspective MM has to lean with continuation of the trend lower in bond yields, a move which has been strong in 2019 - a move to fresh yield lows will reverse our interpretation of fair value.
MM will consider fading a break to fresh lows by US 10-year bond yields.
US 10-year bond yield Chart
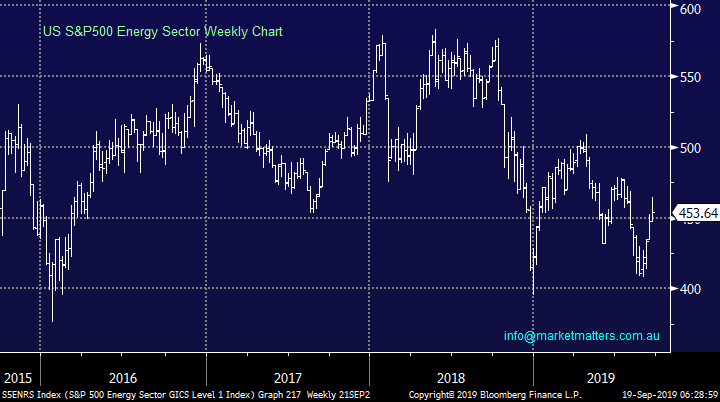
Overnight in the US the weakest sector in the S&P500 was again Energy which fell -0.4%, however if we were trading this group we would be buying at todays levels with stops only 2% below this mornings close – boring old risk / reward. If energy stocks cannot hold onto any of this weeks gains its not a place we want to be buying i.e. we expect the sector to hold onto some of Mondays rally following drone attacks on Saudi’s production facilities and subsequent heightened uncertainties in the region – markets should rally on bullish news.
MM likes the Energy sector at current levels.
US S&P500 Energy Sector Chart
Evaluating the markets 5 worst performers.
As market players question whether the multi-decade global interest rate cycle is coming to an end we’ve witnessed some major swings in stock and sector rotation although the index itself remains in a slumber. Hence today we have looked at 5 of the worst performing stocks over the last month to see if some value is presenting itself – “cheap” stocks are definitely not abundant in the ASX200 at the moment as it trades close to 6700.
Australian 10-year Bond yields Chart
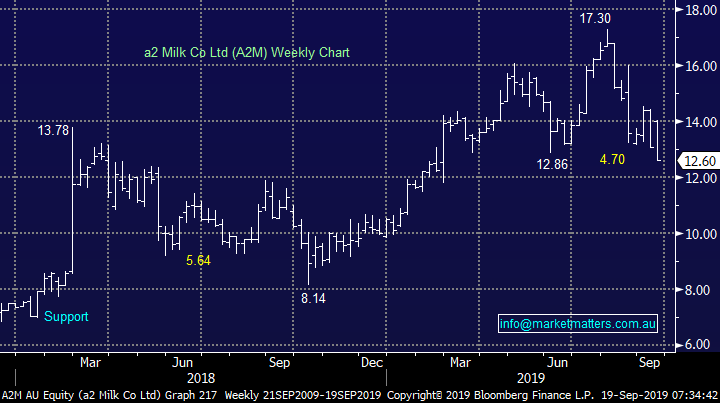
1 a2 Milk (A2M) $12.60
a2 Milk (A2M) has resided amongst the best performers over recent years so the initial question is what’s gone wrong? A2M is down over -18% this month and has corrected over -27% from this year’s high with competition in its important US and China markets a definite concern. A2M is increasing its marketing spend which can be interpreted in differing ways with somewhere in between probably correct i.e. competition has increased but A2M is continuing to expand aggressively while the window of opportunity remains firmly open.
Another important reason behind the stocks decline was virtually everybody was already bullish / long hence few fresh buyers have put their hand up for stock while many momentum traders and “weak longs” have jumped off the band wagon. Technically support below $12 is worth considering, especially if we get a news driven event which sends investors scurrying away from China facing companies.
A2M is still trading on an Est P/E for 2020 of 30x, certainly not in the cheap basket but the company has got an excellent history of delivering growth e.g. revenue grew by over 40% in FY19 and profit by 47%.
MM likes a2m as a business and feels value will be on offer below $12.
a2 Milk (A2M) Chart
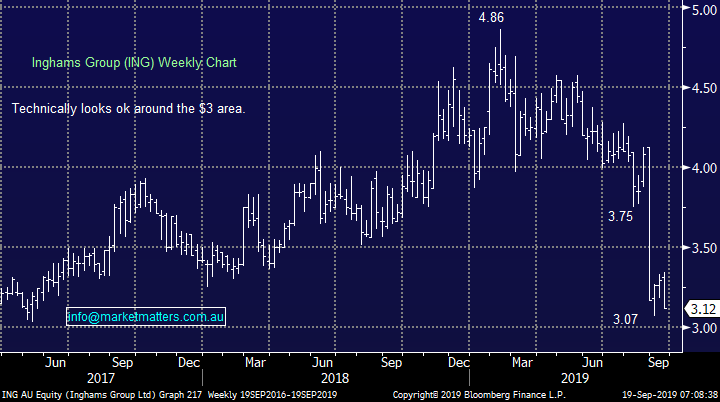
2 Ingham’s Group (ING) $3.12
Poultry business ING has corrected over 21% this month and a painful 36% from the high of 2019 following the release of its FY19 earnings which produced a NPAT (net profit after tax) of $126m, up over 10% but margin pressures caught investors’ attention as did the fairly muted outlook. MM likes the company believing this cheap source of protein will remain popular with the core consumers – in fact, it was actually too much demand that saw them struggle in FY19 from a profitability perspective.
The shares are currently trading on a conservative Est P/E for 2020 of under 13x while yielding over 6% fully franked – the company paid a 10.5c fully franked dividend earlier in the week.
MM likes ING around $3.
MM is considering switching half of its costa Group (CGC) Holding, which has recently bounced almost 30%, into ING which is trading near its lows.
Ingham’s Group (ING) Chart
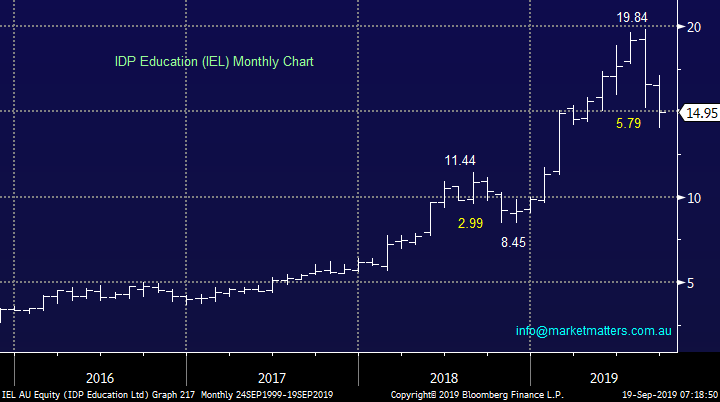
3 IDP Education (IEL) $14.95
This student services business has corrected over 22% this month, a disappointing market reaction to Augusts FY19 result which produced revenue up 23% coming in just below $600m. No guidance going forward except promises of further growth was clearly received badly by investors, especially as the stock was almost priced for perfection.
The shares are currently still trading on a rich Est P/E for 2020 of over 44x while yielding over 1.5%, part franked. Technically IEL looks interesting below $15.
MM is unlikely to buy IEL but this does represent one of the best technical opportunities in months for the believers in the story.
IDP Education (IEL) Chart
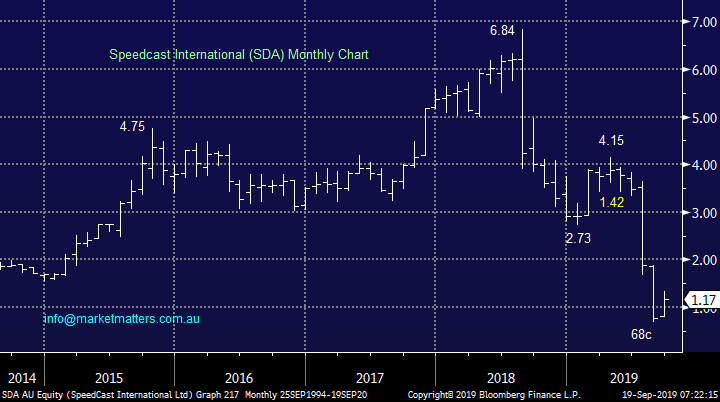
4 Speedcast International (SDA) $1.17
Satellite and communications business for the maritime industry SDA has tumbled over 30% during the last month following the release of its half year results, this is certainly a stock with downside momentum! The company produced a 3% increase in EBITDA to over $60m but a 20% fall in NPATA to less than $15m. however the big issue is debt increasing to $625m, well above the companies $280m market cap.
MM has put SDA in the too hard basket for now – its destressed balance sheet a concern.
SpeedCast International (SDA) Chart
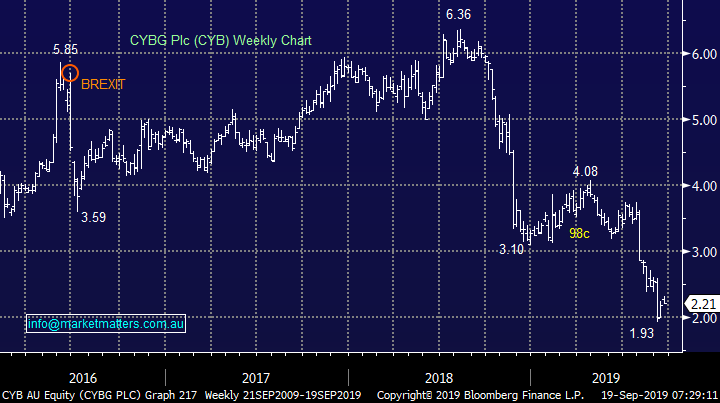
5 CYBG Plc (CYB) $2.21
Lastly is the UK based bank CYB which has been a chronic underperformer since mid-2018, MM continues to dislike the business both technically and fundamentally but bounces in the share price are inevitable. However the stock is down another 16% over the last month adding to its chronic wealth destruction.
The shares are currently still trading on a very cheap Est P/E for 2019 of under 5x but the company has never paid a dividend since listing on the ASX.
CYB remains in the too hard basket for MM.
CYBG Plc (CYB) Chart
Conclusion (s)
Of the 5 stocks looked at today MM is slowly becoming interested in Ingham’s (ING) and a2 Milk (A2M).
Global Indices
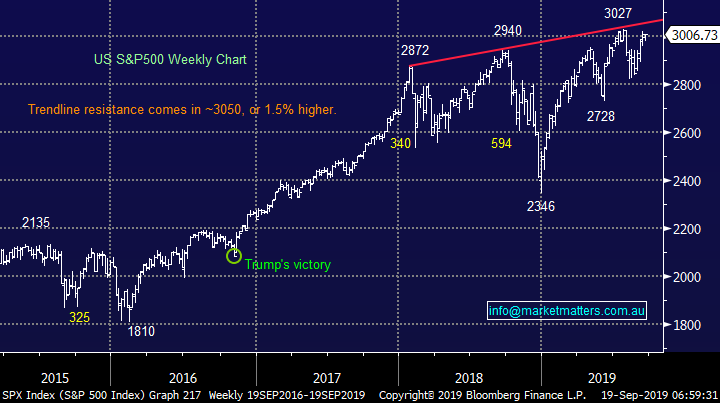
No major change yet, we are looking for a decent pullback for US stocks but no specific sell signals have been triggered – note at the moment we still feel a break to fresh all-time highs will fail to aggressively follow through to the upside.
US stocks remain clearly firm but with little upside momentum.
US S&P500 Index Chart
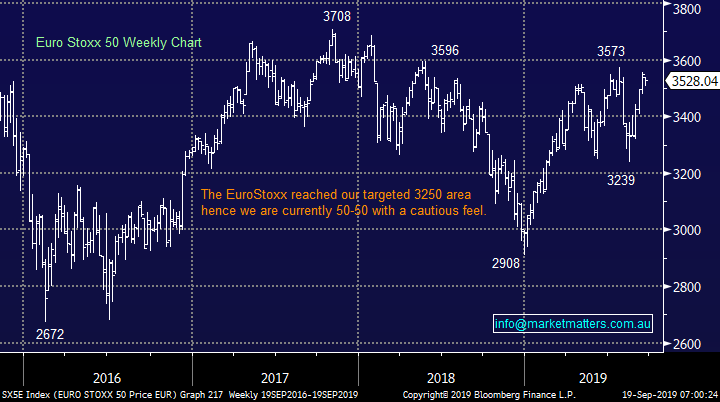
No change again with European indices, while we remain cautious European stocks as their tone has become more bearish over the last few months, however we had been targeting a correction of at least 5% for the broad European indices, this was achieved.
The long-term trend is up hence any “short squeezes” might be harder and longer than many anticipate, potentially one is currently unfolding.
Euro Stoxx 50 Chart
Overnight Market Matters Wrap
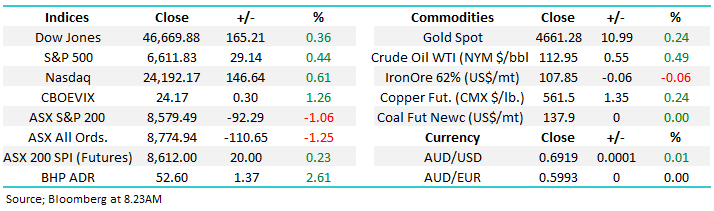
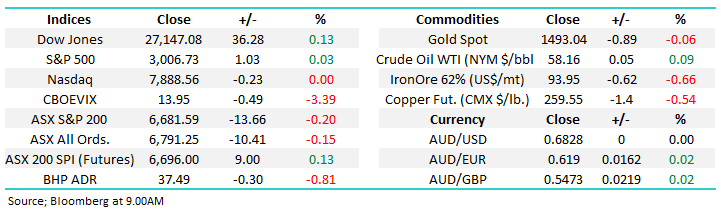
· Wall St closed flat overnight after the Federal Reserve announced its much expected 25bp rate cut to bring rates within a band of 1.75%-2%.
· The chairman Jerome Powell said the Fed could cut rates further if the US economy slowed down but did not see those conditions right now. His fellow board members also had mixed views on the need for a rate cut both now and in the future while President Trump called for deeper cuts saying the Fed had “no guts, no sense, no vision.”
· Oil prices also retreated further, with Brent losing 1.3% to US$63.70/bbl, as the Saudis produced evidence to support claims that the Iranians were behind the weekend drone attack on their oil facilities. Other Commodities were little changed with the spot gold price drifting below US$1500/Oz.
· The September SPI Futures is indicating the ASX 200 to open 15 points higher towards 6696.
Have a great day!
James & the Market Matters Team
Disclosure
Market Matters may hold stocks mentioned in this report. Subscribers can view a full list of holdings on the website by clicking here. Positions are updated each Friday, or after the session when positions are traded.
Disclaimer
All figures contained from sources believed to be accurate. All prices stated are based on the last close price at the time of writing unless otherwise noted. Market Matters does not make any representation of warranty as to the accuracy of the figures or prices and disclaims any liability resulting from any inaccuracy.
Reports and other documents published on this website and email (‘Reports’) are authored by Market Matters and the reports represent the views of Market Matters. The Market Matters Report is based on technical analysis of companies, commodities and the market in general. Technical analysis focuses on interpreting charts and other data to determine what the market sentiment about a particular financial product is, or will be. Unlike fundamental analysis, it does not involve a detailed review of the company’s financial position.
The Reports contain general, as opposed to personal, advice. That means they are prepared for multiple distributions without consideration of your investment objectives, financial situation and needs (‘Personal Circumstances’). Accordingly, any advice given is not a recommendation that a particular course of action is suitable for you and the advice is therefore not to be acted on as investment advice. You must assess whether or not any advice is appropriate for your Personal Circumstances before making any investment decisions. You can either make this assessment yourself, or if you require a personal recommendation, you can seek the assistance of a financial advisor. Market Matters or its author(s) accepts no responsibility for any losses or damages resulting from decisions made from or because of information within this publication. Investing and trading in financial products are always risky, so you should do your own research before buying or selling a financial product.
The Reports are published by Market Matters in good faith based on the facts known to it at the time of their preparation and do not purport to contain all relevant information with respect to the financial products to which they relate. Although the Reports are based on information obtained from sources believed to be reliable, Market Matters does not make any representation or warranty that they are accurate, complete or up to date and Market Matters accepts no obligation to correct or update the information or opinions in the Reports. Market Matters may publish content sourced from external content providers.
If you rely on a Report, you do so at your own risk. Past performance is not an indication of future performance. Any projections are estimates only and may not be realised in the future. Except to the extent that liability under any law cannot be excluded, Market Matters disclaims liability for all loss or damage arising as a result of any opinion, advice, recommendation, representation or information expressly or impliedly published in or in relation to this report notwithstanding any error or omission including negligence.