Do we agree with UBS on the downgrade of some Platform providers? (AMP, IFL)
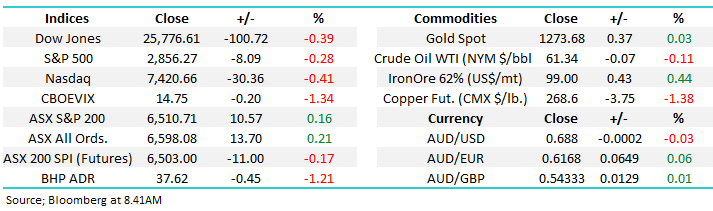
The ASX200 continues to attract solid buying as it rallied for its 6th consecutive day to close an impressive ~5% above last week’s low, many have missed the point that we were already heading up before the surprise election result, it simply added fuel to an already burning fire. Yesterdays gains were more broad based with my simple observation being there’s still no meaningful selling around. The stocks which set the market alight on Wednesday were very diverse whereas the only areas of weakness were the golds and platform providers like IOOF & AMP following a downgrade by UBS – more on that later.
The Australian and New Zealand markets continue to outperform their global peers with the NZ50 yesterday again testing all-time highs although this time it actually failed to chalk up another mark on the board. The tide of optimism around rate cuts will undoubtedly go too far as it always does but it’s a trend not worth fighting at the moment, unless of course you’re searching for some tax losses into EOFY. Interestingly we did spy a story in the AFR titled “RBA cash rate seen below 1pc”, we actually believe nobody should really want to see that happen because it’s likely to indicate the Australian economy has slipped into a meaningful recession.
The resources have struggled on a relative basis recently which hasn’t been helped by the underlying commodities feeling tired, with the exception of iron ore which again made fresh multi-year highs yesterday, this looks like one area where fund managers are taking a little $$ from the table and switching to the “under-owned” banks in particular following the Liberal victory. We are considering fading this price action at some stage due to our overweight banking position but it feels a touch early at present. Also, note Fortescue was not down 73c / 8.1% yesterday, it traded ex-dividend 60c fully franked which is likely to curtail its gains at least for a while. All things being equal, the date to keep in mind for FMG is the 1st July, which for those who bought FMG on the day they announced the special dividend (14th May) is the first trading day to sell the stock and keep the franking benefit (45 days plus day or purchase & day of sale).
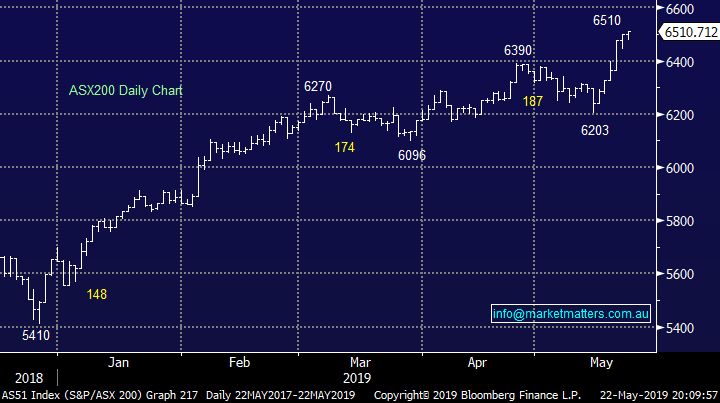
MM remains bullish the ASX200 technically while the index can hold above 6380.
Overnight US stocks fell around -0.3% with the tech based NASDAQ again the weakest off -0.4%, the SPI futures are calling the ASX200 to open down over 10-points with BHP falling over 1% in the US implying its likely to be another relatively tough day for resources.
In today’s report we have looked at the platform providers and in particular AMP Ltd (AMP) and IOOF Holdings (IFL) following a UBS report suggesting platform earnings could drop up to 30% over the next 5-years.
ASX200 Chart
MM has been “stalking” the gold sector for much of 2019 and the current pullback in some stocks, as investors flock towards high yielding equities, may slowly be presenting us with the opportunity we have been patiently waiting for.
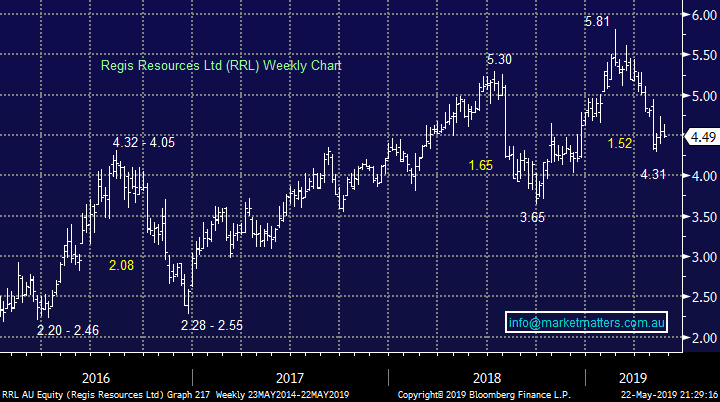
MM likes gold stocks into weakness including Regis Resources (RRL) into fresh 2019 lows.
Regis Resources (RRL) Chart
Is weakness in the Platform Providers a buying opportunity?
Following the negative research piece by UBS yesterday both heavyweights in the sector AMP (AMP) and IOOF (IFL) traded lower with IFL getting smacked over -7% with the already embattled AMP falling -2.6%. These wealth managers have been cutting fees but this remedy can only go so far and nobody doubts the trend is not pretty, the main point of discussion is how bad are things moving forward and have / are the stocks becoming simply too cheap.
Our initial impression these stocks are simply in the wrong place at the wrong time and it’s all too hard - best left alone. The wealth managers generate income from a number of areas but platforms are currently the most important contributor to their bottom line, we question whether these businesses can reinvent themselves after the trials and tribulations of recent years to grow revenue from different areas or is the more prudent approach for the investor to wait and see if they can, sounds sensible on the surface to us.
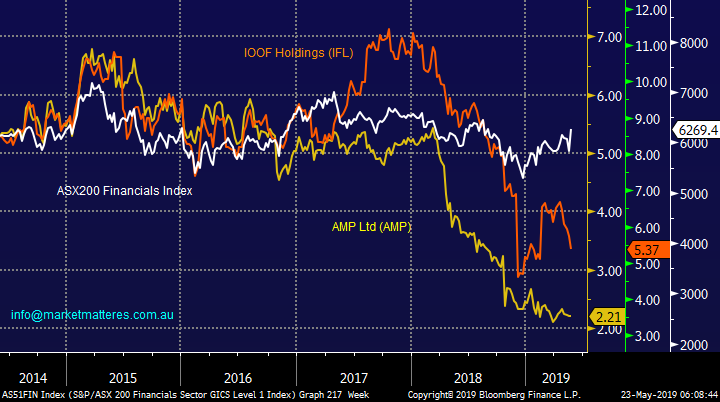
The chart below illustrates that while the Financials as an index have experienced a fairly lacklustre 5-years both AMP and IFL have been well and truly out of favour for well over 18-months. Stocks often bottom around bad news which by definition is when things look the most dire so today we’re considering whether this report may push either stock to an oversold position where decent risk / reward value emerges. We have been looking at both these stocks as potential aggressive investments of late hence the question “is UBS providing optimum entry or have they simply emphasised this red flag and we should put them back on the book shelf?”.
Today’s report is simple – do we look for a recovery in one of these “dogs” or shall we continue to ignore them. The last time we ventured into this sector was unsuccessful buying IFL at the end of 2017, before cutting it for a ~13% loss in June of 2018 at $9.10 – painful at the time but relative to todays $5.37 price tag, not a bad move.
ASX200 Financial Sector v IOOF (IFL) and AMP Ltd Chart
1 AMP Ltd (AMP) $2.21
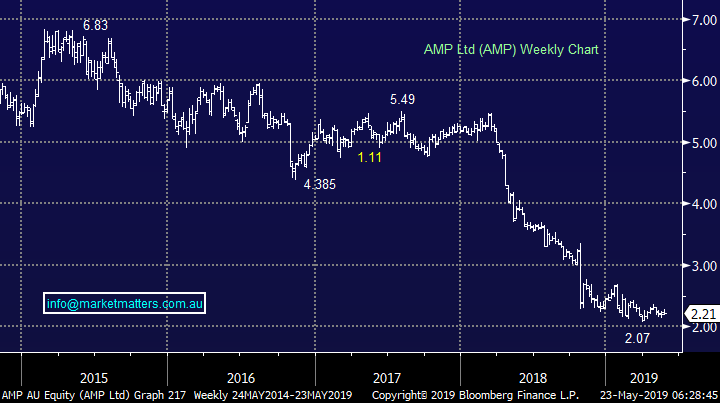
AMP had a tough start to the month following its 1st quarter report which showed outflows of $1.8bn however as the share price illustrated below shows us, investors are not expecting any good news in the short-term from this arguably dinosaur of the finance sector – scary to think that AMP traded above $29 in 1998 and has more than halved from its post GFC highs.
If you believe AMP can maintain its dividend then it can be regarded as a high risk “yield play” paying 6.3% fully franked but we have witnessed plenty of these “yield traps” over the last few years. The stock’s still trading on an Est P/E of 12x Est 2019 earnings, it simply doesn’t feel cheap enough considering the businesses performance since 2018.
Earnings per share (EPS) expectations have dropped from 37cps in June of 2018 to just 18cps today, while the projected dividend is 14.5cps.
We have tweaked our technical thoughts on AMP and anticipate rotation between $1.75 and $2.75 in the next few years making the stock only interesting below $2, or over 10% lower.
MM is neutral AMP at current levels.
AMP Ltd (AMP) Chart
2 IOOF Holdings (IFL) $5.37
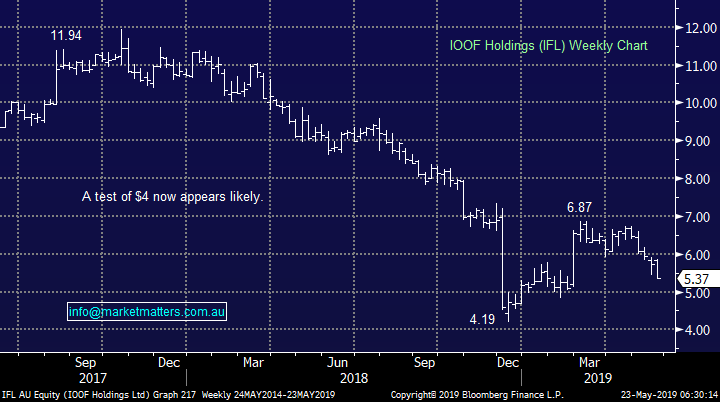
IFL was hit hard yesterday following the UBS downgrade along with an update from APRA relating to the issues in its Super Trustee business – in short, the foreseeable future for this company is looking questionable. The company has larger Funds under Administration (FUA) than AMP but with higher pricing for its platform it’s on a pedestal as a target for competition from the likes of HUB24 (HUB) & Netwealth (NWL)
Simply, a company which looks set to experience declining margins on declining volumes is not an exciting prospect.
The stock had enjoyed a bounce in 2019 in anticipation of the end being in sight to its regulatory nightmare but declining earnings is a very real headwind to any business. IFL trades on a more conservative Est P/E for 2019 of 9.8x while the projected dividend yield over the next 12 months is 10.61% fully franked – yes that’s not a typo! As the stocks next dividend approaches in August it will be interesting to see if any buying emerges as it’s a very a compelling yield story.
MM thinks there’s a strong possibility of IFL testing $4 where value should emerge.
IOOF Holdings (IFL) Chart
3 The Challengers
There are a number of newer more innovative platform players in the market place that have, in most cases, experienced strong flows disrupting the incumbents at a time when their focus is more on survival than growth.
HUB24 (HUB) has lead this second tier which also includes Netwealth Group (NWL), Praemium (PPS) & Onevue (ONV). A topic for another report.
Conclusion (s)
MM sees no reason to fight the tape and buy IOOF Holdings (IFL) or AMP Ltd (AMP) at this point in time – we will leave them alone.
Global Indices
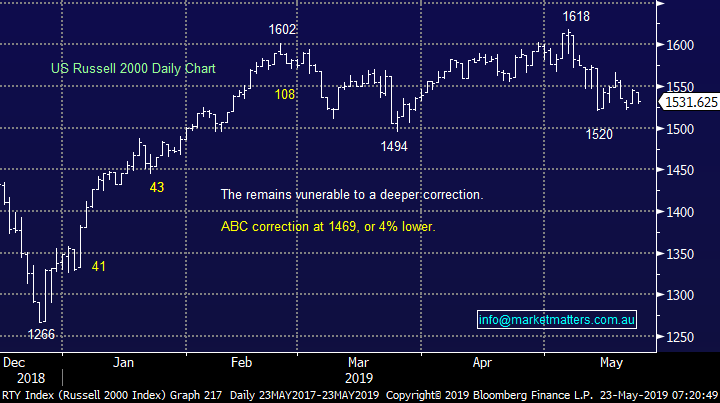
US stocks again slipped lower last night with the small cap Russell 2000 the worst performer -0.9% as trade talks continue to weigh on the market, MM’s target for this correction for the often leading Russell 2000 is now ~4% lower.
US stocks continue to feel like it’s time to be accumulating for a final push higher.
US Russell 2000 (small cap) Index Chart
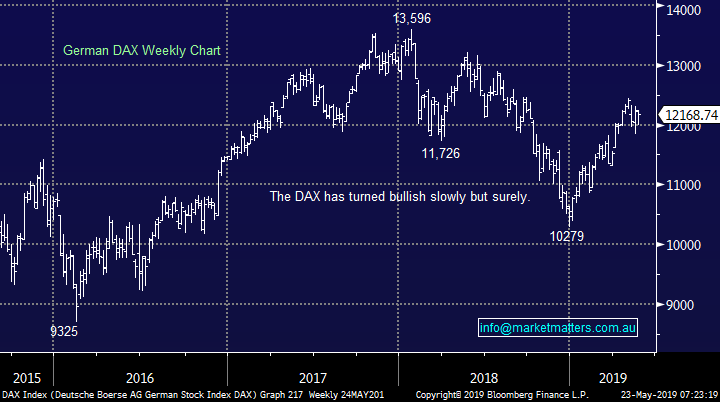
No change with European indices, we remain cautious as we’re in the “sell in May and go away” period for European stocks but the tone is improving fast.
German DAX Chart
Overnight Market Matters Wrap
· US equities fell overnight after continuing US-China trade tensions and the Fed minutes. The Dow fell 0.4%, and the S&P 500 was down 0.3%. The worst performer was the NASDAQ 100, -0.41%.
· The Fed minutes show most Fed officials believe that rates should remain on hold for some time, attributing recent weak inflation data to transitory factors that have since moderated. This meeting was held before the trade war escalated. There is more talk around the US cutting Chinese surveillance equipment firms from US tech access.
· Copper fell over 1% to a four month low and the rest of the metals on the LME also closed weak. Iron ore rallied while crude oil slid a touch on the back of increased US inventories.
· The June SPI Futures is indicating the ASX 200 to open 13 points lower this morning testing the 6500 level this morning.
Have a great day!
James & the Market Matters Team
Disclosure
Market Matters may hold stocks mentioned in this report. Subscribers can view a full list of holdings on the website by clicking here. Positions are updated each Friday, or after the session when positions are traded.
Disclaimer
All figures contained from sources believed to be accurate. Market Matters does not make any representation of warranty as to the accuracy of the figures and disclaims any liability resulting from any inaccuracy. Prices as at 23/05/2019
Reports and other documents published on this website and email (‘Reports’) are authored by Market Matters and the reports represent the views of Market Matters. The MarketMatters Report is based on technical analysis of companies, commodities and the market in general. Technical analysis focuses on interpreting charts and other data to determine what the market sentiment about a particular financial product is, or will be. Unlike fundamental analysis, it does not involve a detailed review of the company’s financial position.
The Reports contain general, as opposed to personal, advice. That means they are prepared for multiple distributions without consideration of your investment objectives, financial situation and needs (‘Personal Circumstances’). Accordingly, any advice given is not a recommendation that a particular course of action is suitable for you and the advice is therefore not to be acted on as investment advice. You must assess whether or not any advice is appropriate for your Personal Circumstances before making any investment decisions. You can either make this assessment yourself, or if you require a personal recommendation, you can seek the assistance of a financial advisor. Market Matters or its author(s) accepts no responsibility for any losses or damages resulting from decisions made from or because of information within this publication. Investing and trading in financial products are always risky, so you should do your own research before buying or selling a financial product.
The Reports are published by Market Matters in good faith based on the facts known to it at the time of their preparation and do not purport to contain all relevant information with respect to the financial products to which they relate. Although the Reports are based on information obtained from sources believed to be reliable, Market Matters does not make any representation or warranty that they are accurate, complete or up to date and Market Matters accepts no obligation to correct or update the information or opinions in the Reports. Market Matters may publish content sourced from external content providers.
If you rely on a Report, you do so at your own risk. Past performance is not an indication of future performance. Any projections are estimates only and may not be realised in the future. Except to the extent that liability under any law cannot be excluded, Market Matters disclaims liability for all loss or damage arising as a result of any opinion, advice, recommendation, representation or information expressly or impliedly published in or in relation to this report notwithstanding any error or omission including negligence.


