Checking out 3 of the ASX’s worst performers (HVN, VALE US, EVN, FLT, PPT, WHC)
The ASX200 gave back a little ground yesterday with the Consumer Discretionary Sector the weakest pocket declining 2% following Australia posting its worst jobs numbers in 19-years. The jump in the unemployment rate to 7.1% for April was higher than expected but we must be mindful that it’s a rear view mirror figure covering the peak of the virus, however there were ~700,000 more Australians working zero hours over this period who are not classified as unemployed due to government stimulus – the big question on many people’s minds is what will unfold come September when the JobKeeper is due to end. Scott Morrison and his Liberal government are certainly treading an extremely challenging path at present:
1 – The bears believe that after September unemployment will soar through 10% setting the domestic economy back on its heels with discretionary spending likely at the pointy end of the looming problem.
2 – The bulls believe the economy is improving relatively fast and assuming there’s no major secondary COVID-19 outbreak many businesses and people will be back to work by Q4 of 2020. Plus of course further fiscal / monetary stimulus appears likely as neither the current government or RBA want to be remembered as allowing a deep and painful recession on their watch.
I cover a couple of things I’ve learnt this week about the market, including the retailers in the recording below.

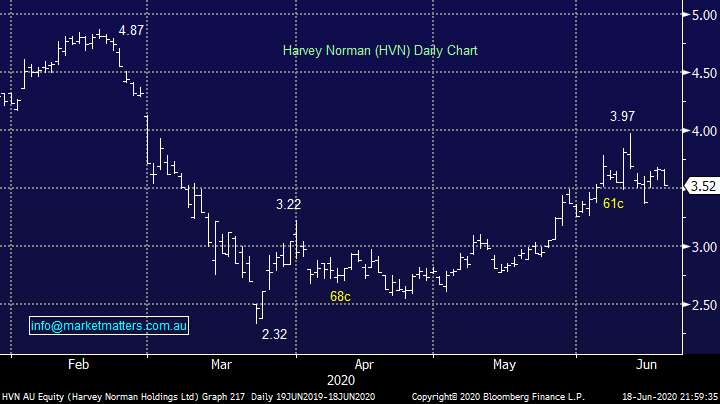
MM is not excited by the retailers after their recent rally despite sales rebounding strongly in May, believing that a lot of this ‘good news’ is built into the price e.g. Harvey Norman (HVN) has been a strong outperformer since late March rallying over 70% compared to the ASX200 which only climbed 41% yet the risks are arguably far more worrying for the sector with the debt levels of the average Australian only headed in one way during the virus outbreak.
HVN would be more interesting ~10% lower from a risk / reward perspective.
Harvey Norman (HVN) Chart
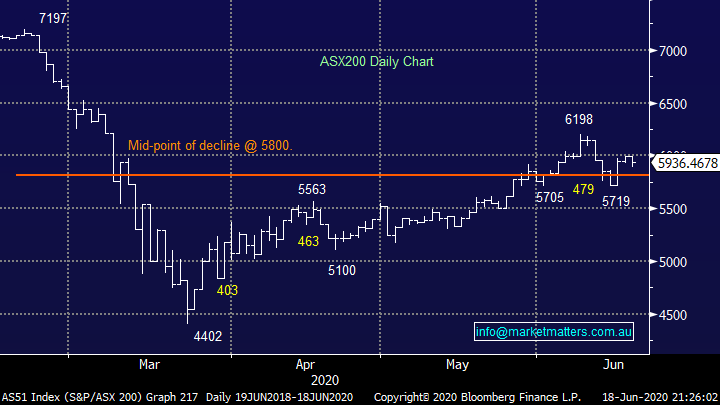
Our preferred scenario is still the current Fed induced optimism will eventually take the ASX200 above the June 6200 swing high before investors again realise, probably driven by another catalyst of news, that stocks are overvalued considering the economic risks / uncertainties which continue to lurk beneath the surface. Also, as we’ve said previously our “Gut Feel” is the next pullback will be deeper than the one this month.
MM remains bullish equities short & medium-term.
ASX200 Index Chart
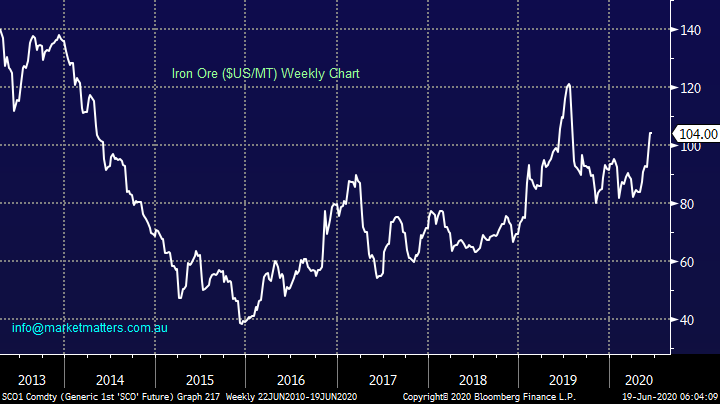
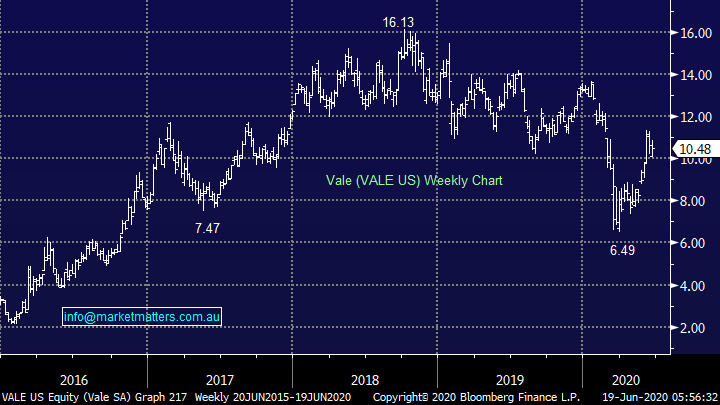
Brazilian based diversified miner Vale (VALE US) is the world’s largest producer of both iron ore and nickel, they have announced a recommencing of operations sooner than many anticipated following major COVID-19 issues plus they won’t trim back full year production guidance as many analysts thought was likely. Ultimately, we think Iron Ore is more comfortable around the ~$80-100/t area and we’ll look to position accordingly but if inflation / China does pick up over the next 12-months the surprises are more likely on the upside.
Short-term this is clearly sobering news for some of the “hot” Australian iron ore sector and its already caused Fortescue (FMG) to pullback -8.5%, on balance not enough for MM to consider buying alternatively Vale, which we hold in the MM International Portfolio, is looking good after its recent panic COVID-19 sell-off.
MM still likes iron ore stocks into weakness.
Iron Ore ($US/MT) Chart
Vale (VALE US) Chart
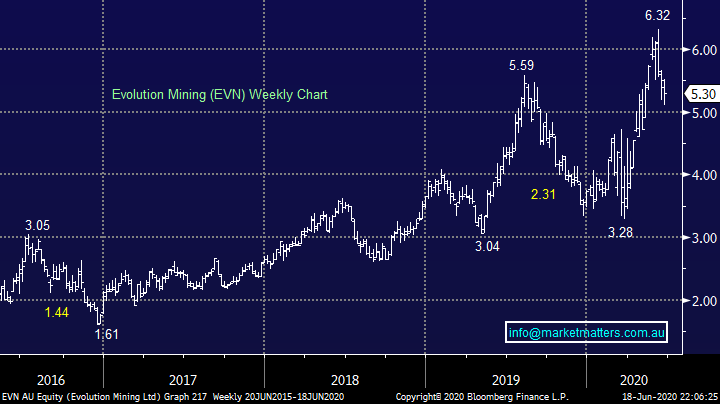
Precious metals are trading in multi-week consolidation patterns, which we feel is constructive and supportive of their long-term bull trend. However short-term we see the risk of a final washout of the large bullish position in gold before it commences another bigger rally, later in Q3 we expect new highs/breakouts in this metals complex. With a gradual decline/unwinding of the excessive speculative long position, we intend to use any weakness in the sector to establish some gold exposure. Australian stocks like Evolution (EVN) had gotten too excited in 2020 which has already led to a 19% pullback over the last month, opportunity is slowly knocking.
MM continue to look for optimum areas to start accumulating a gold position.
Evolution (EVN) Chart
Global Markets.
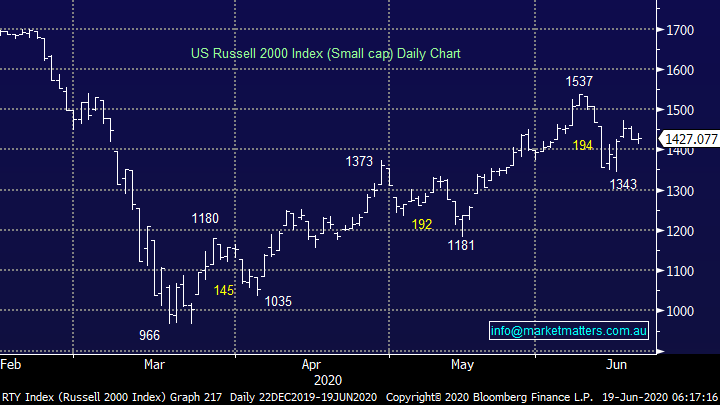
US stocks enjoyed a quiet day at the office overnight with all the major indices up or down by less than +/- 0.5%. Not surprisingly after such a quiet night there’s no change to our outlook, our preferred scenario is the small cap Russell 2000 Index can rally ~10% before it will again look too extended – importantly the ASX is very correlated to this particular index.
MM remains bullish US stocks short-term.
US Russell 2000 Index (small cap) Index Chart
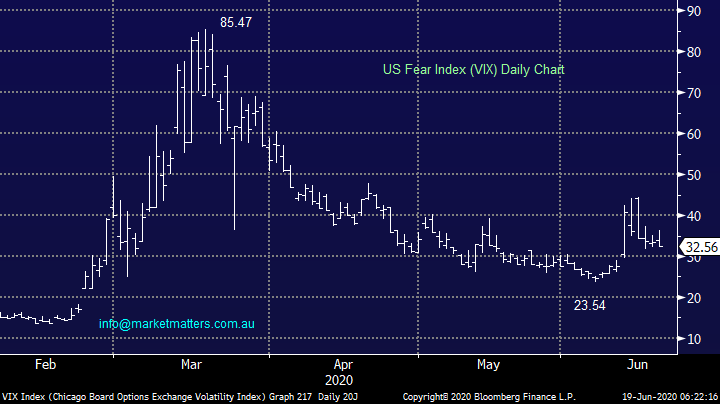
The US volatility index is becoming increasingly comfortable again with stocks, overnight it closed near its 5-week low, we can see further downside as equities grind higher but under the 30 area we feel macro traders should consider accumulation into weakness. However, at this stage the key takeout is the VIX supports our short-term bullish stance towards equities.
MM remains bullish volatility but from lower levels.
US Fear Index (VIX) Index Chart
Evaluating 3 of the recent worst performers.
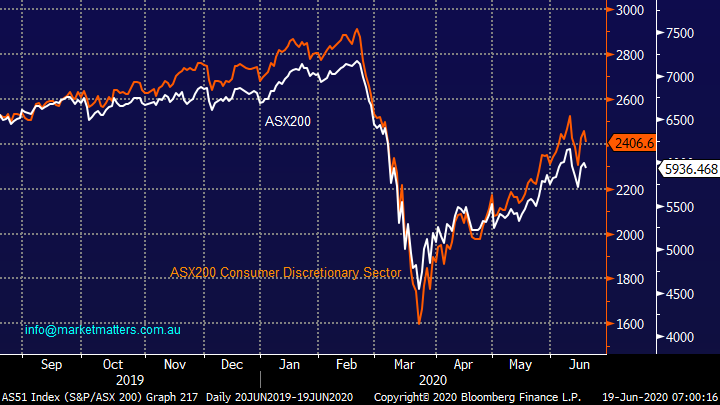
Today I’ve had a quick look at 3 of the ASX’s worst performing major stocks over the last week which caught my eye this morning, not surprisingly there’s been a large influence from the markets renewed economic & COVID-19 fears. What did surprise me was how closely the underlying index has been correlated to the proxy group of recovery stocks easily illustrated by the Consumer Discretionary Sector (e.g. Retail & Travel), both before and since the virus:
1 – The AX200 and the Consumer Discretionary Sector have been closely correlated over the last 12-months but the later has outperformed since March almost implying it would come out of the pandemic actually stronger than it went in – a big call as household debt rises.
2 – We are still bullish the broad market and expect the gap to close over the coming weeks implying this is not the time to be buying the likes of retail and tourism stocks – coincides with our fundamental view.
Short-term underperformers can reside in this naughty corner for a number of reasons from pulling back after a strong run to simply continuing to fall – either way they are always worth monitoring because most top performers sat here at one stage.
ASX200 & ASX200 Consumer Discretionary Sector Chart
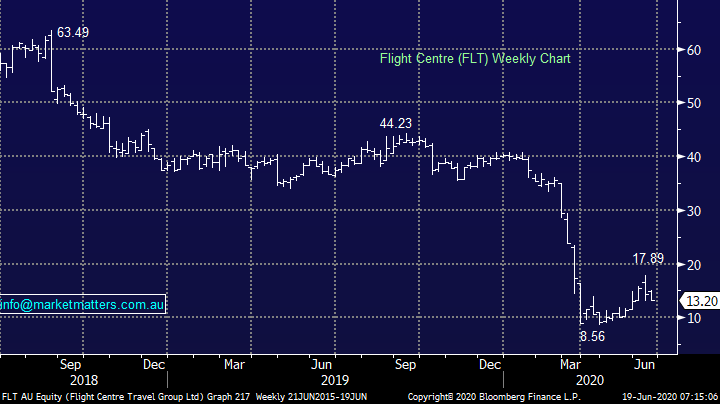
1 Flight Centre (FLT) $13.20.
FLT is down -12.6% over the last 5-days with fellow travel companies Webjet (WEB) and Corporate Travel (CTD) also coming under renewed pressure – as we alluded to earlier MM believes optimism around the economic recovery’s impact on the Consumer Discretionary stocks has gotten ahead of itself.
Travel restrictions and economic woes persist and will do so for time to come, and the stocks in this sector seem to be pricing a huge amount of renewed optimism. While the share price chart below still seems depressed, FLT issued we feel many are underestimating the dilution effect of mass capital raisings in the sector e.g. FLT effectively doubled its number of shares after its cap raise at $7.20
MM is neutral FLT at current levels.
Flight Centre (FLT) Chart
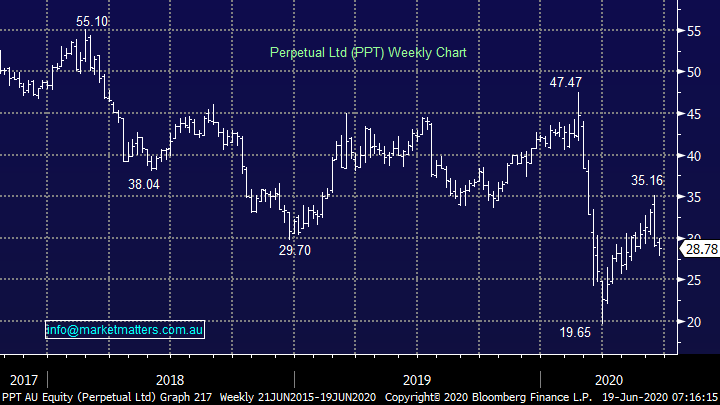
2 Perpetual (PPT) $28.78.
PPT is down -8.9% over the last 5-days and closer to 20% from its May high but we should also remember the stock has rallied strongly since its March low. Back in February the company more than satisfied the market with its 1H20 result as it lifted revenue marginally to $263.5m, we like businesses that were heading in the correct direction before the virus pandemic.
MM likes PPT into the current correction.
NB MM holds PPT in our Income Portfolio.
Perpetual (PPT) Chart
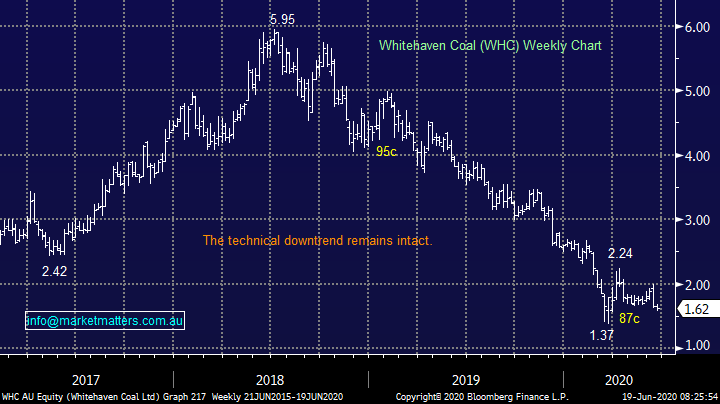
3 Whitehaven Coal (WHC) $1.62.
WHC is down -6.1% over the last 5-days which is really a continuation of the last 2-years bear trend, albeit with some decent bounces along the painful journey. We have expressed ongoing caution towards the coal sector and have refrained from “bottom picking” during the stocks demise but most businesses have a value and we like WHC into fresh 2020 lows although we acknowledge this will be an aggressive play looking for another rally of more than 50%.
MM likes WHC ~$1.30.
Whitehaven Coal (WHC) Chart
Conclusion
MM likes PPT and WHC into weakness but not FLT at this stage.
Overnight Market Matters Wrap
- The US equity markets erased its losses earlier in the session, ignoring new covid-19 numbers as focus shifted to the energy sector.
- Crude oil gained after Iraq told OPEC+ that it will fully implement its output cuts this month
- US job loss claims came in slightly ahead of expectations at 1.51m vs 1.29m.
- Over to the UK, Bank of England bond buying was raised by 100bn pounds in line with estimates.
Have a great day!
James & the Market Matters Team
Disclosure
Market Matters may hold stocks mentioned in this report. Subscribers can view a full list of holdings on the website by clicking here. Positions are updated each Friday, or after the session when positions are traded.
Disclaimer
All figures contained from sources believed to be accurate. All prices stated are based on the last close price at the time of writing unless otherwise noted. Market Matters does not make any representation of warranty as to the accuracy of the figures or prices and disclaims any liability resulting from any inaccuracy.
Reports and other documents published on this website and email (‘Reports’) are authored by Market Matters and the reports represent the views of Market Matters. The Market Matters Report is based on technical analysis of companies, commodities and the market in general. Technical analysis focuses on interpreting charts and other data to determine what the market sentiment about a particular financial product is, or will be. Unlike fundamental analysis, it does not involve a detailed review of the company’s financial position.
The Reports contain general, as opposed to personal, advice. That means they are prepared for multiple distributions without consideration of your investment objectives, financial situation and needs (‘Personal Circumstances’). Accordingly, any advice given is not a recommendation that a particular course of action is suitable for you and the advice is therefore not to be acted on as investment advice. You must assess whether or not any advice is appropriate for your Personal Circumstances before making any investment decisions. You can either make this assessment yourself, or if you require a personal recommendation, you can seek the assistance of a financial advisor. Market Matters or its author(s) accepts no responsibility for any losses or damages resulting from decisions made from or because of information within this publication. Investing and trading in financial products are always risky, so you should do your own research before buying or selling a financial product.
The Reports are published by Market Matters in good faith based on the facts known to it at the time of their preparation and do not purport to contain all relevant information with respect to the financial products to which they relate. Although the Reports are based on information obtained from sources believed to be reliable, Market Matters does not make any representation or warranty that they are accurate, complete or up to date and Market Matters accepts no obligation to correct or update the information or opinions in the Reports. Market Matters may publish content sourced from external content providers.
If you rely on a Report, you do so at your own risk. Past performance is not an indication of future performance. Any projections are estimates only and may not be realised in the future. Except to the extent that liability under any law cannot be excluded, Market Matters disclaims liability for all loss or damage arising as a result of any opinion, advice, recommendation, representation or information expressly or impliedly published in or in relation to this report notwithstanding any error or omission including negligence.


