Casting our eyes over the small end of town – Part 3 (AAD, BAL, SDA, ORE, SXL)
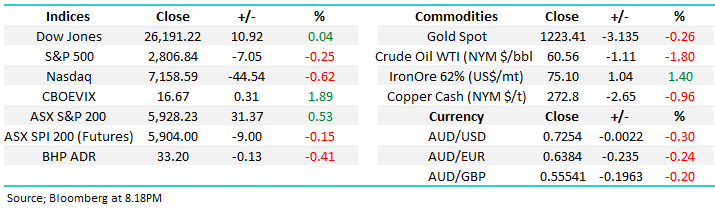
The ASX200 enjoyed a solid post US mid-terms relief rally taking it to an impressive +5.5% recovery from the 5624 low in late October. The +0.5% rally yesterday was led by solid bounces in the growth / high valuation end of town like Appen (APX) +9.4% and Afterpay Touch (APT) +11.1%, however it was the ongoing strength in the influential banking sector that added the most points to the index with CBA and Westpac both up +1.8% - NAB fell 3.6% but it traded ex-dividend 99c fully franked.
Our outlook for the local market has not waivered recently - we are still looking for stocks to continue to climb a wall of worry but our initial target of ~5925 was achieved yesterday, its now time to sit back and let the market tell us what it wants to do with only 6-weeks until Christmas.
On balance MM remains mildly bullish the ASX200 but a pullback from current levels would not surprise.
Overnight US stocks were mixed with the Dow closing marginally higher while the tech based NASDAQ was down -0.6%, the SPI futures are pointing to an open down around 10-points but with BHP down -0.4% the banks will need to remain firm for the index to remain comfortably above 5900.
Today’s report is again going to look at the bottom 20% of the ASX200 by market cap.
As we said previously opportunities are often overlooked in smaller stocks and at least one of these is likely to have a cracking 2019.
ASX200 Chart
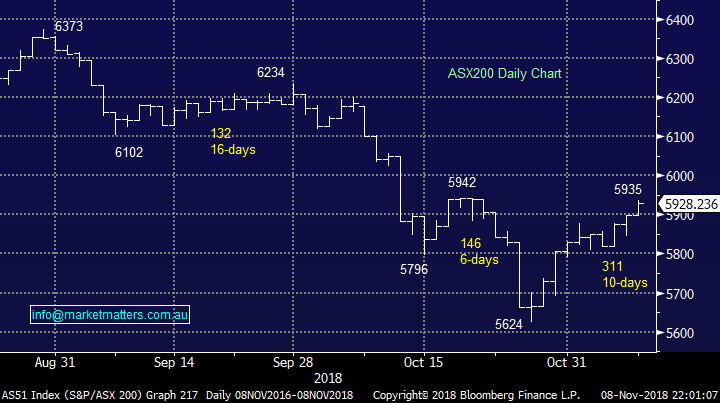
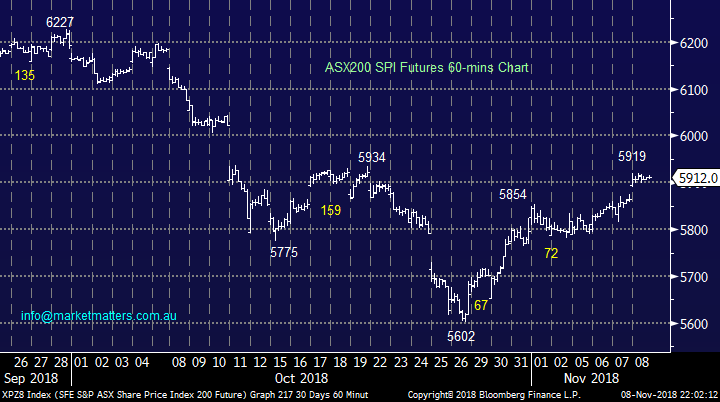
If we bore into the market short-term, by considering the December SPI futures, its easy to see the markets hit a level of previous resistance ~5925. Technically we are unsure if its time for a correction to the 317-point rally from Octobers low or if ongoing optimism will prevail i.e. time to let the market tell us what it wants to do.
NB The reason to keep a close eye on the futures at this time of year is they have the large banking dividends built into their price e.g. ANZ and Westpac later this month, following NAB yesterday.
ASX200 September SPI Futures Chart
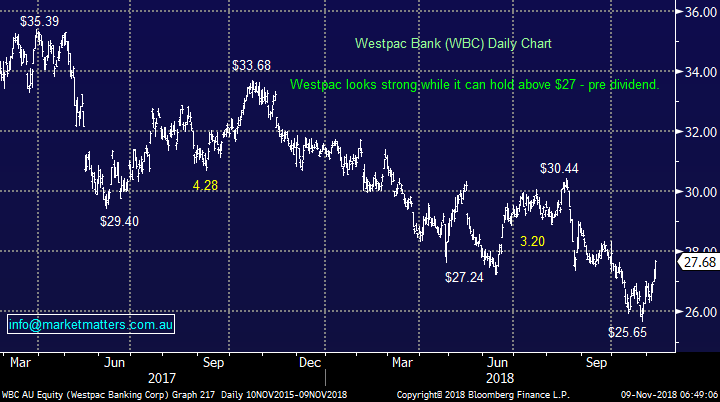
From a points perspective the backbone of the markets solid recovery from last month’s low has been the banks with leader CBA rallying $5.39, or +8.3%. We continue to believe that the banks could surprise many into 2019 and significantly outperform.
MM is bullish WBC from current levels while it can hold above $27 i.e. before it trades ex-dividend (94c fully franked) in 4-days’ time.
Westpac (WBC) Chart
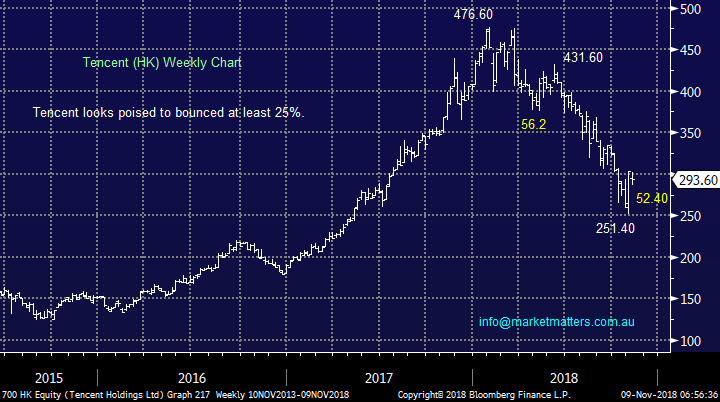
Asian powerhouse Tencent has led declines in the high valuation / growth sector, accelerating to the downside since August, taking the stocks pullback in 2018 to a huge and painful 47%.
We believe the current 20% bounce, albeit from depressed levels, should at least have another 5-10% in it.
MM likes Tencent as a business – it’s now cheap relative to its growth – we can be accumulators into weakness.
Tencent (700 HK) $HK Chart
Now it’s time to move on from the trillion dollar (HK$) global business Tencent to some of the smallest in the local ASX200.
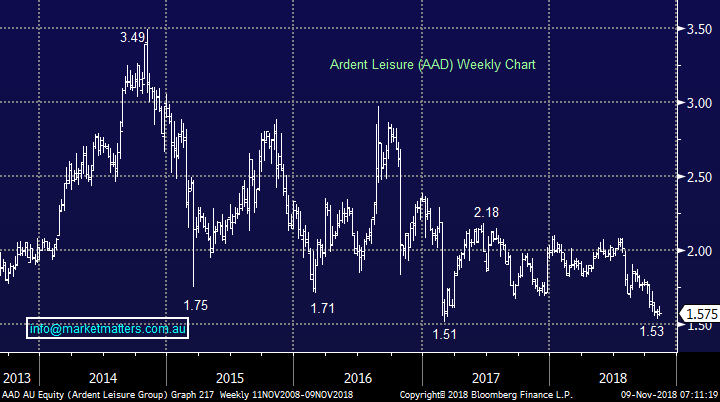
1 Ardent Leisure (AAD) $1.57
Entertainment business AAD has struggled since the multiple fatalities at its Gold Coasts Dreamworld, along with a number of management changes. The stock is now only a few % above fresh 5-year lows.
The business has decided to restructure its Australian Theme Parks and US Entertainment Centres but there’s been no material change for shareholders.
The US side of the business need to drive growth and its proving illusive at the moment.
MM is neutral AAD at present seeing no reason to catch this falling knife.
Ardent Leisure (AAD) Chart
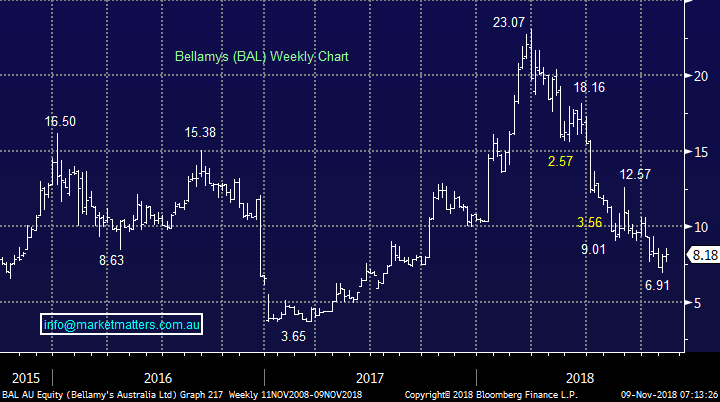
2 Bellamys Australia (BAL) $8.18
The Tasmanian owned baby formula business BAL has tumbled 70% in 2018 hurting many that tried to pick the bottom during the correction.
The escalation of the US – China trade war has put a dampener on the sector with the likes of A2 Milk and Treasury Wines (TWE) also underperforming as uncertainty rises with regard to trade and business expansion in China.
BAL now has market cap of $819m, no debt on its balance sheet and an Est P/E of 19.8x for 2019.
We like BAL into weakness but its undoubtedly an aggressive play as President Trump and China will likely determine its short-term direction / sentiment.
Bellamys Australia (BAL) Chart
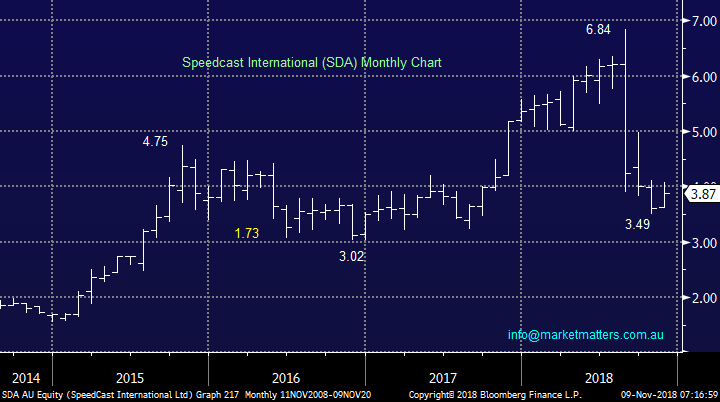
3 Speedcast International (SDA) $3.87
The satellite based communication business SDA was smashed in August following the release of its half year results and has basically not recovered since.
The results were far from a disaster but the guidance downgrade was painful for a share price containing plenty of optimism.
We feel it’s unlikely the SDA can recover until the next business update making it an almost binary investment outcome and hence not compelling risk / reward.
MM is neutral SDA
Speedcast International (SDA) Chart
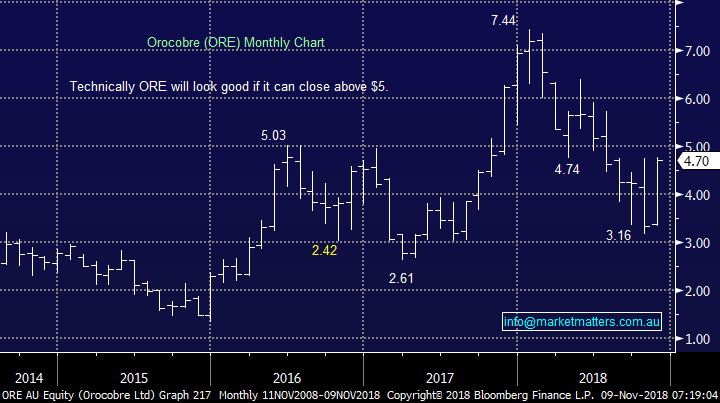
4 Orocobre Ltd (ORE) $4.70
Lithium producer ORE has been on a roller-coaster ride in 2018, similar to the whole sector.
Toyota paid the top buying into the company well above $7 to secure future lithium supply for the expanding electric car business. We have no doubt about the future demand for lithium as the electric vehicle evolution unfolds but the questions remain around the increasing supply to meet this demand.
Technically a close by ORE back above $5 will look bullish.
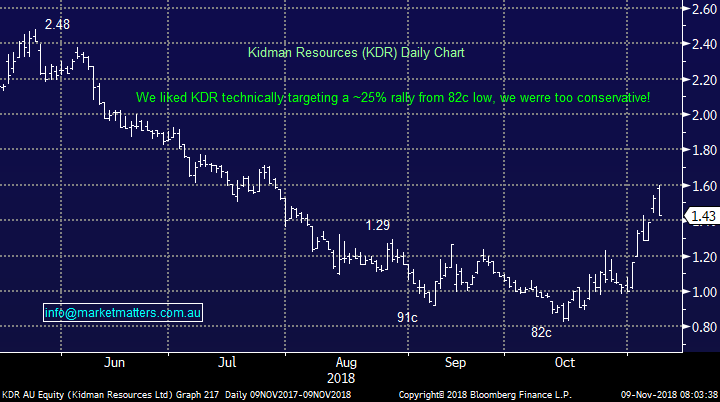
Only 2 weeks ago we identified an optimum entry into rival Kidman Resources (KDR) which subsequently almost doubled – we were way too conservative! Hence its hard to now get excited around ORE after a ~50% bounce.
We are neutral / positive ORE at current levels.
Orocobre Ltd (ORE) Chart
Kidman Resources (KDR) Chart
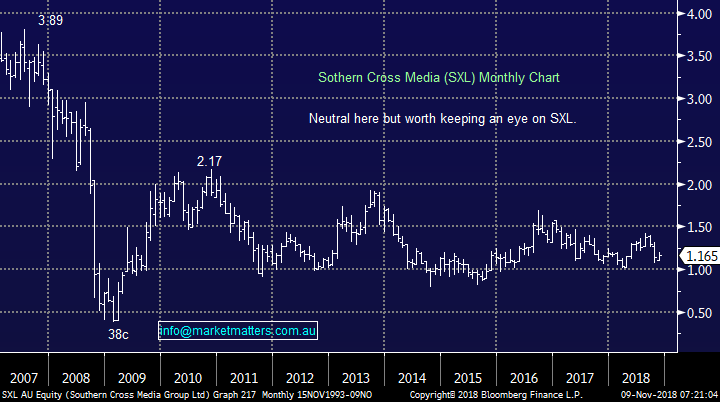
5 Southern Cross Media (SXL) $1.16
SXL has had a very boring few years simply going nowhere. The company is more of a radio play within media while having aspirations of growing into podcasting, a huge potential market moving forward.
We are watching SXL for signs of success outside of radio but we have no intention of buying into “hope”.
We are neutral SXL at present.
Southern Cross Media (SXL) Chart
Conclusion
We remain mildly bullish stocks from current levels but a period of consolidation from current levels would not surprise.
Again, nothing that floats the boat this morning from the 5 stocks looked at today,
Overseas Indices
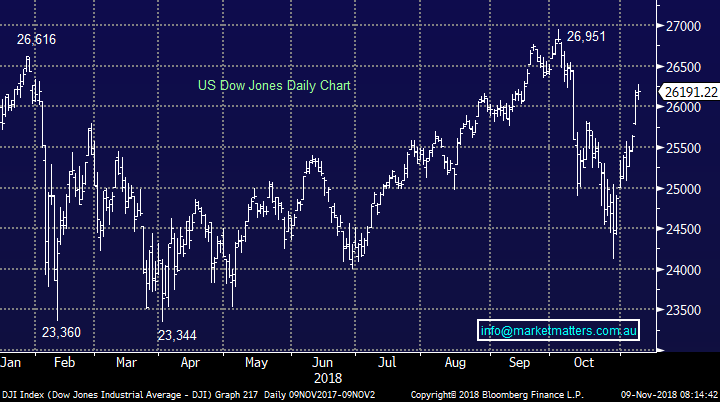
The Dow is now remarkably only 760-points / 2.9% below its all-time high compared to the tech / growth based NASAQ which is closer to 8% below its same milestone.
This variance illustrates to us that investors remain happy to lighten their growth holdings into strength.
While the Dow can hold above 25,300 we expect fresh all-time highs into 2019.
US Dow Jones Chart
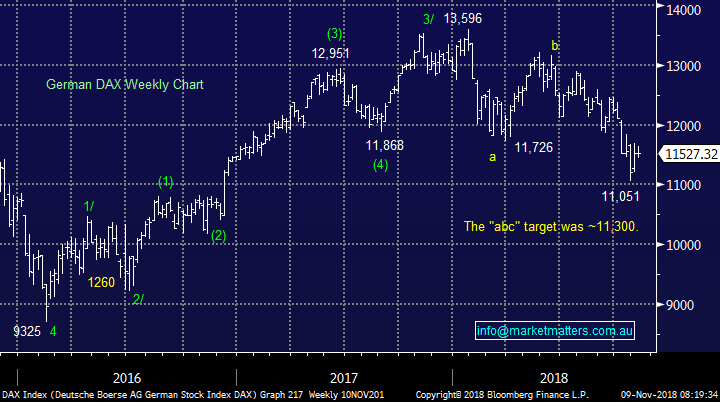
European indices are now also neutral with the German DAX hitting our target area which has been in play since January. To turn us bullish we need to see strength above 11,800.
German DAX Chart
Overnight Market Matters Wrap
· An uneventful, quiet and mixed session was experienced overnight with both the broader S&P 500 and Nasdaq 100 lower, while the Dow was marginally higher as the US Fed left its key interest rate unchanged and sees further gradual increase in the future.
· What caught our eye was the energy sector underperforming the broader market as oil prices entered a bear market, tumbling once again on fears of oversupply.
· Domestically, BHP is expected to underperform the broader market on the back of oil’s weakness and ending its US session down an equivalent of -0.41% from Australia’s previous close.
· The December SPI Futures is indicating the ASX 200 to open 12 points lower, testing the 5915 level this morning.
Have a great day!
James & the Market Matters Team
Disclosure
Market Matters may hold stocks mentioned in this report. Subscribers can view a full list of holdings on the website by clicking here. Positions are updated each Friday, or after the session when positions are traded.
Disclaimer
All figures contained from sources believed to be accurate. Market Matters does not make any representation of warranty as to the accuracy of the figures and disclaims any liability resulting from any inaccuracy. Prices as at 09/11/2018
Reports and other documents published on this website and email (‘Reports’) are authored by Market Matters and the reports represent the views of Market Matters. The MarketMatters Report is based on technical analysis of companies, commodities and the market in general. Technical analysis focuses on interpreting charts and other data to determine what the market sentiment about a particular financial product is, or will be. Unlike fundamental analysis, it does not involve a detailed review of the company’s financial position.
The Reports contain general, as opposed to personal, advice. That means they are prepared for multiple distributions without consideration of your investment objectives, financial situation and needs (‘Personal Circumstances’). Accordingly, any advice given is not a recommendation that a particular course of action is suitable for you and the advice is therefore not to be acted on as investment advice. You must assess whether or not any advice is appropriate for your Personal Circumstances before making any investment decisions. You can either make this assessment yourself, or if you require a personal recommendation, you can seek the assistance of a financial advisor. Market Matters or its author(s) accepts no responsibility for any losses or damages resulting from decisions made from or because of information within this publication. Investing and trading in financial products are always risky, so you should do your own research before buying or selling a financial product.
The Reports are published by Market Matters in good faith based on the facts known to it at the time of their preparation and do not purport to contain all relevant information with respect to the financial products to which they relate. Although the Reports are based on information obtained from sources believed to be reliable, Market Matters does not make any representation or warranty that they are accurate, complete or up to date and Market Matters accepts no obligation to correct or update the information or opinions in the Reports. Market Matters may publish content sourced from external content providers.
If you rely on a Report, you do so at your own risk. Past performance is not an indication of future performance. Any projections are estimates only and may not be realised in the future. Except to the extent that liability under any law cannot be excluded, Market Matters disclaims liability for all loss or damage arising as a result of any opinion, advice, recommendation, representation or information expressly or impliedly published in or in relation to this report notwithstanding any error or omission including negligence.


