Can we see any value in the 5 shockers from yesterday? (BHP, BSL, RSG, A2M, ILU, NEA, BXB, EHL)
The ASX200 is trading like it’s on steroids, it rallied significantly more than I expected on Tuesday only to totally reverse all the good work yesterday. The market fell almost 1% with over 60% of the index closing in the red but the action under the hood was the most eye catching with reporting season making a 5% swing by stocks in the spotlight feel almost boring, plus just for good measure iron ore plunged to its lowest level since mid-May. Today brings forth some more heavyweights to the reporting stage including QANTAS (QAN), Coles (COL), Mineral Resources (MIN) Flight Centre (FLT), Perpetual (PPT), South32 (S32) & Bingo Industries (BIN), expect further volatility on the stock level. Reporting calendar available here. I cover Initial thoughts here on:

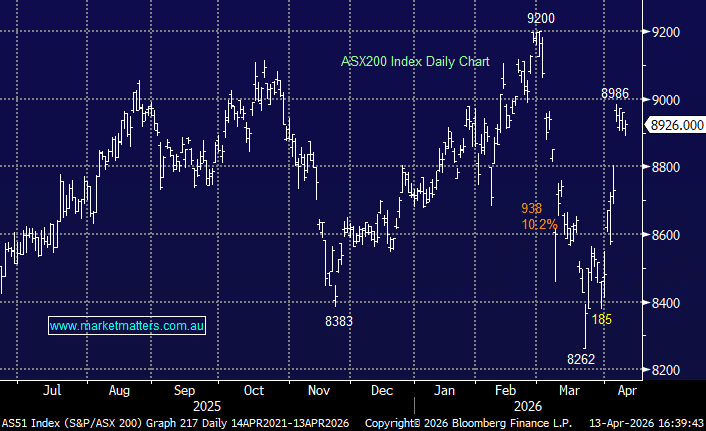
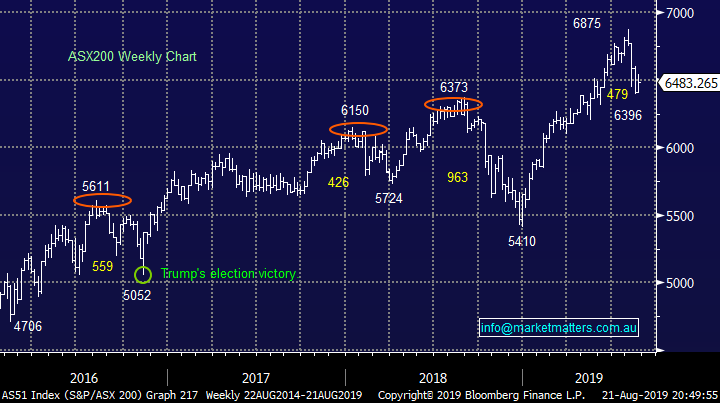
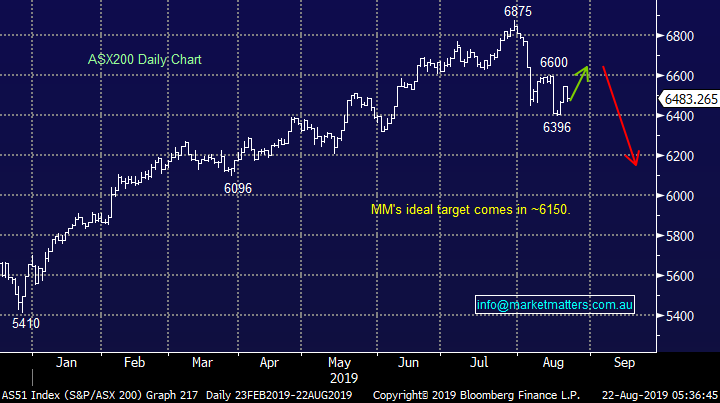
The markets actually chopping around as we would expect for a period of consolidation after an aggressive decline. MM believes the market is in classic “buy weakness and sell strength for the traders”, it’s certainly feeling uncomfortable at the respective extremes e.g. it would have been hard to sell the strength on Tuesday afternoon, similarly to buy weakness yesterday would have challenged many players “Fear & Greed” psychology. If we are correct the ASX200 is going to continue its volatile path back up towards the 6600 area.
Yesterday MM followed the uncomfortable path buying BHP Group (BHP) for the Growth Portfolio and Abacus Property (ABP) for the Income Portfolio, fingers crossed fortune favours the brave with these purchases. I reiterate that MM intends to adopt a more conservative stance if / when the ASX200 reaches the 6600-area through a combination of increased cash levels, re-entering the gold sector and considering the leveraged bearish ETF (BBOZ).
MM remains comfortable adopting a conservative stance towards equities, especially around the 6600 area.
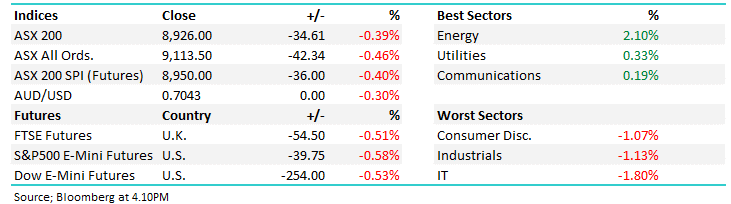
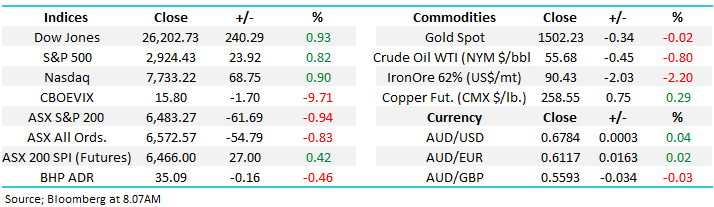
Overnight US stocks rallied solidly with the Dow advancing 240-points, a good performance as the Fed minutes weren’t overly dovish although some board members did want the latest rate cut to be 0.5%, as opposed to the 0.25%. The SPI futures are calling the ASX200 to open up close to 30-points, or 0.5%. For our market to perform strongly a bounce in the iron ore price feels required.
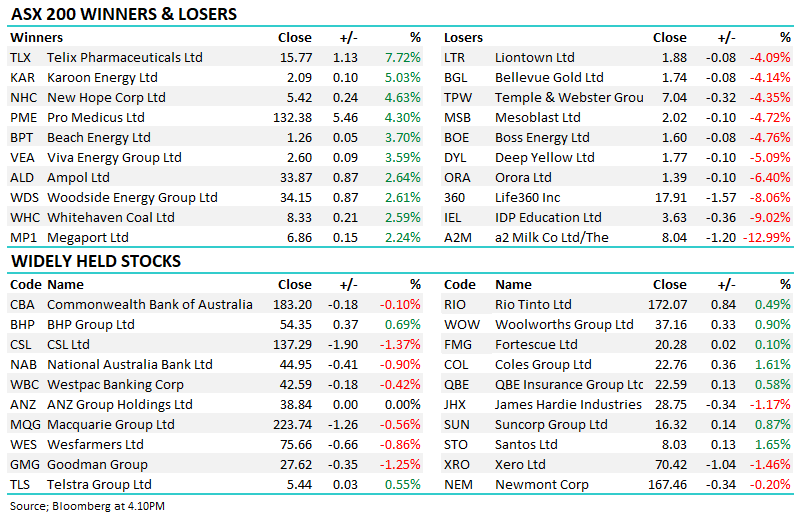
Today we are going to look at the 5 stocks which were thumped between 9% and 13% yesterday with an eye on whether we believe the markets got it wrong.
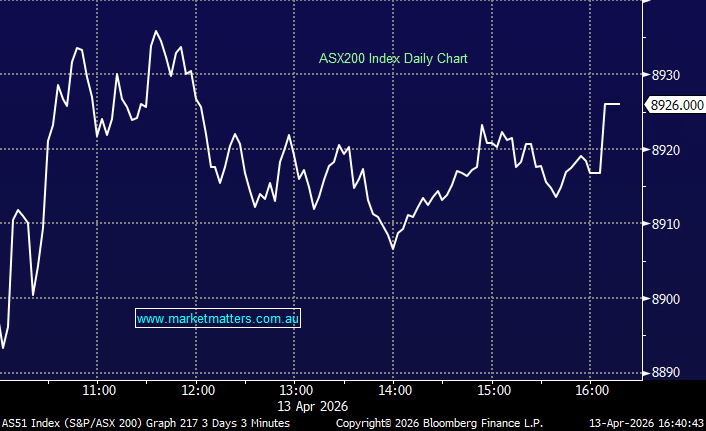
ASX200 Chart
It’s nice when things go according to plan with investing, it’s important to enjoy them because the market will undoubtedly fight back, again and again.
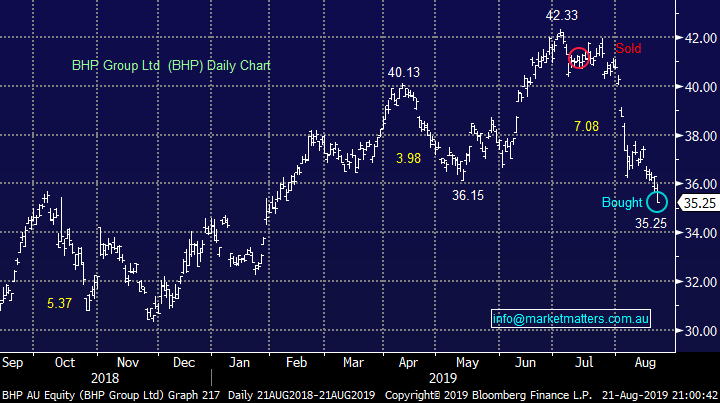
1 – MM sold BHP around $41 in July and have now re-entered around $35.60, over 13% lower in 6-weeks, just in time for the US78c fully franked dividend in early September.
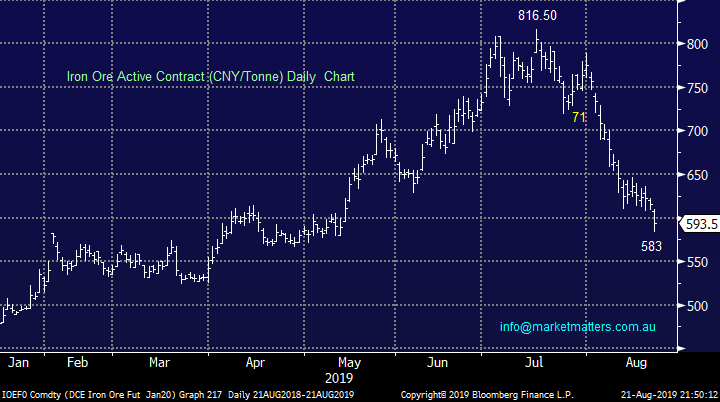
We felt the optimism towards the iron ore stocks was way too elevated in early July but similarly the current aggressive selling in the sector feels like its gone too far as iron ore experiences an inevitable pullback i.e. the bulk commodity has corrected over 28% dragging with it the leveraged play Fortescue Metals (FMG) by basically the same degree but interestingly FMG has been outperforming iron ore over the last few weeks.
We are looking for a ~15% bounce by iron ore which should support the sector / market.
BHP Group Ltd (BHP) Chart
Iron Ore (CNY/Tonne) Chart
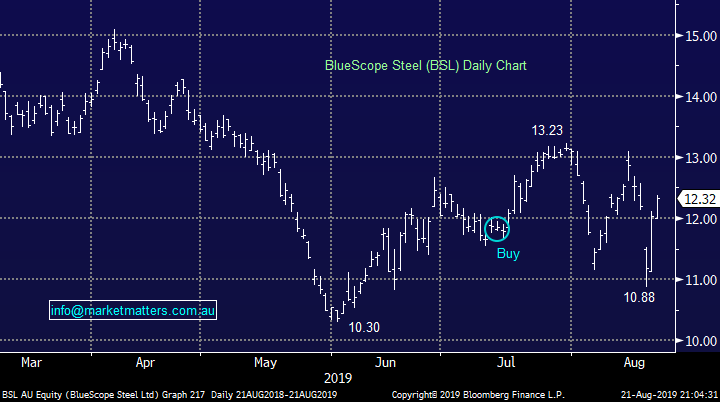
2 – In July around the same time when we sold BHP we allocated money into BlueScope Steel (BSL), a position that’s now showing a small profit after a very volatile few weeks. This is a great example of a stock aggressively reversing its initial move on the day it reported – essentially what we are looking for with the 5 stocks focused on in today’s report.
MM is initially targeting the $13.50 area for BSL at this point in time, or 10% higher.
BlueScope Steel (BSL) Chart
Interestingly the gold sector failed to garner a bid tone yesterday even as stocks were sold aggressively, this supports 3 of our short-term views on the market:
1 – The market remains caught long the local gold sector.
2 – Stocks have further room on the upside before we should become more defensive.
3 – Our targeted areas to commence accumulating the Australian gold sector remain realistic and even potentially too conservative.
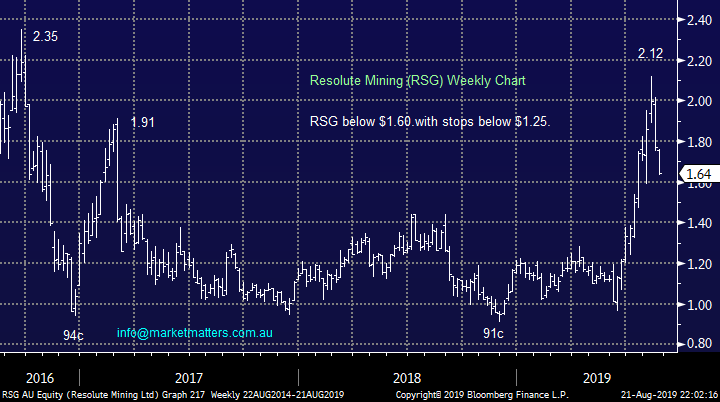
MM now likes RSG below $1.60.
Resolute Mining (RSG) Chart
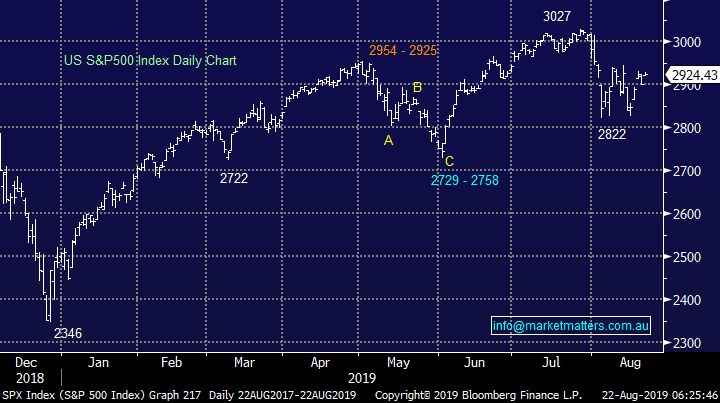
No change in our opinion for US stocks: “MM believes we have entered a new short-term cycle for US stocks where bounces should be sold for the active trader” this continues to feel on the money with the S&P500 now close to a fresh 2-week high.
Our medium-term target for this market correction is around 6% lower, we feel it remains an ideal time to be an active investor, after a bull market lasting over a decade simply buying and holding carries some risks from purely a statistical perspective e.g. a2 Milk (A2M) yesterday.
Our initial target for this down leg by US stocks is ~6% lower.
US S&P500 Chart
Reviewing the 5 stocks smacked yesterday
The ASX200 remains in tune with our short-term outlook for stocks i.e. a choppy correction to the 479-point decline from its all-time high achieved at the end of July.
MM believes equities are bouncing for another selling opportunity.
Today we are scouring the underperformers for opportunities for a quick turnaround story which could rally even in a falling market, similar to BlueScope Steel (BSL).
ASX200 Chart
Today we have briefly looked at the 5 stocks well and truly thrown into the “naughty corner” after reporting their sins to the market yesterday.
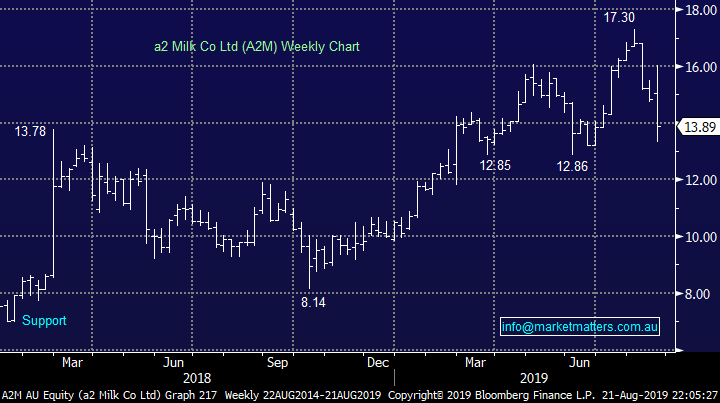
1 A2 Milk (A2M) $13.89
Previous market darling A2M tumbled -13.2% yesterday as the company’s sales increase of 41.4% dropping to a 47% lift in profits – although it wasn’t enough to meet the markets strong expectations. The combination of a 3% miss to Net Profit after Tax (NPAT) and growth for next year appearing closer to 10% as opposed to 20% brought the sellers out to play.
Another classic example of a great company but at what price, the stocks now corrected ~20% from its 2019 high, significantly more than the market. Following yesterdays decline the stocks now trading on an Est P/E for 2020 of 31x not a scary level for a growth stock but the question is have we seen the best of A2M. Consider yesterday’s comment from company boss Jayne Hrdlicka “the easy revenue gains made in Australia and via daigou shoppers are a thing of the past and the milk and baby formula maker is building capacity for the long haul in China”. Sounds to me like lower growth for longer and the 48m shorts in the stock had a day in the sun yesterday.
The company delivered on its 2019 full year guidance but clearly analysts had become way too optimistic and with an estimated 20% of its sales through small daigou traders I ponder if the grounded and impressive boss is setting the correct conservative tone.
MM is neutral A2M at present.
A2 Milk (A2M) Chart
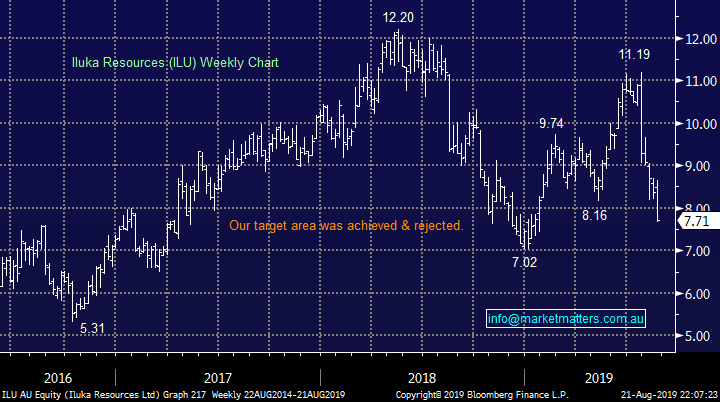
2 Iluka (ILU) $7.71
Mineral sands operator ILU was sold off another -10.6% yesterday, taking its recent decline to a painful 31% - a stocks MM sold at $10.59 for a +20% profit at the start of July. Yesterdays half-year result showed a revenue fall of over 10% to $545.6m, the continuing trade war between the US and China looks to be creating some issues for their market. Also, the company cut its dividend in half in an attempt to address its increasing debt levels.
Clearly an average result for an extremely volatile stock, we actually wouldn’t be surprised to see the aggressive downside momentum take the stock well under $7 hence we have no interest catching this falling knife just yet.
MM can see ILU trading below $7.
Iluka (ILU) Chart
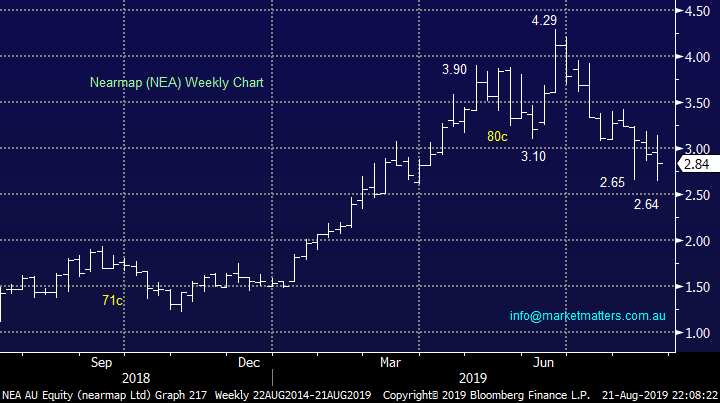
3 Nearmap Ltd (NEA) $2.84
Aerial imagery business NEA fell -9.6% yesterday after its full-year update showed a loss of almost $15m, although the main negative in the result was the slowing growth rates across the business.
This is a tough company to value at present and one where we turn to the technicals which have been working well recently after generating sell signals around the $4 area. We can see the stock trading between $2.60 and $3.50 short-term making it decent risk / reward just here
MM is neutral / positive NEA.
Nearmap Ltd (NEA) Chart
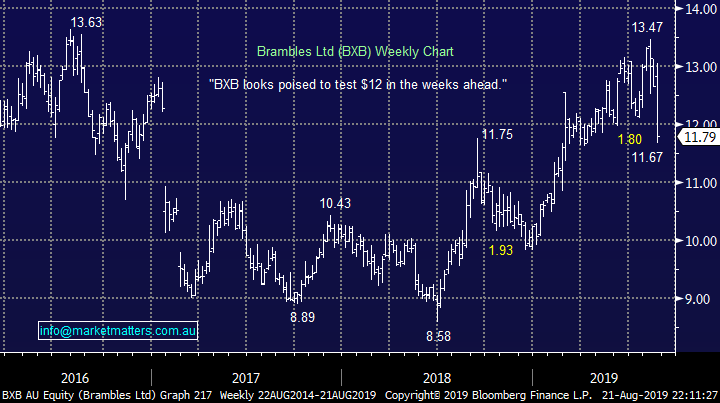
4 Brambles (BXB) $11.79.
Pallet and logistics business BXB fell -9.4% yesterday, definitely not helped by the CEO warning of a slowdown in Europe, not just because of BREXIT, and that a fallout from the US-China trade war was also restraining growth with “possible wider contagion” on the horizon.
The companies result was messy due to the sale of its crate pooling business but the “new BXB” implied low single digit growth as their NPAT came in at $US454m, I believe the comments did the most damage to the share price.
Technically we have been bearish BXB and I left our previous annotation on the chart below, technically from here we could be buyers with stops under $11 but the fundamentals don’t excite at present.
MM is neutral BXB.
Brambles (BXB) Chart
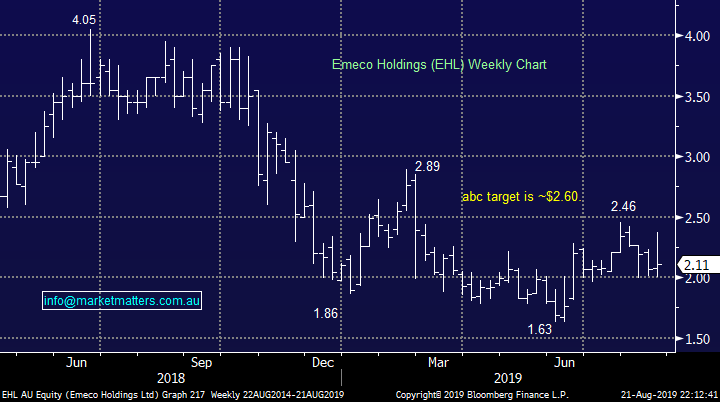
5 Emeco Holdings (EHL) $2.11.
Yesterday EHL has surrendered much of its recent gains as it continues to move like a geared form of the ASX200. Hence if we are correct and the ASX200 is bouncing before another leg down it potentially will provide a better opportunity for MM to take a profit in this volatile beast.
The reaction to the result yesterday was a perplexing one with the stock down 9%. It had rallied strongly into the result and the drop yesterday simply takes the stock back to prices seen last Friday, however I’ve thought about this one the most overnight, with the obvious question, what did we miss?
EBITDA was better than guidance plus better than mkt expectations, profit was inline, gearing better, guidance okay. When compared to the 1H19 result which was a miss + it contained many moving parts that made it difficult to establish how the underlying core business was travelling, the full year numbers rectified this. Yesterday we can see that all key operational metrics are trending in the right direction – robust top-line and earnings growth vs. pcp, rising margins (up from 40.2% to 46.1%), increasing utilisation (up from 58% to 64%), improving leverage (now down to 2.0x net debt / EBITDA from 2.6x in FY18 – we believe it can hit its target of 1.0x in FY21), and ROE an impressive >35%.
Perhaps it was the lack of specific earnings guidance other than “additional growth in revenue and earnings in FY20, albeit with a greater weighting to earnings in 2H20” (buried in the Annual Report rather than preso pack and ASX release) which may have spooked the market.
While we’re not panicking on our holding, yet – I’m always conscious that the market / price action often knows best!
MM is considering taking profit on EHL around 5-10% higher.
Emeco Holdings (EHL) Chart
Conclusion (s)
Unfortunately MM sees no clear fresh opportunities from the 5 stocks looked at today.
Global Indices
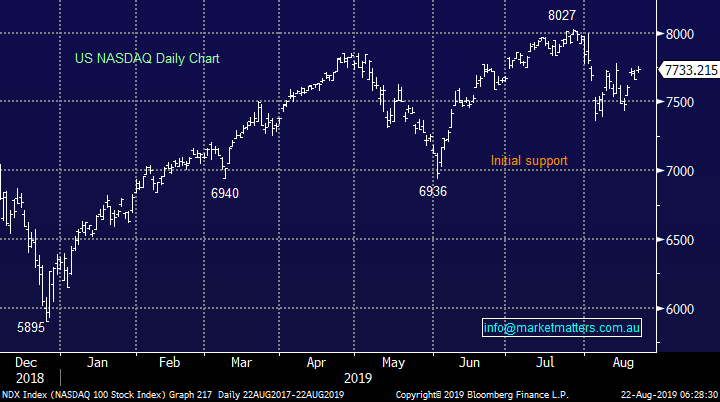
We believe US stocks are now bearish short-term as we touched on earlier, the tech based NASDAQ’s initial resistance is close at hand.
US stocks have generated technical sell signals.
US NASDAQ Index Chart
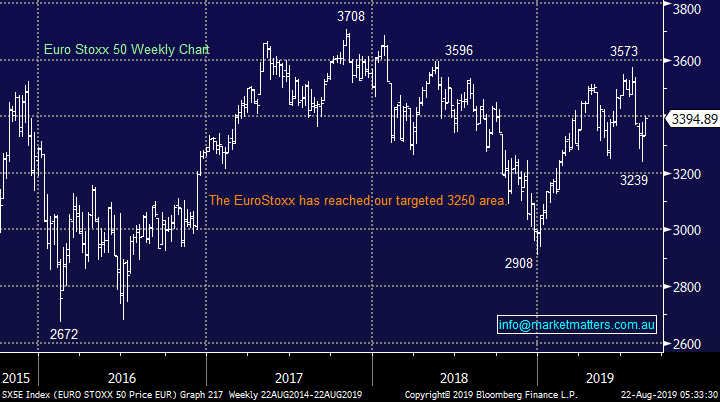
No change again with European indices, while we remain cautious European stocks as their tone has becoming more bearish over the last few months, however we had been targeting a correction of at least 5% for the broad European indices, this has now been achieved.
The long-term trend is up hence “short squeezes” might be harder and longer than many anticipate.
Euro Stoxx 50 Chart
Overnight Market Matters Wrap
· The US equity markets recovered further from its recent losses following the Fed Reserve minutes revealing some governors were keen to cut its key interest rate by 0.50%, with investors now in hopes that further rate cuts are imminent to assist with the current economic slowdown.
· Commodities continue to remain mixed. Iron ore slumped, now trading 35% below its recent highs with BHP expected to underperform against the broader market after ending its US session off an equivalent of 0.46% from Australia’s previous close.
· The September SPI Futures is indicating the ASX 200 to open 31 points higher, testing the 6515 level this morning on the busiest day of corporate earnings, including CCL, COL, DOW, FLT, MPL, PPT, QAN, S32 and STO.
Have a great day!
James & the Market Matters Team
Disclosure
Market Matters may hold stocks mentioned in this report. Subscribers can view a full list of holdings on the website by clicking here. Positions are updated each Friday, or after the session when positions are traded.
Disclaimer
All figures contained from sources believed to be accurate. All prices stated are based on the last close price at the time of writing unless otherwise noted. Market Matters does not make any representation of warranty as to the accuracy of the figures or prices and disclaims any liability resulting from any inaccuracy.
Reports and other documents published on this website and email (‘Reports’) are authored by Market Matters and the reports represent the views of Market Matters. The Market Matters Report is based on technical analysis of companies, commodities and the market in general. Technical analysis focuses on interpreting charts and other data to determine what the market sentiment about a particular financial product is, or will be. Unlike fundamental analysis, it does not involve a detailed review of the company’s financial position.
The Reports contain general, as opposed to personal, advice. That means they are prepared for multiple distributions without consideration of your investment objectives, financial situation and needs (‘Personal Circumstances’). Accordingly, any advice given is not a recommendation that a particular course of action is suitable for you and the advice is therefore not to be acted on as investment advice. You must assess whether or not any advice is appropriate for your Personal Circumstances before making any investment decisions. You can either make this assessment yourself, or if you require a personal recommendation, you can seek the assistance of a financial advisor. Market Matters or its author(s) accepts no responsibility for any losses or damages resulting from decisions made from or because of information within this publication. Investing and trading in financial products are always risky, so you should do your own research before buying or selling a financial product.
The Reports are published by Market Matters in good faith based on the facts known to it at the time of their preparation and do not purport to contain all relevant information with respect to the financial products to which they relate. Although the Reports are based on information obtained from sources believed to be reliable, Market Matters does not make any representation or warranty that they are accurate, complete or up to date and Market Matters accepts no obligation to correct or update the information or opinions in the Reports. Market Matters may publish content sourced from external content providers.
If you rely on a Report, you do so at your own risk. Past performance is not an indication of future performance. Any projections are estimates only and may not be realised in the future. Except to the extent that liability under any law cannot be excluded, Market Matters disclaims liability for all loss or damage arising as a result of any opinion, advice, recommendation, representation or information expressly or impliedly published in or in relation to this report notwithstanding any error or omission including negligence.