Can we find a diamond in the rough – Part 2 (XRO, VOC, CGF, NUF, OML)
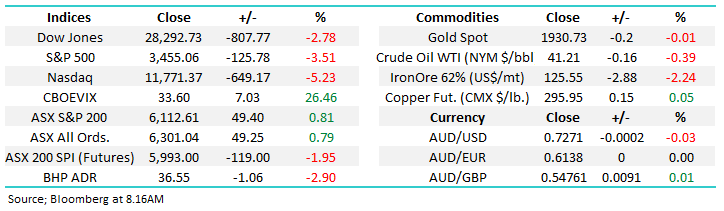
September’s roared out of the gates when it comes to volatility, so far we’ve seen down 107, up 110 and yesterday up 49-points, that’s an average daily move of almost 1.5% - todays set to be at the top end of 3. It’s harder than playing 2-up trying to pick where this market is going day to day, however we still like the view of de-risking into strength through 6200 while accumulating around 5700, although as we’ve basically been fully committed to stocks since March it would be hard to accumulate much!
Yesterday’s rally was solid considering it built on strong gains from Wednesday, over 65% of the stocks closed up with the outperforming IT Sector remaining a touch tired and the safety of gold losing some lustre as the $US fights to regain some of its recent lost ground, just a short-term countertrend bounce in our opinion – the IT Sector picked the overnight US move perfectly. The stocks that rallied strongly were a mixed motley crew which contained a number of definite laggards of late, as we alluded to yesterday MM doesn’t believe this is an ideal time to chase the hot stocks / sectors. As opposed to the often touted “stock rotation” I feel we’re currently in the early stages of some market “quality rotation” where it’s in with the bad and out with the good!
Hopefully that makes sense to readers, it doesn’t matter how good a company / business is its still got a fair price and likewise if a stock becomes too out of favour the elastic band of valuation goes too far in the cheap direction, we are simply seeing some profit taking in the high flyers with some of the funds finding its way into the underperformers of 2020 – not a trend that we believe will last months but it can be exploited by the Active Investor as we touched on yesterday as recoveries can be short and sharp. I wrote that last night, with the NASDAQ plunging -5.2% this morning we might see an unravel on the sell side with a bang as opposed to a more sedate a roll over.
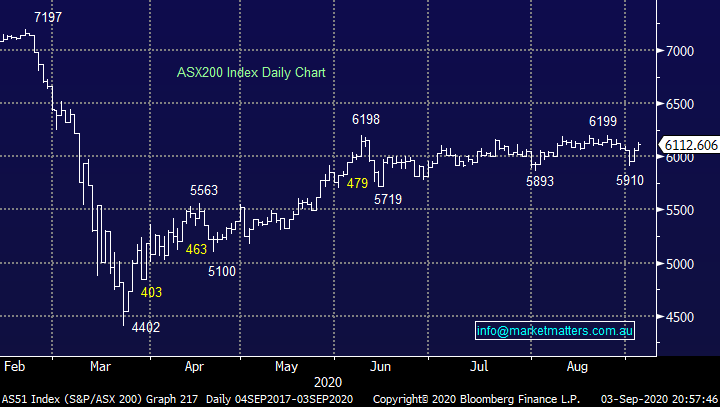
MM remains bullish the ASX200 medium term.
ASX200 Index Chart
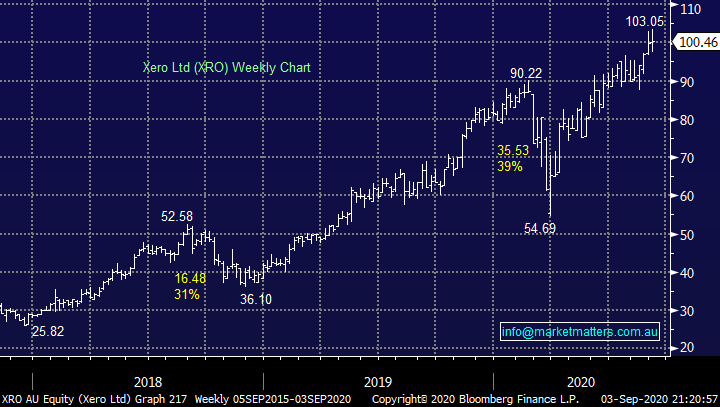
Following Xero (XRO) founder Rod Drurys Wednesday night $200m sell down of shares we saw another $100m block trade yesterday morning at $99.96. It was a solid performance to see the cloud computing software giant, which is already up 30% for the year, manage to close above $100 however it has created a little question around our holding. Although we don’t believe there’s any very bad news around the corner the point is it feels unlikely the company will knock it out of the park when it faces investors in November, plus as we all know it’s not a cheap stock on traditional metrics.
It’s no great surprise some people are taking some money off the table, we’ve been considering it ourselves. Following these 2 significant sell downs we feel it’s unlikely we’ll see any major appreciation by the stock for at least a few months, last night’s move in the US will be a real test today.
MM is considering taking some $$ from Xero (XRO).
Xero (XRO) Chart
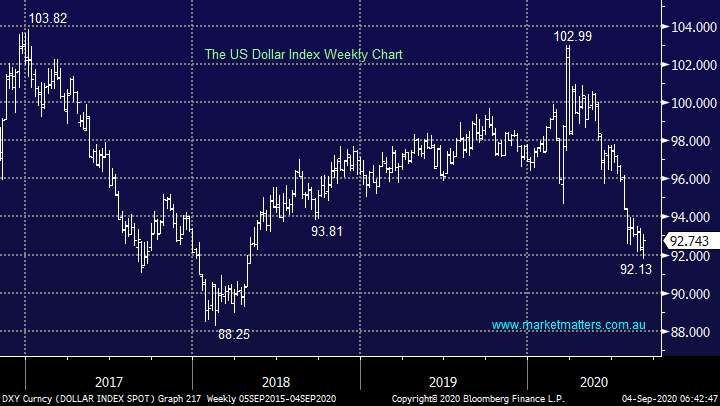
The $US is bouncing as we flagged over the last fortnight, if we are correct the greenback is about half-way through its recovery, our ideal target is ~94 which should present some opportunities in the commodities space:
1 – A test of the 94 area is likely to see another test on the downside for the likes of precious metals, oil, copper etc – our intention is to increase our gold / silver exposure across our portfolios if this unfolds.
2 – Conversely a final leg down towards the 90 area will likely see us lighten some positions in precious metals, my best guess is gold will be ~US2,200 when / if this occurs.
However, in a very similar scenario as the ASX200 patience remains an important virtue.
MM is a keen seller of the $US around the 94 area.
The $US Index Chart
Overseas Indices & markets
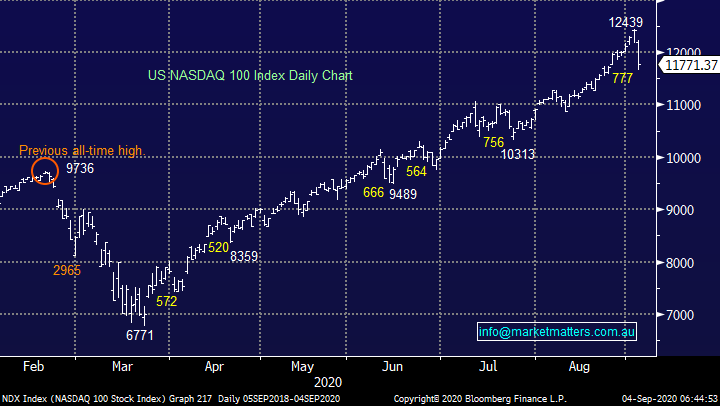
Overnight US stocks were clobbered as the mega-cap tech stocks drove the market to its biggest fall since March – ouch! When the likes of Apple are down 8% and Microsoft 6.2% the US market is going to endure a tough session and that’s exactly what unfolded overnight. At this stage we see nothing more sinister than a consolidation similar to July’s, there was no specific news crossing the screens last night but the combination of high valuations and momentum traders all positioned the same way leaves stocks / sectors vulnerable to sharp pullbacks i.e. the BNPL stocks locally.
MM remains bullish US stocks medium-term.
US NASDAQ Index Chart
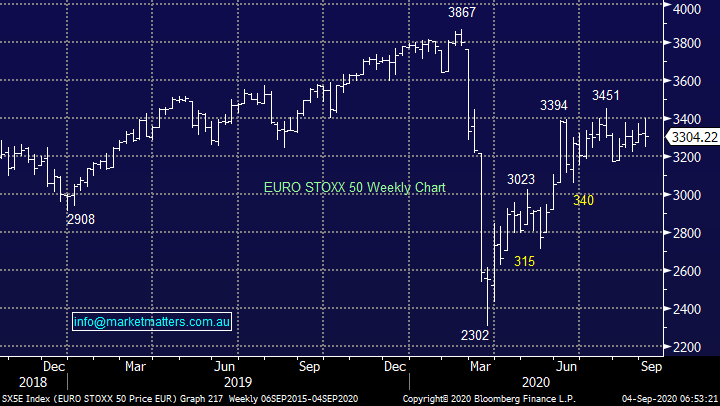
European indices continue to walk the same path as the ASX, my “Gut Feel” is we might see a pullback towards the 3100 area which would look great buying but it really has been a choppy mess over the last 3-4 months.
MM is neutral European stocks short-term.
EURO STOXX Index Chart
Is there another Costa Group (CGC) lurking?
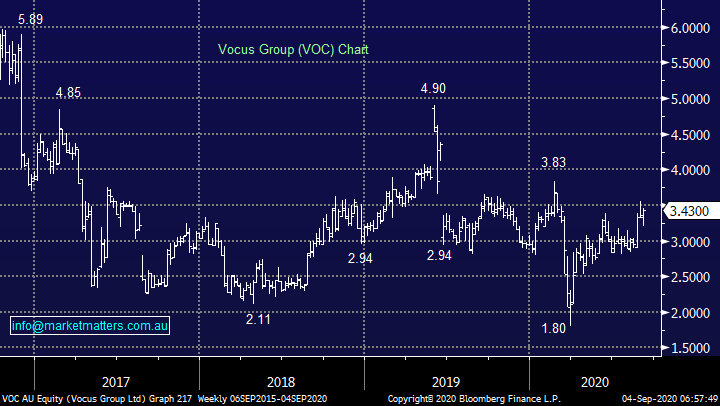
Following on from yesterday’s report we thought this was an opportune time to look at another3 underperformers following a strong move by Vocus which we bought last month. Obviously, this Telco has been on struggle street for a long time, but we now believe the risk / reward is attractive, especially as the market appears to be looking for cheap stocks as opposed to chasing the momentum train.
MM is bullish VOC initially targeting 30% upside.
Vocus (VOC) Chart
Today I have again deliberately had a quick look at 3 stocks we haven’t considered of late as we look for another diamond in the rough.
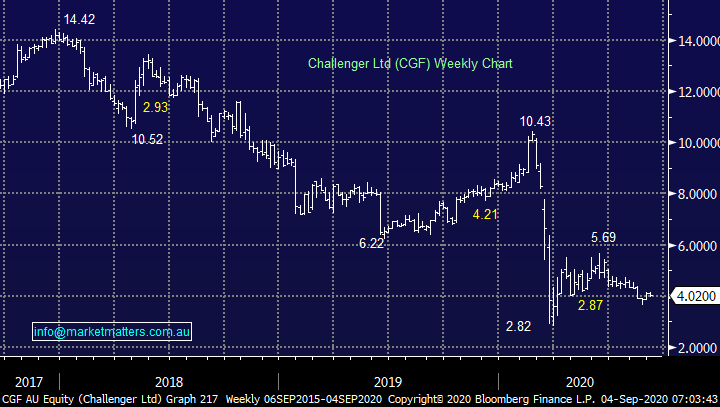
1 Challenger (CGF) $4.02
CGF has gone from hero to villain over the last 3-years, back in June they raised capital at $4.89, equivalent to ~9% of shares already on issue creating huge dilution, this is currently showing a 20% paper loss – a bad result when even Webjet (WEB) is showing a profit on its post virus capital raise. We undoubtedly have our underperformance, the question is can the company turn the corner.
The annuity company believes there is significant opportunity in markets post the pandemic but of course there are also further risks. With their capital ratios improved CGF is a stronger business and their result last month was ok showing 4% increase in funds under management (FUM) and improved life sales, but their investments were still struggling and their margins are under pressure. Guidance for 2021 was down ~18% (mid-range) on this year which is far from exciting plus technically the stocks slightly bearish if push comes to shove.
MM is neutral / negative CGF.
Challenger (CGF) Chart
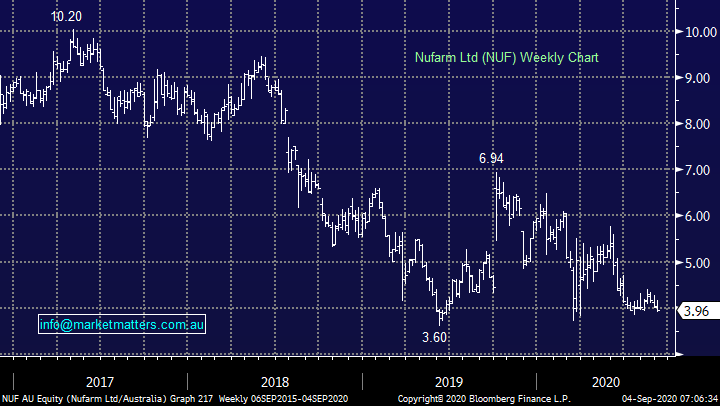
2 Nufarm (NUF) $3.96
Agribusiness NUF actually provided guidance on Wednesday which initially was taken positively but the stock drifted yesterday. The company is expecting EBITDA just shy of $240m following the sale of its South American business and they are seeing strong demand for products following the Australian drought but the stocks still struggling, not one for us at current levels.
MM is neutral NUF.
Nufarm (NUF) Chart
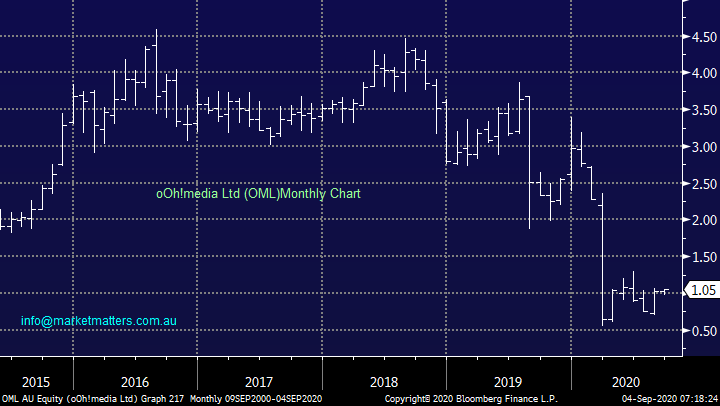
3 oO!media Ltd (OML) $1.05
OML’s stock popped nicely after its half-year result last month which saw revenue over $200m, down 33% on the previous period which was clearly better than many expected but still it dropped down to a loss of $23m. The company’s capital raise in March ensured the company has ~$125m cash on hand, this is simply a business that needs to see a sustained economic recovery and of course companies to open their marketing chequebooks. Things are improving for OML albeit from a low base, but they refrained from giving any forward guidance. My concern is not so much the economy getting up off the canvas but how quickly will company’s start spending in some of OML’s more traditional offerings.
MM is neutral OML.
oO!media Ltd (OML) Chart
Conclusion
Of the stocks looked at today nothing was exciting, the joys of writing a daily note! Have a great weekend all.
Cheers
James & the Market Matters Team
Disclosure
Market Matters may hold stocks mentioned in this report. Subscribers can view a full list of holdings on the website by clicking here. Positions are updated each Friday, or after the session when positions are traded.
Disclaimer
All figures contained from sources believed to be accurate. All prices stated are based on the last close price at the time of writing unless otherwise noted. Market Matters does not make any representation of warranty as to the accuracy of the figures or prices and disclaims any liability resulting from any inaccuracy.
Reports and other documents published on this website and email (‘Reports’) are authored by Market Matters and the reports represent the views of Market Matters. The Market Matters Report is based on technical analysis of companies, commodities and the market in general. Technical analysis focuses on interpreting charts and other data to determine what the market sentiment about a particular financial product is, or will be. Unlike fundamental analysis, it does not involve a detailed review of the company’s financial position.
The Reports contain general, as opposed to personal, advice. That means they are prepared for multiple distributions without consideration of your investment objectives, financial situation and needs (‘Personal Circumstances’). Accordingly, any advice given is not a recommendation that a particular course of action is suitable for you and the advice is therefore not to be acted on as investment advice. You must assess whether or not any advice is appropriate for your Personal Circumstances before making any investment decisions. You can either make this assessment yourself, or if you require a personal recommendation, you can seek the assistance of a financial advisor. Market Matters or its author(s) accepts no responsibility for any losses or damages resulting from decisions made from or because of information within this publication. Investing and trading in financial products are always risky, so you should do your own research before buying or selling a financial product.
The Reports are published by Market Matters in good faith based on the facts known to it at the time of their preparation and do not purport to contain all relevant information with respect to the financial products to which they relate. Although the Reports are based on information obtained from sources believed to be reliable, Market Matters does not make any representation or warranty that they are accurate, complete or up to date and Market Matters accepts no obligation to correct or update the information or opinions in the Reports. Market Matters may publish content sourced from external content providers.
If you rely on a Report, you do so at your own risk. Past performance is not an indication of future performance. Any projections are estimates only and may not be realised in the future. Except to the extent that liability under any law cannot be excluded, Market Matters disclaims liability for all loss or damage arising as a result of any opinion, advice, recommendation, representation or information expressly or impliedly published in or in relation to this report notwithstanding any error or omission including negligence.


