Can MM find opportunity amongst the 10 cheapest large caps? Part 1 (AMZN US, BPT, FMG, NST, CGF, CIM)
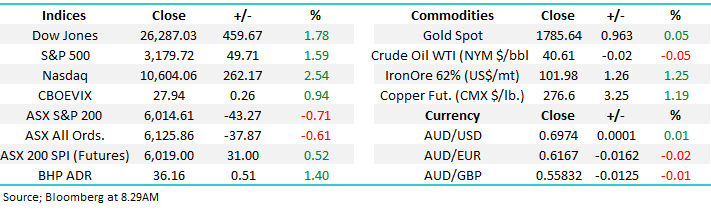
The ASX200 traded briefly in positive territory yesterday however as the Chinese market rallied hard, it seemed like money was re-allocated out of Australia into Asia and that saw local stocks come off their earlier highs and track lower into the close. The Shanghai Composite in China finished up an impressive 5.71% yesterday to close at its highest point since early 2018 while the rest of Asia was also strongly higher, Hong Kong’s Hang Seng rallied by almost ~4% while Japan put on close to ~2%.
Healthcare stocks were the major drag locally yesterday closing down more than 2% while mining stocks also struggled. While almost twice the number of stocks closed in the red relative to the green, only 5 stocks in the ASX 200 moved more than 5%. One stock catching my eye yesterday was Copper producer Oz Minerals (OZL) which traded to its highest level in more than 8 years. MM remains bullish both Copper and OZL and the stock remains our biggest overweight call in the MM Growth Portfolio.
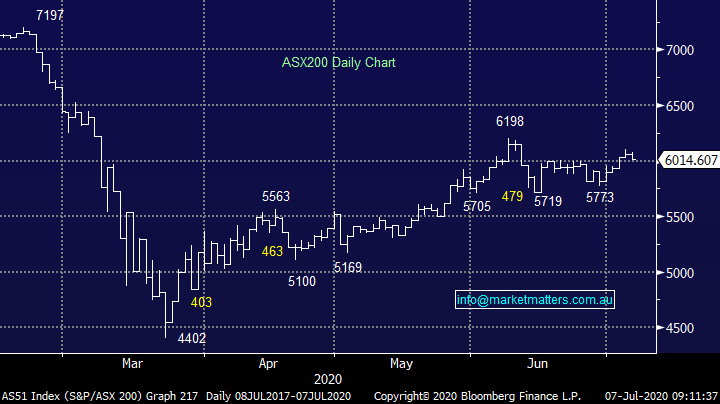
While the market might feel in need of a rest it doesn’t mean MM is in “sell mode” yet, we remain focused on picking an ideal level to increase our cash holdings, my best guess at present is ~6300 for the ASX200. However, it’s not a perfect science because stocks / sectors do not move as one, and we believe that the positive momentum in Asia coupled with improving economic data globally, and of course the barrage of stimulus that is in play is likely to provide a big tailwind for resources, which has a major bearing on our local index.
MM remains bullish equities medium-term.
ASX 200 Index Chart
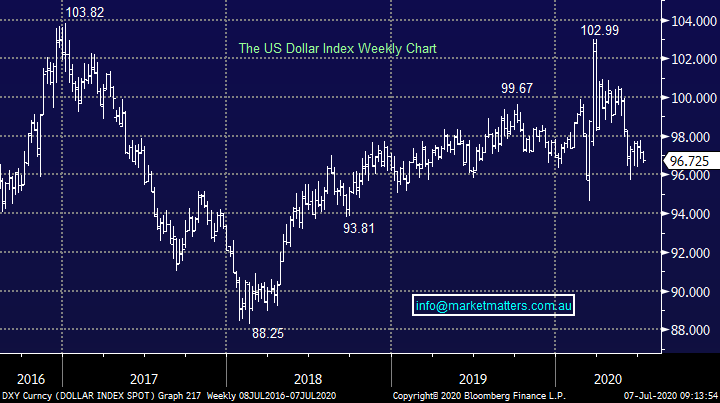
One of the major influences on Asian stocks is the outlook for the US currency, if US investors turn more bearish the $US they start to look internationally, and money naturally flows into Asian domiciled equities. Overnight the $US continued to weaken pushing the Aussie battler to be once again knocking on the door of the 70c level, however looking at the US dollar index, which tracks the US currency against a basket of its major trading partners, it’s clear that the story is more about US weakness than Aussie strength.
MM remains bearish the $US / bullish the AUD
US Dollar Index (DXY US) Chart
SPI Futures are indicating a pop on the open today of ~60 points for index with BHP likely to open 1.4% higher. Iron Ore & Copper were both strong overnight however we also saw the volatility index tick higher in a strong market, which is ab anomaly, the VIX up +0.94% to 27.94.
**Afterpay (APT) has just entered a trading halt raising $800m, with the founders selling $250m worth of shares**
Overseas markets
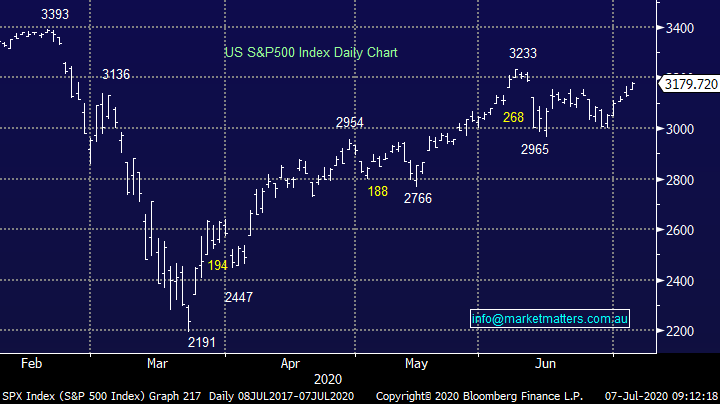
Economic data last week showed the US economy bouncing back quicker than many thought possible and with the backdrop of stimulus it’s understandable that stocks are rallying despite virus related headlines becoming more concerning by the day. The key to the sustainability of the rally will shortly become earnings with Q2 earnings in the US kicking off next week. The S&P 500 is currently trading on 19x expected 2021 earnings which is rich, making this earnings period an important one.
Overnight US stocks were strong led by technology shares pushing the NASDAQ up 2.54%, while the S&P 500 added 1.59%.
S&P500 Index Chart
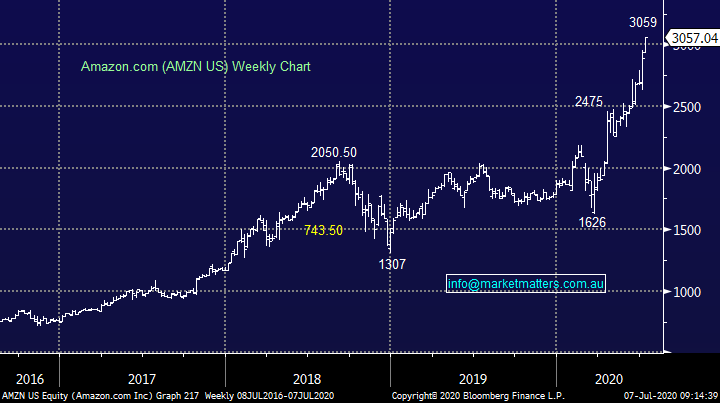
Amazon (AMZN US) traded to new all-time highs above $US3000 - the online retail and technology goliath is now worth more than $US1.5 trillion. To put that number into context, if we combine the value of every stock on the ASX it equates to around A$2 trillion (or US$1.4 trillion) making Amazon more valuable that the entire Australian stock market. While it’s hard to comprehend, the power and scalability of some of the US technology businesses is simply mind blowing. Telsla (TSLA US) rallied 13% overnight capping off an incredible 5 days that has seen its share price up over 40%.
MM remains bullish US stocks
Amazon (AMZN US) Chart
Can MM find opportunity amongst the 10 cheapest large caps?
There’s lots of talk about market valuations being completely disjointed from economic reality given we’re in recession and many businesses/sectors are clearly struggling. The market is trading on a current price to earnings (P/E) multiple of 19.2x and given the deferral / cut to banking dividends, the yield is just ~3.5%. That compares to historical averages around ~15x and a dividend yield closer to 4.5%, however the weight of stocks in the index that are not making a profit – Afterpay (APT) for example which is now in the top 20 has never been higher and that skews the numbers marginally.
In a 2 part note we’ll look at the cheapest 10 stocks in the ASX 100 based on a fair value P/E. To get that we look at the 12m forward consensus target price divided by the 12m forward EPS estimate. Here are the cheapest 10 (excluding loss makers or marginally profitable stocks).
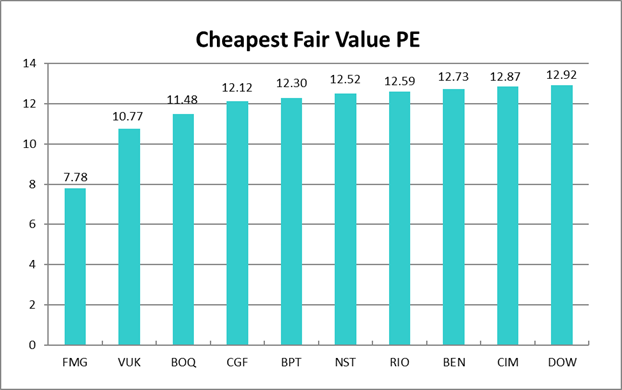
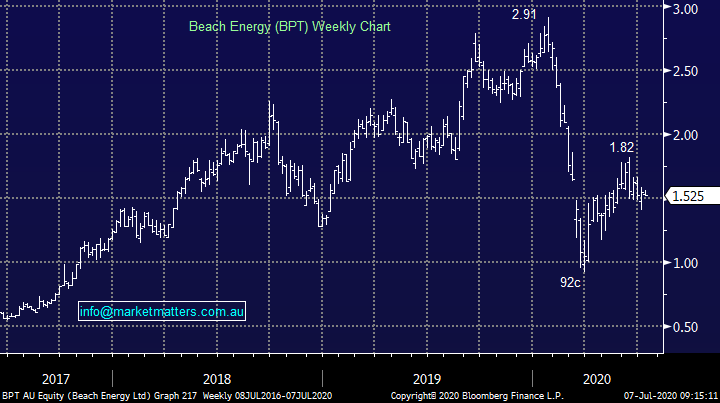
1 Beach Energy (BPT) $1.525
While BPT screens ‘cheap’ the market has never wanted to pay more than 10 times forward earnings for Beach Energy (BPT) for much of the past decade. Today’s fair value PE of 12.3x looks high relative to recent history. BPT has corrected 23% and 19% during its journey up from its panic March low, an impressive bounce which has seen the oil stock almost double while illustrating its penchant for volatility.
MM currently holds BPT & WPL as energy exposures in our Growth Portfolio, however if we see a ~15% pop higher by BPT we feel this will provide a good opportunity to again par back our exposure to this volatile sector.
MM is considering cutting its BPT position above its June high.
Beach Petroleum (BPT) Chart
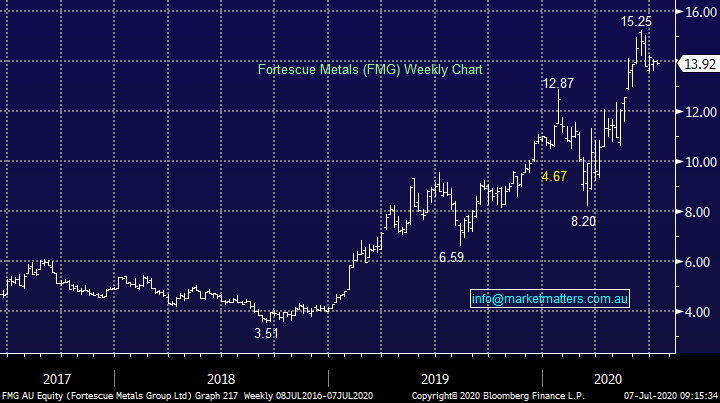
2 Fortescue Metals (FMG) $13.92
FMG has had a chequered history swinging from profit to loss historically, but otherwise is afforded a low fair value PE south of 10x. FMG’s resilience during COVID-19 was heroic and while we are fans of this major iron ore miner and are bullish materials / resources in the next 1-2 years, after such a stellar run by both the stock and bulk commodity we feel more comfortable adopting a patient approach looking for some better risk / reward, particularly given we have large positions in RIO & BHP.
MM is neutral FMG, preferring to sell Iron Ore into strength, allocating funds into Gold
Fortescue metals (FMG) Chart
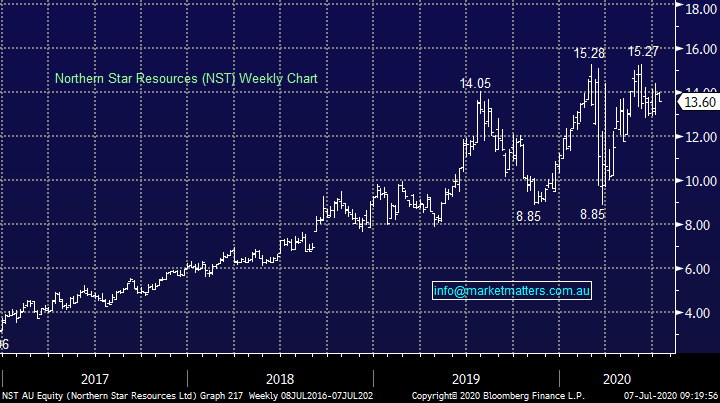
3 Northern Star Resources (NST) $13.60
Gold producer NST has always been thought of to be a short mine life company and hence a low fair value PE. If the company can improve its reserve base, the stock will be re-rated higher, and this is a trend that started 2014. NST is our second pick amongst the Australian miners (behind NCM) with a punch up towards $16 feeling just a matter of time.
MM is bullish NST.
Northern Star Resources (NST) Chart
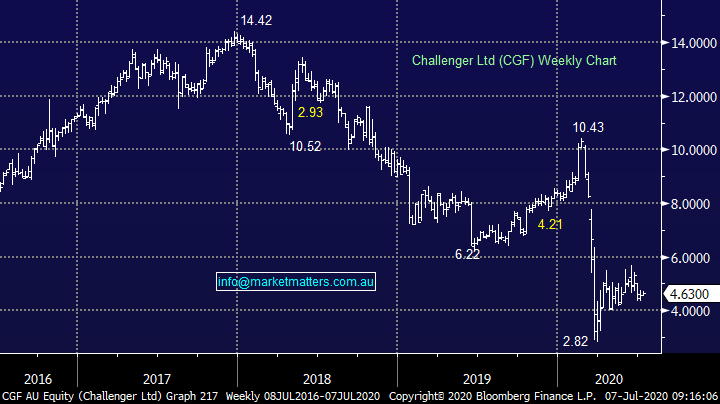
4 Challenger Group Financial (CGF)
The annuities provider is a highly cyclical business and has been in and out of favour over the last decade. During the GFC it traded to a P/E as low as 6x and as high as 18x in 2017. Since then, CGF has been on the skids as a combination of poor investment decisions and soft annuity sales have hurt margins. Right now, it is somewhere in the middle and MM has no interest in CGF at current levels.
MM is neutral CGF
Challenger Group Financial (CGF) Chart
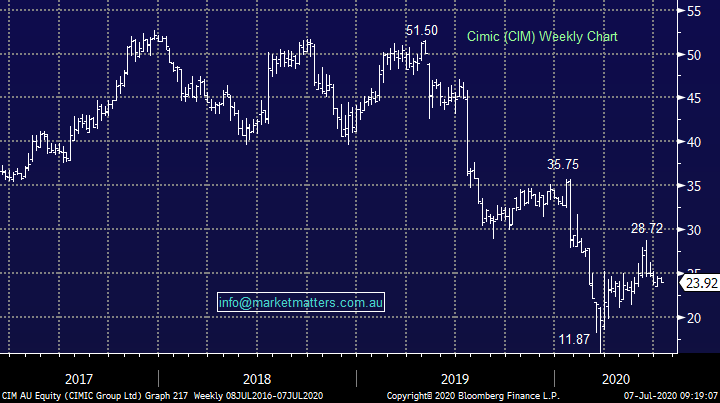
5 Cimic (CIM) $23.92
The earnings of construction and engineering business Cimic have been erratic over the years which is partially a reflection of the sector they’re in, but also a reflection of the company itself. The ‘old Leightons’ is primarily owned (77%) by Spanish firm Hochtief and while we are positive on infrastructure spend in Australia, we prefer to play this through Lend Lease (LLC) & Bingo (BIN).
MM is negative CIM
Cimic (CIM) Chart
Conclusion
We are likely sellers of BPT into strength
While we don’t own FMG, we prefer to use strength in Iron Ore to sell, re-allocating funds into Gold
We are bullish Northern Star (NST), and have no interest in CGF or CIM
Overnight Market Matters Wrap
- The US gained overnight following China’s Shanghai Composite index which closed at its highest level in over 2 years.
- Metals gained with Copper up 1.19%, while crude oil hovered above the US$40.60/bbl. level.
- BHP is expected to outperform the broader market after ending its US session up an equivalent of 1.40% from Australia’s previous close.
- The September SPI Futures is indicating the ASX 200 open 68 points higher, towards the 6085 level this morning.
Have a great day!
James & the Market Matters Team
Disclosure
Market Matters may hold stocks mentioned in this report. Subscribers can view a full list of holdings on the website by clicking here. Positions are updated each Friday, or after the session when positions are traded.
Disclaimer
All figures contained from sources believed to be accurate. All prices stated are based on the last close price at the time of writing unless otherwise noted. Market Matters does not make any representation of warranty as to the accuracy of the figures or prices and disclaims any liability resulting from any inaccuracy.
Reports and other documents published on this website and email (‘Reports’) are authored by Market Matters and the reports represent the views of Market Matters. The Market Matters Report is based on technical analysis of companies, commodities and the market in general. Technical analysis focuses on interpreting charts and other data to determine what the market sentiment about a particular financial product is, or will be. Unlike fundamental analysis, it does not involve a detailed review of the company’s financial position.
The Reports contain general, as opposed to personal, advice. That means they are prepared for multiple distributions without consideration of your investment objectives, financial situation and needs (‘Personal Circumstances’). Accordingly, any advice given is not a recommendation that a particular course of action is suitable for you and the advice is therefore not to be acted on as investment advice. You must assess whether or not any advice is appropriate for your Personal Circumstances before making any investment decisions. You can either make this assessment yourself, or if you require a personal recommendation, you can seek the assistance of a financial advisor. Market Matters or its author(s) accepts no responsibility for any losses or damages resulting from decisions made from or because of information within this publication. Investing and trading in financial products are always risky, so you should do your own research before buying or selling a financial product.
The Reports are published by Market Matters in good faith based on the facts known to it at the time of their preparation and do not purport to contain all relevant information with respect to the financial products to which they relate. Although the Reports are based on information obtained from sources believed to be reliable, Market Matters does not make any representation or warranty that they are accurate, complete or up to date and Market Matters accepts no obligation to correct or update the information or opinions in the Reports. Market Matters may publish content sourced from external content providers.
If you rely on a Report, you do so at your own risk. Past performance is not an indication of future performance. Any projections are estimates only and may not be realised in the future. Except to the extent that liability under any law cannot be excluded, Market Matters disclaims liability for all loss or damage arising as a result of any opinion, advice, recommendation, representation or information expressly or impliedly published in or in relation to this report notwithstanding any error or omission including negligence.


