“Buy now pay later” stocks get hotter by the day! (ORE, APT, Z1P, OPY, SZL)
The ASX200 kicked the week off with a solid performance rallying 1% but for the bulls like ourselves it was a touch disappointing with the market giving back a third of its early gains plus over 35% of the main index actually closed down for the session. The lack of broad-based buying was apparent while the Healthcare and IT Sectors were standout headwinds for the index whereas banks which are “friend free” in the press rallied strongly with the average gain by the influential “Big Four” almost 2%. Underlying confidence still feels very brittle as Victoria and now Sydney threaten to move closer to sterner secondary lockdowns although globally governments are definitely rejecting total lockdowns but previous optimism towards a “V-shaped” style recovery appears to have been way too high.
However we did observe some mixed signals on the sector front as the safe havens struggled including gold while the “Value” end of town dominated the gains which suggests a strong economic recovery / reflation with heavyweight resources adding to the index gains by the banks. Undoubtedly the active momentum traders are long the IT sectors which accurately “called” the US tech sectors fall overnight, I read a couple of interesting articles yesterday around valuations and the IT space with the underlying tone being things are getting carried away and a bubble is forming in the IT space.
When we stop and compare today with the tech wreck of 20-years ago MM believes things are very different:
1 – sure the market is rallying strongly on almost “free money” but it hasn’t surged over 500% on pure hope / exuberance as it did in under 3-years around the Sydney Olympics.
2 – The likes of Apple (AAPL), Microsoft (MSFT US) and Google (GOOGL US) are making huge profits and building massive war chests of cash in the process, there is zero comparison in our opinion. These top end stocks are becoming safe havens due to their massive cash buffers.
3 – we do acknowledge that many stocks are being dragged along for the ride but with only 5 Australian ASX200 IT stocks (33%) in positive territory over the last 6-months it hardly feels like a bubble plus for good measure a third are actually down by more than 20% over the same period i.e. the market is being selective.
4 – hence we acknowledge there are some large valuations around but with “free cash” about and some businesses delivering exceptional growth, it is not crazy stuff, just yet. Remember, the printing presses of today like Apple & Microsoft were loss making for many years before they flicked the switch.
Beyond the “Buy now & pay later” space things do not feel bubble like in Australian IT stocks and the best approach is to judge each company on its individual merits and importantly, look past traditional measures like P/Es, these will be more of a hinderance than a help when thinking about technology stocks.
With regard to the US NASDAQ we still feel the path of least resistance remains up but there will be some bumps in the road.
US NASDAQ Index Chart
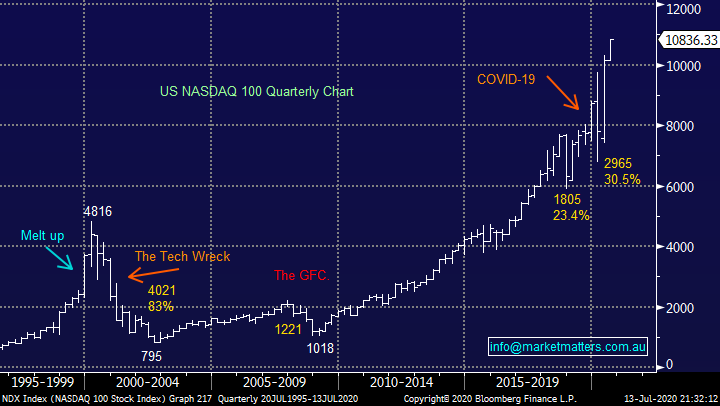
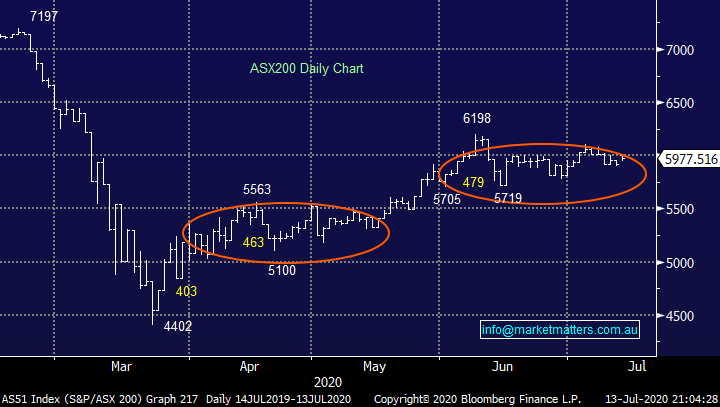
The song remains the same from an index perspective with the psychological 6000 level feeling like a magnet to local stocks. Our preference remains the next 5% is up but we are smack in the middle of the last 6-weeks trading range making it a statistical coin toss – if the banks and heavyweight resources maintain their mojo from Monday perhaps we can finally see a sustained close back above 6000. However the consistent poor data on coronavirus outbreaks both locally and primarily in the US remains a massive headwind for stocks, it feels like we are on the precipice of stepping back in time with regard to lockdowns, just ask Victorians while in California schools are starting this term again learning from home.
This morning following the -2.2% unwind by US tech stocks the local market looks set to give back all of yesterday’s gains, although in the US the old school sectors held up ok which should be supportive to the ASX. Personally, I feel we are going to need a glimmer of hope in the COVID-19 numbers before stocks can make any further headway on the upside.
MM still remains overall bullish equities medium-term.
ASX200 Index Chart
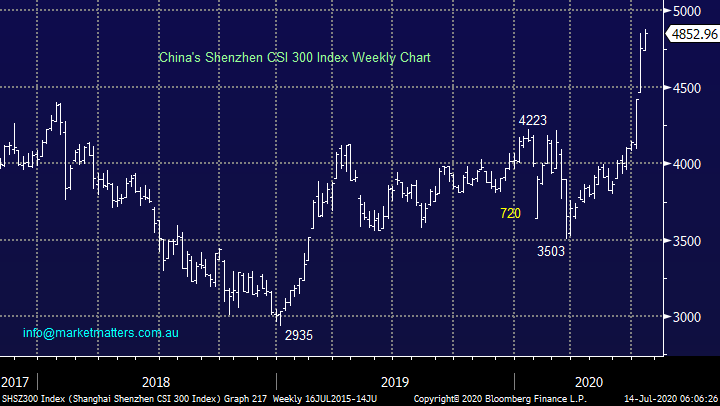
Yesterday again saw Chinese stocks make fresh multi-year highs as they move on from COVID-19 far faster than the West, it helps when you can enforce vigorous lockdowns at the simple press of a button. Similarly, iron ore continues to defy economists’ forecasts and surge higher rallying over 12% in less than 10-days. At MM we continue believe that the resources sector will outperform over the next 12-months, especially any stocks who produce a commodity which China consumes.
MM is bullish the reflation trade.
China’s Shenzhen CSI 300 Index Chart
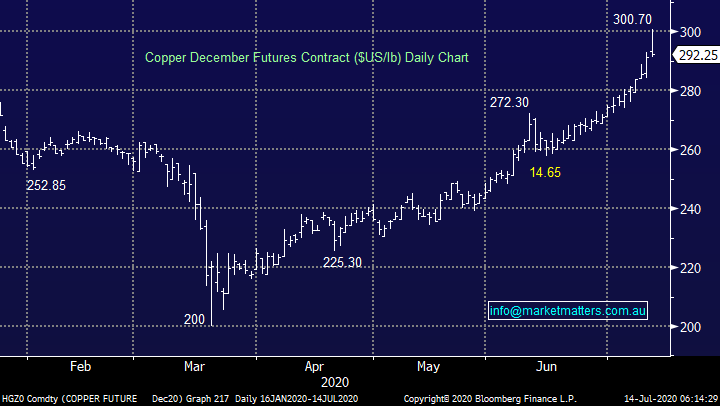
Similarly “Dr Copper” made fresh 2020 highs last night briefly pocking its head above the psychological $US300/lb level, while a period of consolidation around current levels feels likely we would be looking to buy any retracements over 5%, in our opinion the Chinese appetite will not diminish because Florida’s COVID-19 cases are surging higher.
MM remains bullish copper & commodities.
On a “spread / pairs” basis we believe Chinese stocks will outperform the hot IT sector over the next 12-18 months – note this is a relative strength call, not a bearish / bullish view.
Copper December Futures Contract ($US/lb) Chart
Global Markets.
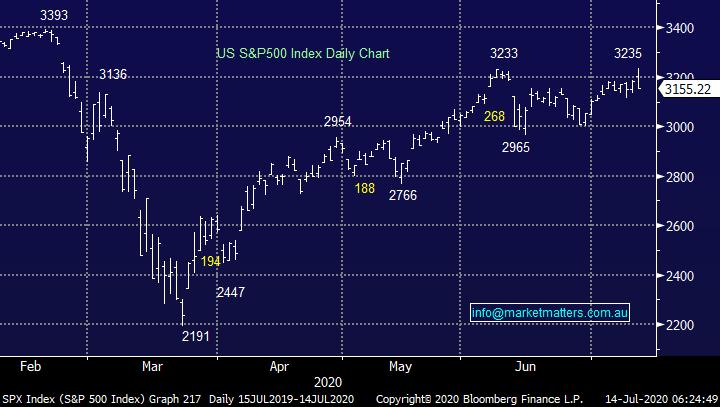
Overnight the US stocks were volatile after the broad-based S&P500 initially made a marginal fresh post COVID-19 high, a level we have targeted for many weeks. With virus numbers almost spiralling out of control Trump et al are going to find it extremely hard to keep the US economic engine firing on all cylinders making is now neutral short-term, it feels like a few choppy / volatile weeks may lie ahead.
MM remains bullish US stocks medium-term.
US S&P500 Index Chart
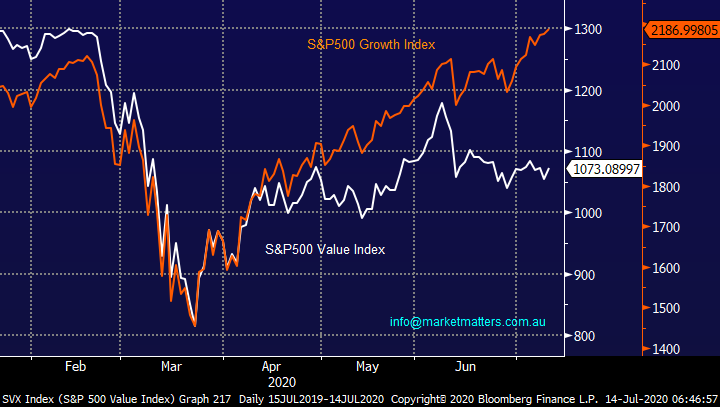
We haven’t mentioned the Value v Growth correlation recently but I feel last night was the start of the former taking the baton from a performance perspective into Christmas, I know 1-day doesn’t make a summer but it’s a trigger we’ve been waiting for over recent weeks. From an investment perspective this means MM will be much keener for example to buy resources / banks as opposed to IT / Healthcare stocks as we anticipate the respective lines on the chart below to converge – a pretty contrarian stance at this point in time but the breakout by China’s stock market makes us especially comfortable with the resources end of town.
MM remains bullish value overgrowth moving forward.
US S&P500 Value & Growth Indices Chart
Is the “Buy now, pay later” space becoming a bubble?
In many peoples opinion market valuations have become completely disjointed from economic reality with the “Buy now, pay later” sector front and centre, there’s undoubtedly some euphoria in a sector when heavyweight Afterpay (APT) can rally almost 10-fold since March making it a $20bn business – not bad for a stock floated only 3-years ago. Increasingly I am hearing / reading about APT and its related stocks being talked about from 2 distinct different perspectives:
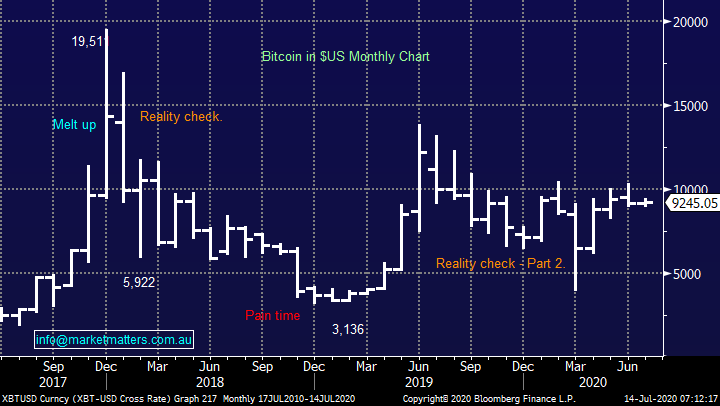
1 – Many investors / traders are excited by the sectors rally and discussing which stock to buy next in bubble like rhetoric, very similar to that of Bitcoin back in late 2017 when numerous worthless cryptos were listed only to soar and then crash.
2 – Conversely some professional markets players are calling the sector a bubble as the stocks soar higher without them onboard, unfortunately MM has the last part of this equation in common.
The question that needs to be asked again is where are we on the curve for the sector which undoubtedly will suffer another sharp correction in time but will it double first? Bitcoin soared ~500% in just 3-months back in 2017, a move which does look & feel similar to APT. One factor I am cognisant of is the number of new players entering the space, again similar to the cryptos 3-years ago, an old saying comes to mind for how to make $$ in business – be first, be best or be crooked. APT has the 1st box ticked hence we only have interest in stocks who bring something different / better to the table otherwise it’s going to become an uphill battle especially as the likes of AMEX, Visa and the banks eye the space.
However we believe investors should not compare BNPL & Bitcoin too closely, credit card balances pre-COVID were down 5% year on year but BNPL volume more than doubled to ~$12bn with Afterpay & Zip (Z1P) front and centre i.e. it’s a very real and growing sector and I would argue, COVID-19 has simply accelerated the structural change playing out in the payments space globally, the real question is therefore what is the right price for exposure to the rapidly growing sector, both locally and internationally. Just consider it costs the “Big 4” around $120 to acquire a typical customer whereas APT & Z1P are paid by the merchant to acquire the customer!
MM believes its vital to consider the volatile sector with risk / reward front & foremost.
Bitcoin ($US) Chart
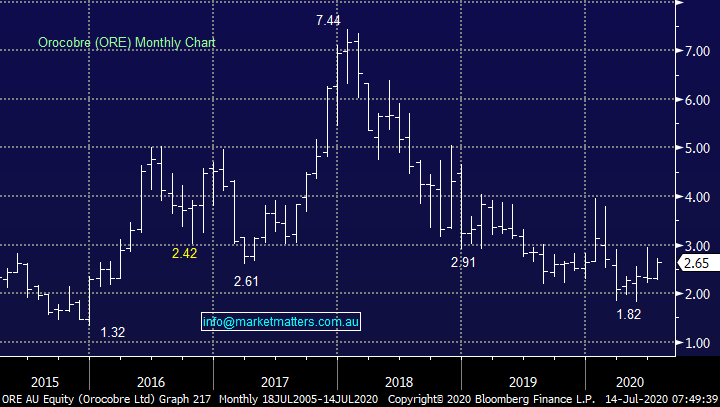
Another sector which comes to mind is the now forgotten lithium stocks of 2017/8 when we saw Orocobre soar above $7 as Toyota bought a large stake only for it to then plunge by 75%, the lesson to be learned is don’t underestimate the risks and just because a supposed expert buys into a stock / the sector doesn’t mean you and I should follow suit. Electric cars have indeed continued to flourish but optimism and share prices went far too high in this case because supply flooded the market.
MM believes the lithium stocks should add a degree of caution to BNPL investors.
Orocobre (ORE) Chart
Today we have briefly looked at 4 of the local BNPL players paying significant attention to risk / reward.
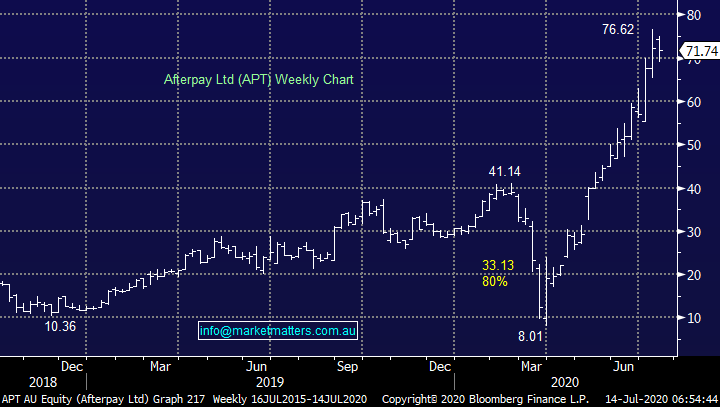
1 Afterpay Group (APT) $71.74
At the next index rebalance, Afterpay (APT) is likely to be added to the ASX top 20, it’s 4x the size of JB Hi-Fi (JBH) and only a shade smaller than Coles (COL) putting its meteoric rise into perspective! While it’s most definitely not cheap on any metric we care to use, if it keeps growing rapidly these might easily become justified. Following its recent capital raise and founder selldown I envisage we will see a period of consolidation from the sector leader but with underlying sales up over 110% year on year to in excess of $11.2bn this has become a very real business which looks extremely well positioned to beat FY22 targets of $20bn i.e. Plus it’s a definite benefactor of COVID-19 increased on-line sales.
Impressively, its active customer numbers are already approaching 10m again up over 110% year on year but with growth understandably slowing in Australia, the focus now turns to the US to justify current valuations. This is the key question with APT and the whole sector, what is a fair price to pay especially after the company raised a fresh $650m at $66.00 from institutions with another $150m a being offered to retail investors. Many have sighted a founder sell-down as a reason to be cautious however both still have a meaningful stake and the last time they sold stock was a $23, so not a great barometer.
At this stage, given the cap raise it doesn’t feel prudent to chase current euphoria, we definitely could miss out on further gains but after the recent rally patience feels justified.
MM would consider APT back under $60.
Afterpay Ltd (APT) Chart
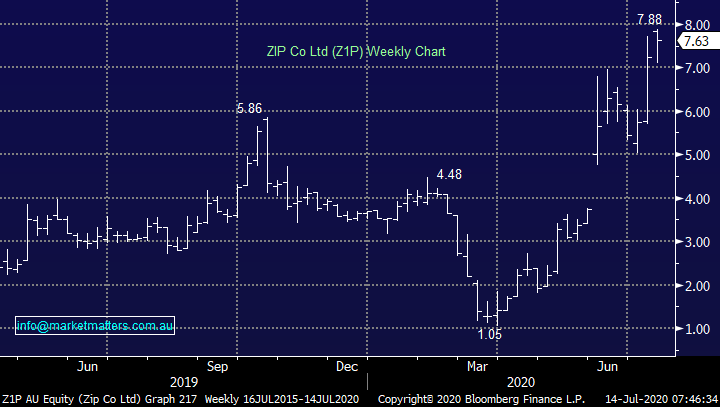
2 ZIP Co Ltd (Z1P) $7.63
Z1P soared recently after announcing the major acquisition of US player QuadPay who already have over 1.5m customers in the US hence providing a clear roadmap for offshore expansion. The company is already delivering $250m+ in annual revenue and $130m+ in gross profit with plenty of potential left in the tank, we believe this play by the Australian business will lead to further rerating assuming the whole sector remains “hot” – how nice is it to see an Australian business buying offshore assets as opposed to the reverse.
MM likes Z1P around $7 leaving “ammunition” to average under $6.
ZIP Co (Z1P) Chart
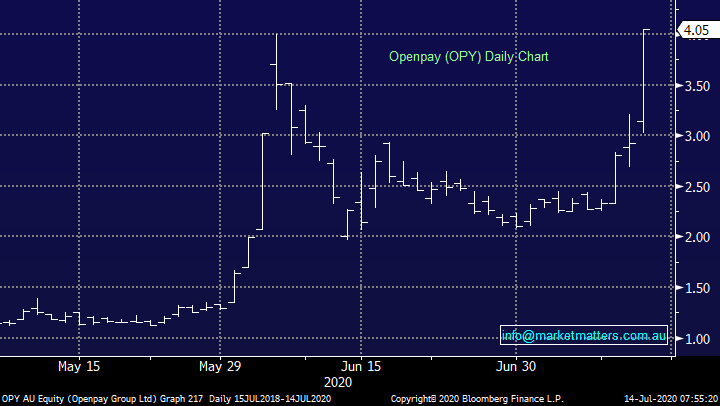
3 Openpay Group (OPY) $4.05
OPY already has a market cap of $436m as its roars to fresh all-time highs with no apparent fresh news, it seems to us that money is flowing into the smaller end of town as an ‘option’ on the space.
From an operational perspective, the difference with OPY is it offers larger payment plans financing purchases up to $20k with more flexible payment ranges of 2 to 24 months with no interest! Certainly, a tough read through for traditional credit cards. The business has over $45m cash on hand to help buffer the impact of COVID-19 and we like its point of difference plus strong technology and established online presence.
MM likes OPY but would use stops around $3.20.
Openpay Group (OPY) Chart
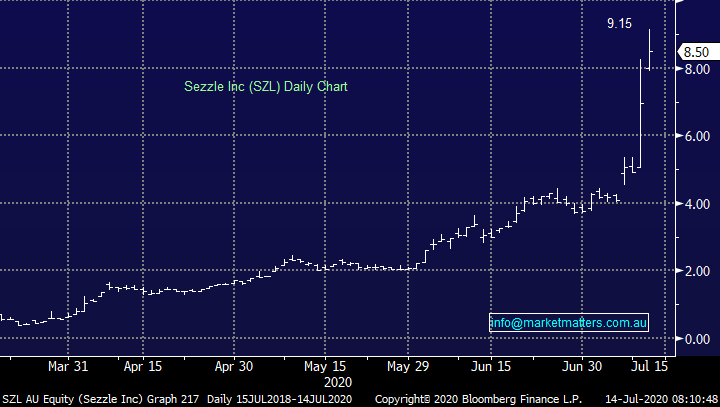
4 Sezzle Inc (SZL) $8.50
US operator SZL has soared in recent days after its sales grew almost 60% quarter on quarter which drops down to an almost 350% year on year lift. This awesome performance was delivered courtesy of strong growth in active merchant’s and customers - the US is coming to the Australian party! The company has taken advantage of this performance to raise $US60m to accelerate its growth strategy. We like SZL but it now feels too rich and the sector is a relative proposition - we can’t buy them all.
MM likes SZL least in the sector
Sezzle Inc (SZL) Chart
Conclusion
At MM we don’t like to dodge the tough questions so here we go:
1 – we like the BNPL space but feels it’s a touch too hot and a pullback / some consolidation is likely.
2 - our order of preference for the 4 stocks covered today, at current prices is Z1P, OPY, APT then SZL.
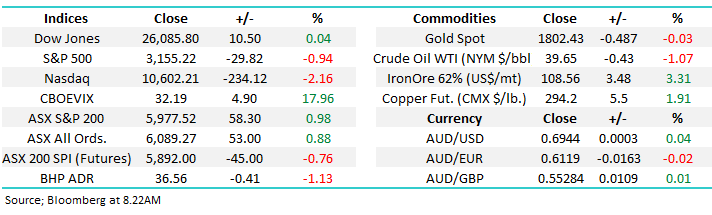
Overnight Market Matters Wrap
· The US equity markets had a brilliant start to the week, only to aggressively sell off late in the afternoon session led by the tech. heavy, Nasdaq 100.
· Investors’ concerns came in late as the usual coronavirus and US-China tensions fear gauge were brought back to light.
· On the energy front, Crude oil slid as signs reveal OPEC will begin to ease its output cuts.
· BHP is expected to underperform the broader market after ending its US session off an equivalent of 1.13% from Australia’s previous close.
· The September SPI Futures is indicating the ASX 200 to give back 23 points and test the 5955 level this morning.
Have a great day!
James & the Market Matters Team
Disclosure
Market Matters may hold stocks mentioned in this report. Subscribers can view a full list of holdings on the website by clicking here. Positions are updated each Friday, or after the session when positions are traded.
Disclaimer
All figures contained from sources believed to be accurate. All prices stated are based on the last close price at the time of writing unless otherwise noted. Market Matters does not make any representation of warranty as to the accuracy of the figures or prices and disclaims any liability resulting from any inaccuracy.
Reports and other documents published on this website and email (‘Reports’) are authored by Market Matters and the reports represent the views of Market Matters. The Market Matters Report is based on technical analysis of companies, commodities and the market in general. Technical analysis focuses on interpreting charts and other data to determine what the market sentiment about a particular financial product is, or will be. Unlike fundamental analysis, it does not involve a detailed review of the company’s financial position.
The Reports contain general, as opposed to personal, advice. That means they are prepared for multiple distributions without consideration of your investment objectives, financial situation and needs (‘Personal Circumstances’). Accordingly, any advice given is not a recommendation that a particular course of action is suitable for you and the advice is therefore not to be acted on as investment advice. You must assess whether or not any advice is appropriate for your Personal Circumstances before making any investment decisions. You can either make this assessment yourself, or if you require a personal recommendation, you can seek the assistance of a financial advisor. Market Matters or its author(s) accepts no responsibility for any losses or damages resulting from decisions made from or because of information within this publication. Investing and trading in financial products are always risky, so you should do your own research before buying or selling a financial product.
The Reports are published by Market Matters in good faith based on the facts known to it at the time of their preparation and do not purport to contain all relevant information with respect to the financial products to which they relate. Although the Reports are based on information obtained from sources believed to be reliable, Market Matters does not make any representation or warranty that they are accurate, complete or up to date and Market Matters accepts no obligation to correct or update the information or opinions in the Reports. Market Matters may publish content sourced from external content providers.
If you rely on a Report, you do so at your own risk. Past performance is not an indication of future performance. Any projections are estimates only and may not be realised in the future. Except to the extent that liability under any law cannot be excluded, Market Matters disclaims liability for all loss or damage arising as a result of any opinion, advice, recommendation, representation or information expressly or impliedly published in or in relation to this report notwithstanding any error or omission including negligence.


