Are we concerned by the struggling Australian gold sector? (JBH, RMS FP, GDX, NCM, EVN, RRL)
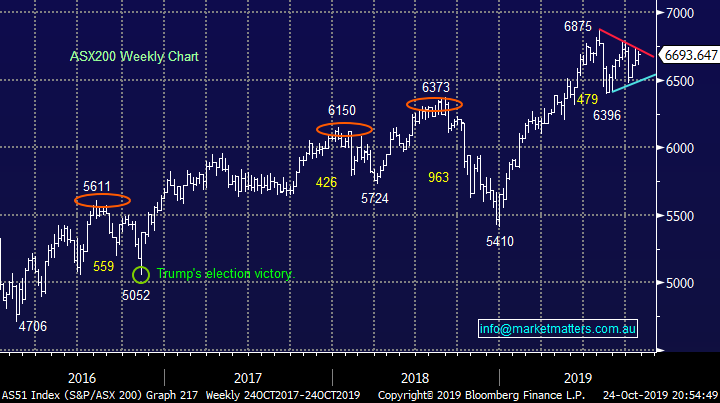
The ASX200 continues to rotate as the week enters its final stretch, we traded up over 40-points just after 10am yesterday only to basically drift lower all day finally closing up 20-points, giving back more than half of the early gains in the process. The buying was again fairly broad-based with only the IT and Telcos’ finishing the day in the red. Volumes remain light as the market searches for some clear direction but as the chart below illustrates the support and resistance levels are slowly but surely converging implying a breakout is not far away.
This morning the SPI futures are “calling” the local market to again open strongly, up over +0.5%, on the surface a strong performance considering US stocks were again mixed overnight. However as we’ve seen so often over recent months when the $A drifts lower, as it did overnight, the ASX enjoys a noticeable bid tone. Our “Gut Feel” is we are going to see a pop to the upside sooner rather than later but it’s a brave investor who fades the current sell strength / buy weakness market rhythm.
This morning I gave a quick audio update covering our views on the market and some portfolio positioning. A 5 min listen wrapping up the week.

The UK and Europe again faces more uncertainty after Boris Johnson tabled a snap election for December 12th, only a few weeks away. Our view is the Conservatives would regain a solid majority enabling the currently hog-tied PM to quickly resolve BREXIT once and for all. However the problem is he needs to get parliament to approve his election plan, hard to see why Labor supporters will vote in favour as they look set to get steamrollered at an election – the fiasco continues! Hence due to the fresh uncertainty the Pound fell overnight, just as UK facing stocks were gaining traction, we expect them to give back some recent gains this morning.
Short-term MM remains neutral the ASX200 but now with an upward bias.
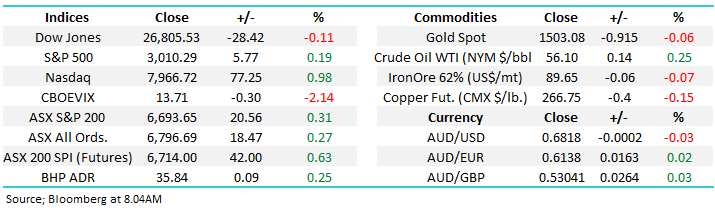
Overnight global stocks were mixed with Dow falling marginally while the tech based NASDAQ rallied +1% as reporting season washed through the US market, considering over 80% of stocks are beating expectations the markets reaction has been fairly lacklustre – overnight we saw Microsoft (MSFT US) rally strongly while 3M (MMM US) fell by ~3.5%. The SPI futures are calling the ASX200 to open up around 40-points, at its highest level since last Thursday.
This morning MM has looked at the Australian gold stocks following a few weeks of poor performance, remember our useful investor adage - “look after your losers and the winners will look after themselves”.
QUICK INSIGHT FROM OUR MORNING MEETING: Shaw’s Chief Investment Officer Martin Crabb is in Singapore attending a global investor conference run by JP Morgan. ~300 global investors, around 25 from Australia - he called in this morning to provide an update. The overarching thematic is investors are bearish with only 15% of attendees looking to increase their equity exposures over the next 12 months, while 24% were looking to increase their exposure to fixed income. The biggest attraction has been presentations on alternative investments while the other key takeaway, and we talked about this last week in the income note was the competitiveness in private lending markets which is leading to rates not compensating for the risks being taken on. This is relevant for us insofar as we are avoiding the higher risk / higher return credit funds in our income portfolio that have popped up on the ASX.
In terms of Gold, and relevance to today’s note there was also a discussion on central banks printing money to buy the precious metal – not sure the validity of this however it would be clearly bullish. In terms of the US – China trade war, Condoleezza Rice, the 66th United States Secretary of State presented yesterday suggesting that this is not Trump’s war, there are many in the US Government & US corporates that have urged a ‘rebalancing’ for a long time - Trump is simply the mouth piece. She believes all parties want a resolution, and that it will happen.
The bearishness of all attendees was the main takeaway, which is ultimately a bullish sign.
ASX200 Chart
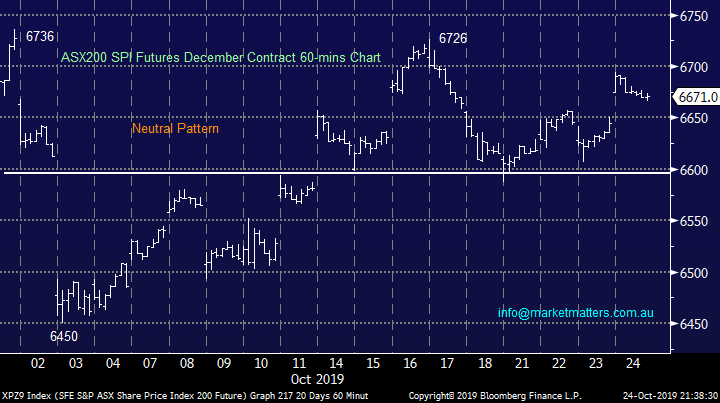
A quick glance at the SPI Futures in October illustrates how we will enter the 6700-6736 resistance (sell) zone this morning, again! While statistically traders should sell this area with stops above 6736, or simply “keep out”, we feel a squeeze higher is close at hand. From a risk / reward perspective the bulls amongst us can go long with stops below 6690.
From an investors perspective its easy, the market remains neutral while under the hood different sectors are jostling for position as Christmas and 2020 approach. However the influential banking sector sees the likes of ANZ Bank (ANZ), National Australia Bank (NAB) and Westpac Bank (WBC) trade ex-dividend in November, it’s hard to imagine the yield hungry Australian investors selling this group any time soon – a clearly bullish consideration.
MM likes the SPI while 6690 holds.
ASX200 SPI Futures Chart
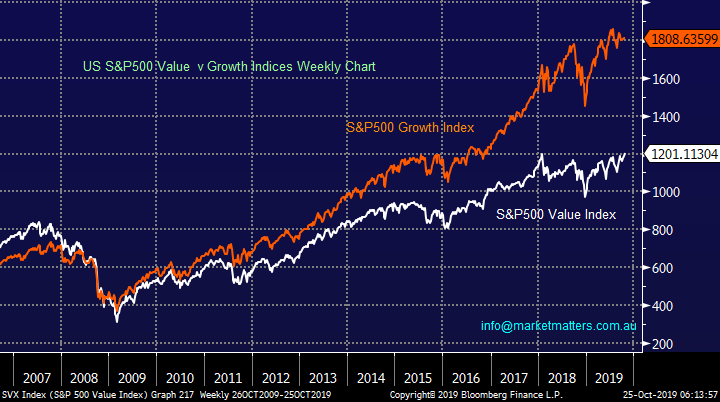
Both ourselves and many pundits have been discussing whether its time to switch from growth back to value but I imagine a number of subscribers have struggled to quantify our thoughts around this call. The chart below illustrates perfectly how US growth stocks have trounced value from a performance perspective, especially since 2016 when the gap started widening at an accelerated rate.
However this year has seen value outperform growth, albeit marginally hence the numerous discussions.
MM believes the outperformance of growth over value has / is topping out.
S&P500 Value v Growth Indices Chart
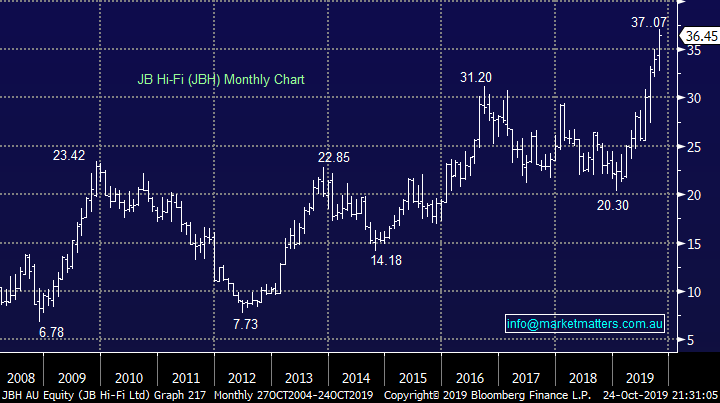
Yesterday saw JB HIFI (JBH) soar to an all-time high ignoring the negativity around retail, clearly electrical goods are becoming necessities as opposed to discretionary goods! After confirming FY20 guidance the stocks significant short position looks likely to be a major tailwind in the weeks ahead - the shorters have got this one wrong! The stock feels fair value at present trading an Est P/E for 2020 of 16.4x while it looks set to yield over 4% fully franked, not a stock we could be comfortably short!
MM is technically bullish while it holds above $31.
JBH HIFI (JBH) Chart
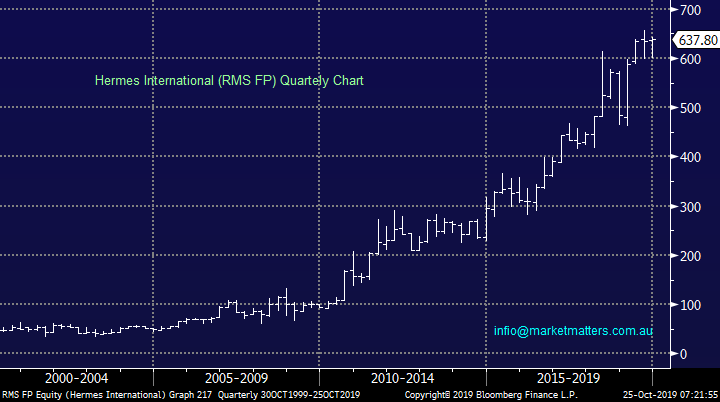
High-end retailer Hermes has ignored Hong Kong demonstrations and waning Asian consumer sentiment courtesy of a potential US - China trade war by posting its fastest ¼’ly revenue growth in 6-years. The luxury brand has demonstrated perfectly that a quality well run business can thrive in most conditions, even if their handbags cost upwards of $10k with a number amazingly coming in at $300k, yes that’s right a handbag can cost the same price as an apartment in many parts of Australia – now that’s marketing!
This is a business that doesn’t spend all year on sale like so many of our retail names, there must be lessons here from this impressive high end retailer – buyers often believe things are cheap and will remain so for a reason, a buyers perception is critical in retail.
MM likes Hermes (RMS FP) technically while it holds above 600 Euro.
Hermes International (RMS FP) Chart
Do we remain happy holding gold stocks?
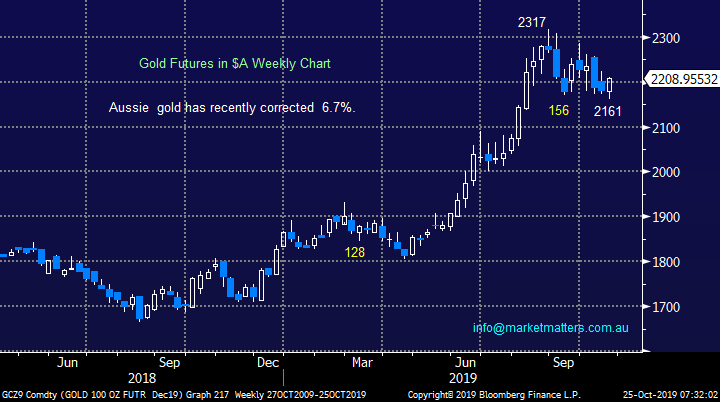
Australian stocks have struggled over recent weeks with even heavyweight Newcrest (NCM) falling over -18%, noticeably magnifying golds pullback in both $US and $A terms. In hindsight the market was clearly longer than we realised and the diminishing concerns around a US – China trade war has led to some aggressive profit taking.
Last night saw a strong $US10/oz rally in gold while the $A also drifted lower, back towards 68c – today should be a strong day for local gold stocks, I will be concerned if its not!
Gold in Australian Dollars Chart
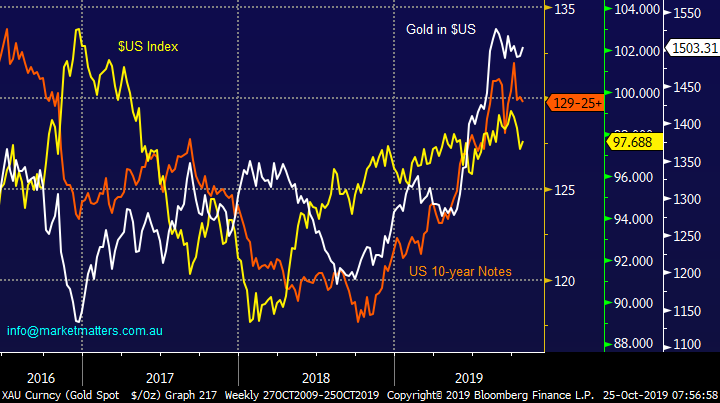
Below I have taken a quick look at what has been the major influence on gold, interest rates, or the $US Index. As would be expected gold has enjoyed periods of falling interest rates / rising bond prices but its been less correlated to the $US – surprisingly a strong $US has not hindered golds appreciation since 2018 i.e. gold has flourished with rising bond prices and uncertainty.
The gold price has been more correlated to US bonds (interest rates) than the $US index.
Gold, US Bonds and $US Index Chart
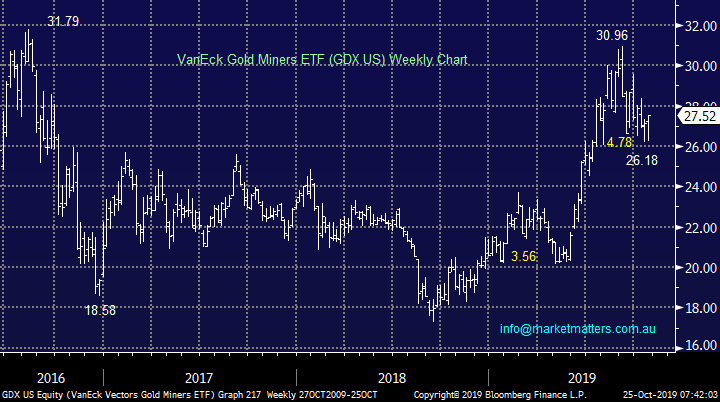
Following golds bounce last night the gold miners ETF (GDX US) rallied over + 2.5% which should give a good lead to the local sector today. When we stand back and look at the current pullback in the GDX its very comparable to the correction at the start of 2019, hence if we had no exposure to the sector we would actually be looking for some solid risk / reward buying opportunities today.
MM remains cautiously bullish the gold miners.
NB Some of the caution comes from our positions being under water!
VanEck Gold Miners ETF (GDX US) Chart
Today I have briefly looked at 3 Australian gold stocks, two of which we hold in our Growth Portfolio. Today we’ve deliberately covered less volume of stocks compared to our usual report as the main focus is on our 2 existing holdings.
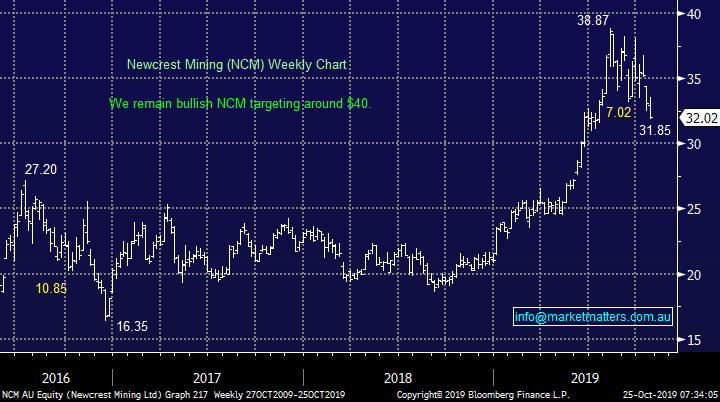
1 Newcrest Mining (NCM) $32.02
MM owns NCM in our Growth Portfolio and the performance over the last fortnight has left us a touch uncomfortable with the position now showing a 6% paper loss however we do believe the stock has absorbed some meaningful bad news with a bounce in bond yields being the most influential. At this stage we are giving the position the benefit of the doubt. Yesterday’s production report was soft, although a lot of that was maintenance driven and they maintained / upgraded full year guidance.
Technically we need a close above $33.50 to trigger a technical buy signal for NCM.
MM is bullish NCM ideally targeting fresh 2019 highs.
Newcrest Mining (NCM) Chart
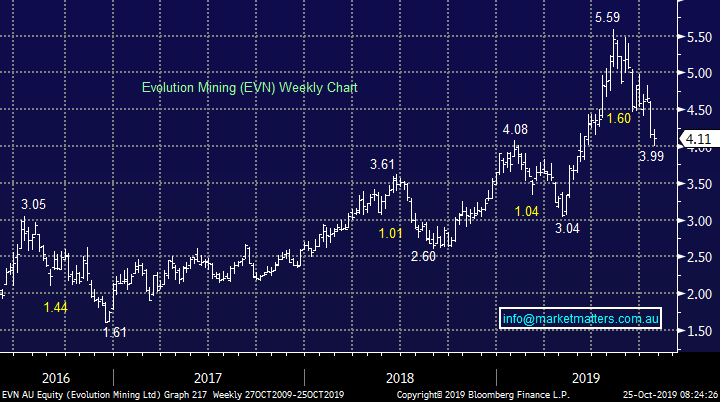
2 Evolution Mining (EVN) $4.11
MM also owns EVN in our Growth Portfolio and again the performance over the last fortnight has left us a touch uncomfortable with the position now showing a 13% paper loss, not surprisingly we have less confidence in this position compared to NCM – stocks usually underperform for a reason.
Technically we need a close above $4.50 to trigger a technical buy signal for NCM.
MM is considering cutting EVN into a decent bounce
Evolution Mining (EVN) Chart
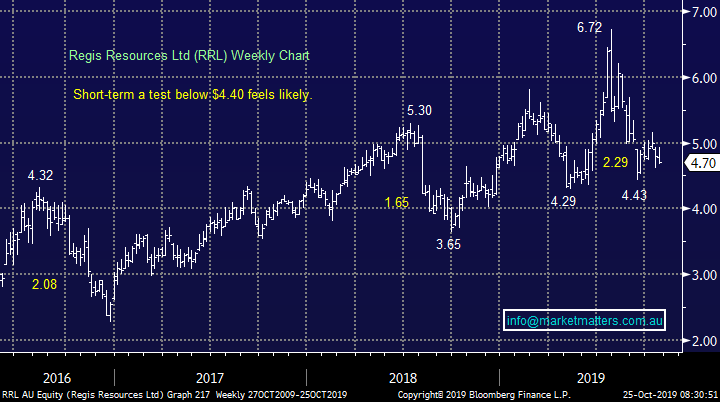
3 Regis Resources (RRL) $4.70
Regis Resources (RRL) continues to struggle when compared to both the market and sector, its currently sitting over 30% below its 2019 high. This correction of almost 5x the underlying gold prices shows how crowded the sector had become and that RRL is not perceived to be performing particularly well as business on a relative basis.
Technically a decline of another ~10% feels likely.
MM currently has no interest in RRL.
Regis Resources (RRL) Chart
Conclusion (s)
MM remains cautiously bullish the gold sector.
Global Indices
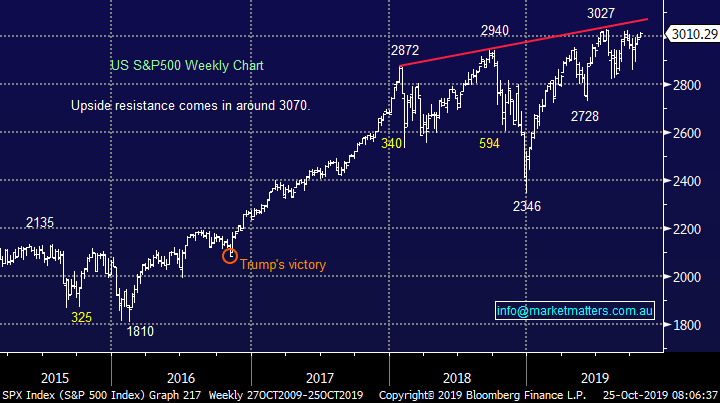
No change, we are now giving the benefit of the doubt to the post GFC bull market with fresh all-time highs ultimately looking likely.
MM is now mildly bullish US stocks.
US S&P500 Index Chart
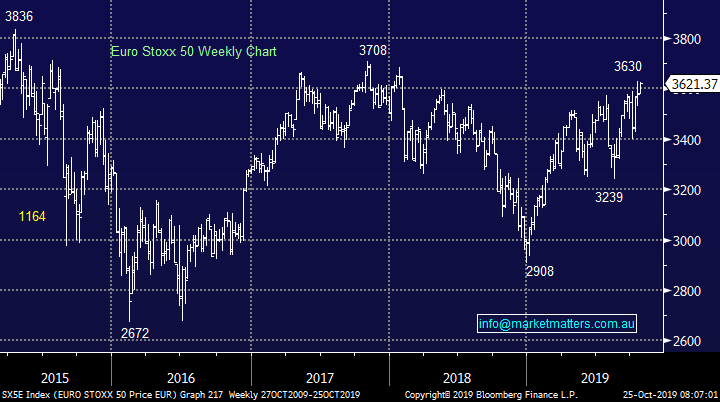
European indices are mixed technically but with no commitment in either direction at this point in time but we maintain our slight positive bias.
Euro Stoxx50 Chart
Overnight Market Matters Wrap
· The US closed mixed overnight with the tech heavy Nasdaq 100 outperforming its peers after Microsoft reported its quarterly earnings and beat expectations. The strength in the Nasdaq will likely reverse following Amazon reporting a disappointing set of earnings after market and its first profit drop in more than 2 years.
· On the sideline, investors continue to see what outcome may be as both the US and China continue strike a trade deal, while UK Prime Minister Boris Johnson’s request for an election on 12 December is on the cards IF the EU decides on Friday to grant an extension on Brexit.
· Crude oil continues to climb, while Dr Copper was marginally softer with BHP expected to open stronger after ending its US session up an equivalent of 0.25% from Australia’s previous close.
· The September SPI Futures is indicating the ASX 200 to open 48 points higher, towards the 6745 level this morning.
Have a great day!
James & the Market Matters Team
Disclosure
Market Matters may hold stocks mentioned in this report. Subscribers can view a full list of holdings on the website by clicking here. Positions are updated each Friday, or after the session when positions are traded.
Disclaimer
All figures contained from sources believed to be accurate. All prices stated are based on the last close price at the time of writing unless otherwise noted. Market Matters does not make any representation of warranty as to the accuracy of the figures or prices and disclaims any liability resulting from any inaccuracy.
Reports and other documents published on this website and email (‘Reports’) are authored by Market Matters and the reports represent the views of Market Matters. The Market Matters Report is based on technical analysis of companies, commodities and the market in general. Technical analysis focuses on interpreting charts and other data to determine what the market sentiment about a particular financial product is, or will be. Unlike fundamental analysis, it does not involve a detailed review of the company’s financial position.
The Reports contain general, as opposed to personal, advice. That means they are prepared for multiple distributions without consideration of your investment objectives, financial situation and needs (‘Personal Circumstances’). Accordingly, any advice given is not a recommendation that a particular course of action is suitable for you and the advice is therefore not to be acted on as investment advice. You must assess whether or not any advice is appropriate for your Personal Circumstances before making any investment decisions. You can either make this assessment yourself, or if you require a personal recommendation, you can seek the assistance of a financial advisor. Market Matters or its author(s) accepts no responsibility for any losses or damages resulting from decisions made from or because of information within this publication. Investing and trading in financial products are always risky, so you should do your own research before buying or selling a financial product.
The Reports are published by Market Matters in good faith based on the facts known to it at the time of their preparation and do not purport to contain all relevant information with respect to the financial products to which they relate. Although the Reports are based on information obtained from sources believed to be reliable, Market Matters does not make any representation or warranty that they are accurate, complete or up to date and Market Matters accepts no obligation to correct or update the information or opinions in the Reports. Market Matters may publish content sourced from external content providers.
If you rely on a Report, you do so at your own risk. Past performance is not an indication of future performance. Any projections are estimates only and may not be realised in the future. Except to the extent that liability under any law cannot be excluded, Market Matters disclaims liability for all loss or damage arising as a result of any opinion, advice, recommendation, representation or information expressly or impliedly published in or in relation to this report notwithstanding any error or omission including negligence.


