Are the Telco’s waking from their slumber? (700 HK, TPG, TLS, VOC, CNU, SPK)
LOCAL REPORTING CALENDAR: CLICK HERE **Please note, data sourced from Bloomberg, not all ASX companies are on this list and dates can vary**
Today we have a long list of results – best to click the link above. I have covered ANN, HUB, NAN, IGL, BKL, BIN in the recording below. Both IGL & BIN look strong.

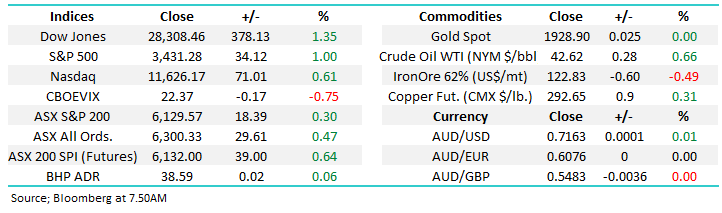
The ASX200 recovered from early (small) losses to close up +0.3% on Monday courtesy of a 2:1 victory for the winners over losers, if only the influential banking sector could regain some confidence and we’d be talking about the 6500 level, as opposed just 6200. The mixture of company news and reporting season is continuing to add a definite tailwind to local stocks - this time as we kicked off a new week 6% of the index advanced by 5% or more while only NIB (NHF) fell by the same margin.
Asian equities powered ahead helped by US S&P500 futures trading at yet another fresh all-time high during our time zone - what’s not to like in equities land? If investor’s simply don’t listen to the news and watch the money flow through stocks it would be hard not to be fully invested, unfortunately it’s hard to avoid the press or listen / watch the news without hearing how dire things are on both the economic and humanitarian front. I know it sounds back to front but history tells us that until things finally look & feel good, probably with a vaccine approaching production, the stock market will probably continue to “climb its increasing wall of worry”.
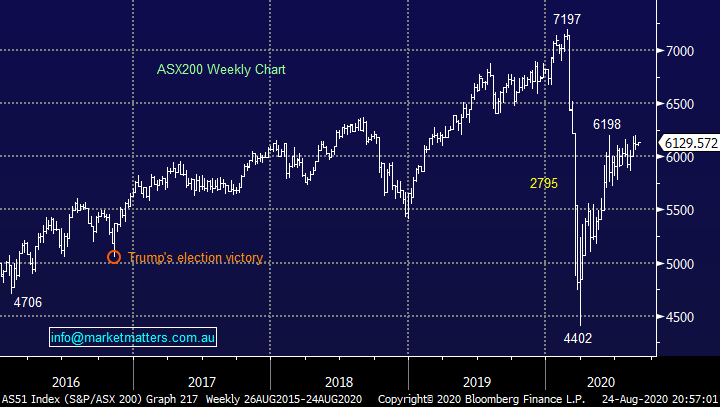
At MM we’ve been basically fully invested since March’s sobering plunge, our intention remains to slightly take our foot off the gas into an anticipated punch above 6200 but we wont be in a hurry, we can see the upside momentum easily challenge the 6500 area especially if we get a decent bout of short covering and FOMO (fear of missing out). We’re already seeing signs of this style of price action percolating through as stocks surge higher after reports that are just ok to good. Interestingly, there have seen more beats than misses, particularly outside of the traditional large caps and while guidance remains allusive for FY21, in many cases the first couple of months of FY21 have been very strong.
MM remains bullish the ASX200 medium & short-term.
ASX200 Index Chart
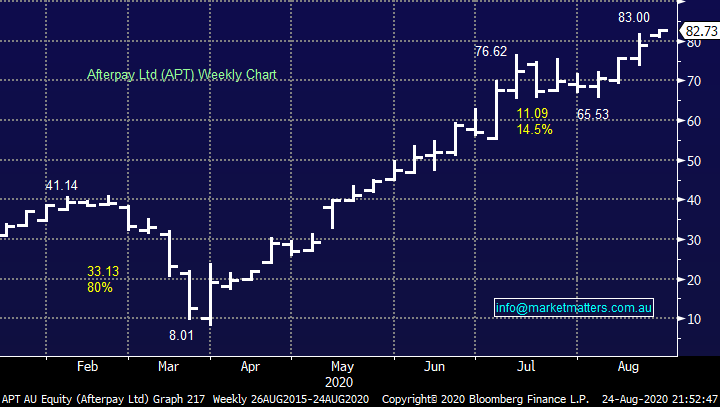
Monday was a rare day when BNPL heavyweight Afterpay (APT) took a back seat in the hot sector although it did still rally +4.8% however when ZIP (Z1P) surges over +13% it’s hard to compete. We believe this is a bull market wave to ride with our initial target for APT ~$90 but we believe the odds favour a decent 20-30% correction at some stage in 2020 hence the risk reward is slowly diminishing i.e. I felt the reaction to the news around their purchase of Spanish credit provider Pagantis was fairly muted yesterday, understandable given they only have about 150k customers (APT adds about 20k per day organically) however it does signal an entry into Europe which has been flagged, remember they just raised $1bn to underpin growth which includes through acquisition.
MM is bullish APT initially looking for another 10-15% upside.
Afterpay Ltd (APT) Chart
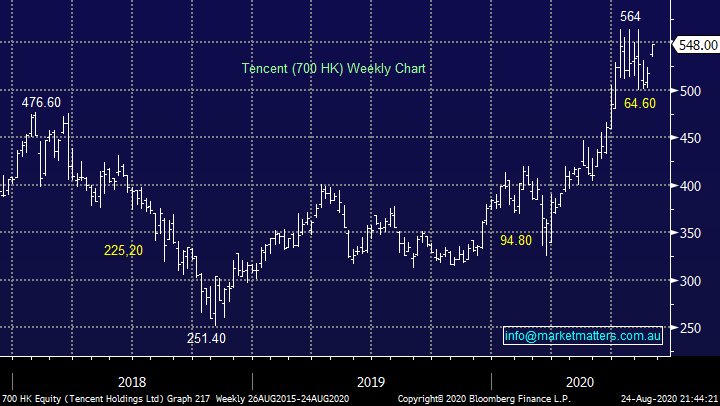
Yesterday saw Asian heavyweight Tencent (700 HK) rally almost 6% higher or $54bn after the US reassured investors around WeChat plus they are close to taking the gaming firm Leyou private. President Trump may have knocked the stock over 10% a few weeks ago but it’s coming back stronger than ever, another example of a news driven correction providing a buying opportunity in today’s market.
MM remains long & bullish Tencent initially targeting ~$700HKD.
Tencent (700 HK) Chart
Overseas Indices & markets
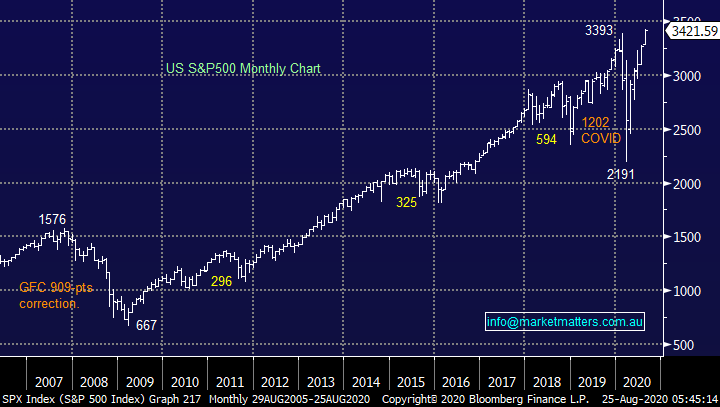
Overnight US stocks rallied strongly to fresh all-time highs, the major index the S&P500 has now rallied over 56% from its March low, a very impressive performance whatever the economic and social backdrop. As we’ve said previously this is a bull market where the most prudent action over the last 5-months has been to buy pullbacks, its averaged one a month since March and MM sees no reason this rhythm won’t continue into Christmas. Importantly investors should note that the last time the S&P500 broke out to fresh high in April 2019 it rallied for 8-months before having its ascent halted by the global pandemic i.e. our call of an ongoing rally for 12-18 months is simply nothing unusual, particularly after the scale and magnitude of the washout we have just experienced.
MM remains bullish US stocks medium-term.
US S&P500 Index Chart
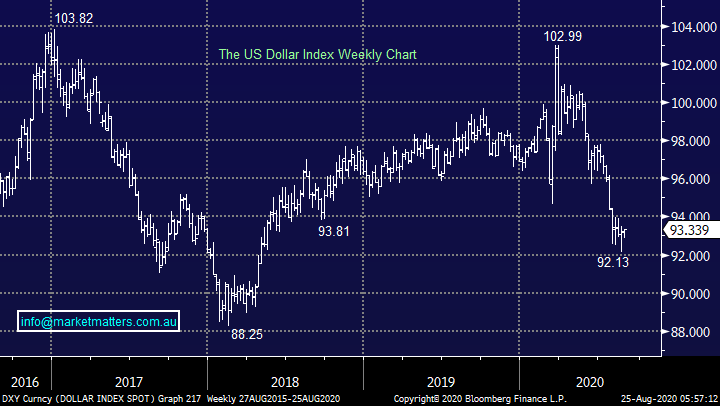
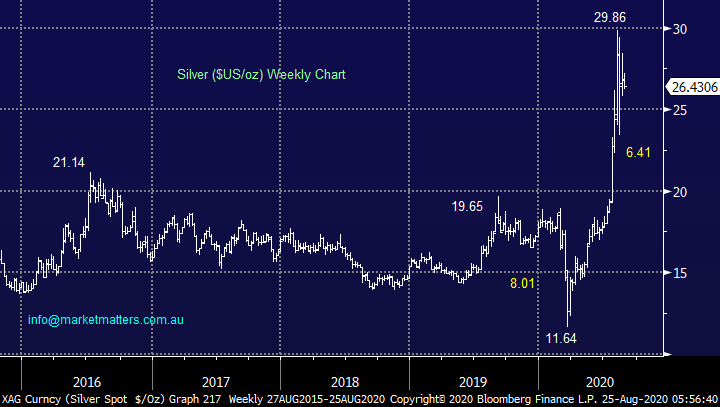
Overnight we also saw the $US recover from early losses sending the likes of gold and silver into reverse, albeit it in a mild way. Our call with the most conviction in the short-term is the $USD will bounce sending precious metals and most commodities lower in the near term i.e. a short-term pullback in resources creating an opportunity to accumulate in the weeks ahead.
MM remains bullish precious metals medium-term.
The $US Index Chart
Silver ($US/oz) Chart
Are we seeing some opportunities in the Telco’s?
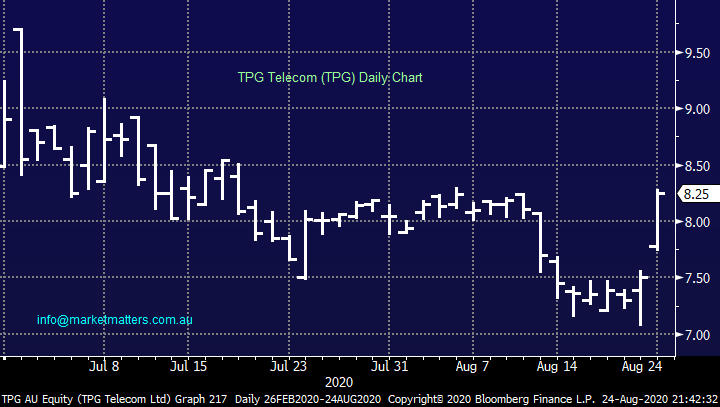
Yesterday we saw TPG Telecom (TPG) rally an impressive 10%, it appears the market has favourably digested last week’s half year result which gave an insight into Vodafone’s business at the end of last financial year. We now effectively have a new vehicle in the sector since the merger of Vodafone and TPG, no forward guidance was provided from TPG last week but that’s not unusual in today’s market. Clearly their focus is now on the amalgamation of the two businesses, a potentially tricky task however I can’t help but think the ACCC’s concerns around competition is a positive sign for the amalgamated group.
On balance we like TPG although its early days, if I was looking at the stock as a trade, I would use stops under $7.50. Overall yesterday’s pop felt like another example of a company that delivered an ok result which allowed the many cashed up investors justification to jump on board – there’s plenty of cash on the sidelines but its scarred of walking on landmines.
MM is neutral to bullish TPG.
TPG Telecom (TPG) Chart
After yesterday’s strong performance by TPG we thought today was an opportune time to revisit the other 4 stocks in the sector which is not quite as top heavy since TPG’s merger e.g. Telstra’s (TLS) market cap is currently $36bn compared TPG’s at $15bn.
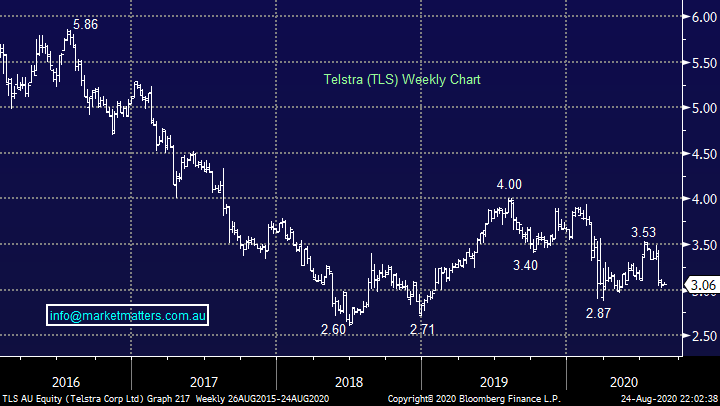
1 Telstra (TLS) $3.06.
Sector heavyweight TLS continues to languish even in a relatively strong market. Earlier in the month the company delivered its full-year earnings and they went down poorly helping the stock decline well over 10% in recent weeks. TLS reported an almost 6% decline of income to $26.2bn in FY20 which dropped down to EBITDA the low end of guidance at $7.4bn. The combination of the virus and NBN appear to be weighing on the stock, at this stage there’s nothing particularly exciting about TLS with the sidelines feeling the best place.
MM is neutral TLS.
Telstra (TLS) Chart
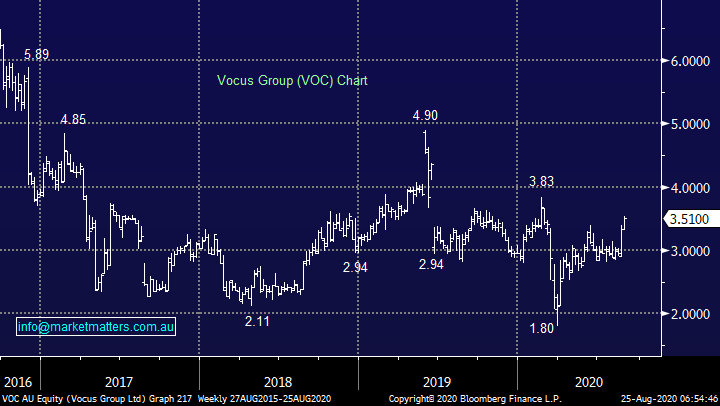
2 Vocus (VOC) $3.51
Vocus (VOC) is breaking out of its recent trading range as it enjoys some follow through after its report last week. In its FY20 numbers we saw reoccurring revenue in excess of $1.75bn while retail struggled fibre / network improved. We particularly like the strong network services business which grew 10% over the year and the company has a great position in a number of key high margin areas, including NZ. We are with the CEO that VOC is on track with its 3-year business turnaround.
We like VOC and can comfortably see the stock 30-40% higher, for those understandably concerned that the stock will return to its old ways technical stops can be used below $3.25, only 7.5% risk.
MM is bullish VOC.
Vocus (VOC) Chart
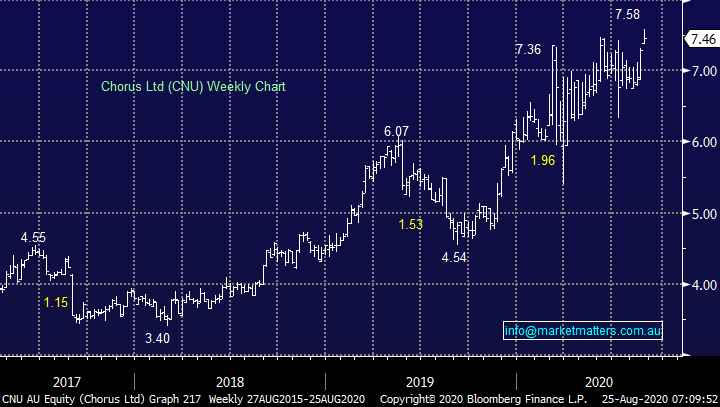
3 Chorus (CNU) $7.46.
CNU is NZ’s largest fixed line communications infrastructure business which has performed strongly for the last few years. This is undoubtedly a solid stock, but the risk / reward is not exciting around $7.50.
MM is neutral / bullish CNU.
Chorus (CNU) Chart
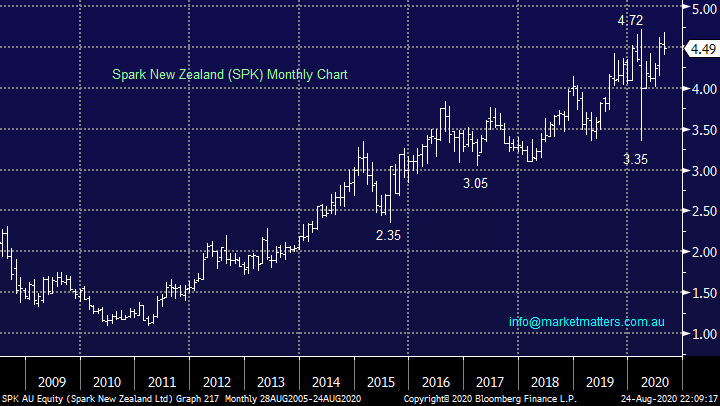
4 Spark New Zealand (SPK) $4.49.
New Zealand based SPK provided the market with a positive update a few days ago reaffirming its positioned well to meet its FY20 guidance. The companies looking for EBITDA of $NZ 1.1-1.2bn also the stocks on track to yield over 5% which is excellent in today’s environment and one heck of a support. We’re not excited by the stock around $4.50 but I cannot see it falling much further.
MM is neutral to bullish SPK.
Spark New Zealand (SPK) Chart
Conclusion
Of the 5 stocks briefly looked at today MM particularly likes Vocus (VOC).
Have a great day!
James & the Market Matters Team
Disclosure
Market Matters may hold stocks mentioned in this report. Subscribers can view a full list of holdings on the website by clicking here. Positions are updated each Friday, or after the session when positions are traded.
Disclaimer
All figures contained from sources believed to be accurate. All prices stated are based on the last close price at the time of writing unless otherwise noted. Market Matters does not make any representation of warranty as to the accuracy of the figures or prices and disclaims any liability resulting from any inaccuracy.
Reports and other documents published on this website and email (‘Reports’) are authored by Market Matters and the reports represent the views of Market Matters. The Market Matters Report is based on technical analysis of companies, commodities and the market in general. Technical analysis focuses on interpreting charts and other data to determine what the market sentiment about a particular financial product is, or will be. Unlike fundamental analysis, it does not involve a detailed review of the company’s financial position.
The Reports contain general, as opposed to personal, advice. That means they are prepared for multiple distributions without consideration of your investment objectives, financial situation and needs (‘Personal Circumstances’). Accordingly, any advice given is not a recommendation that a particular course of action is suitable for you and the advice is therefore not to be acted on as investment advice. You must assess whether or not any advice is appropriate for your Personal Circumstances before making any investment decisions. You can either make this assessment yourself, or if you require a personal recommendation, you can seek the assistance of a financial advisor. Market Matters or its author(s) accepts no responsibility for any losses or damages resulting from decisions made from or because of information within this publication. Investing and trading in financial products are always risky, so you should do your own research before buying or selling a financial product.
The Reports are published by Market Matters in good faith based on the facts known to it at the time of their preparation and do not purport to contain all relevant information with respect to the financial products to which they relate. Although the Reports are based on information obtained from sources believed to be reliable, Market Matters does not make any representation or warranty that they are accurate, complete or up to date and Market Matters accepts no obligation to correct or update the information or opinions in the Reports. Market Matters may publish content sourced from external content providers.
If you rely on a Report, you do so at your own risk. Past performance is not an indication of future performance. Any projections are estimates only and may not be realised in the future. Except to the extent that liability under any law cannot be excluded, Market Matters disclaims liability for all loss or damage arising as a result of any opinion, advice, recommendation, representation or information expressly or impliedly published in or in relation to this report notwithstanding any error or omission including negligence.


