Are the telco’s about to soar again? (TPM, TLS, VOC)
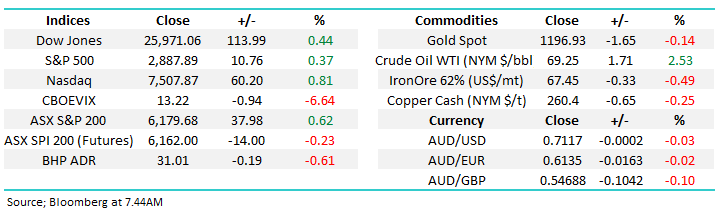
The ASX200 enjoyed a solid bounce yesterday but considering the weakness that’s unfolded so far this September +0.6% is nothing to get too excited about. The banks and Telstra (TLS) led the gains while weakness was patchy as opposed to sector / stock specific. Following yesterday’s decline the Hang Seng has now fallen over 20% from its February high putting Hong Kong’s index officially into a bear market – this was many pundits favourite index for 2018.
We still believe both the emerging markets and US - China trade concerns have a strong likelihood of a further negative influence on stocks in the coming weeks. However, last night the US “Fear Index” (VIX) fell -6.6% implying investors in the US are extremely comfortable with stocks at present.
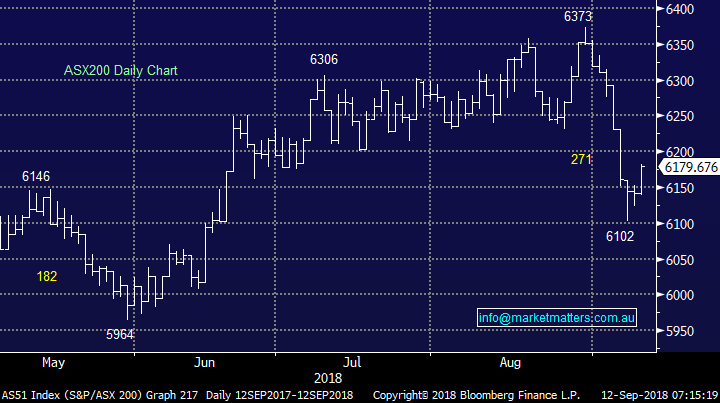
· MM remains negative the ASX200 with an ideal target ~5800.
Overnight stocks recovered well from early losses with the US S&P500 rallying +0.37% while Europe was largely flat. The SPI futures are calling the ASX200 to open down ~13-points this morning.
Today’s report is going to again look at the Australian telco’s following their strong rally yesterday for no apparent reason – except of course fund managers feel underweight.
At MM we now have 7% & 5% of the Platinum / Income Portfolio’s respectively in Telstra (TLS) - this is one sector we are watching particularly carefully.
ASX200 Chart
Don’t ignore the currencies
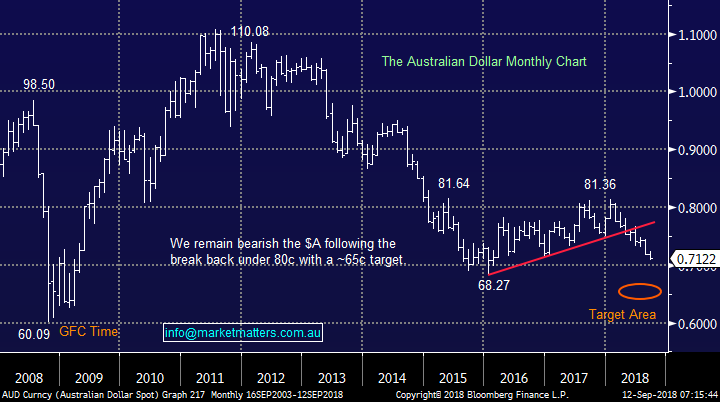
The $A continues to drift lower hitting fresh multi-month lows while I type (last night). The huge support area of 68.27 plumbed in early 2016 is now less than 4% away. We are ultimately targeting the mid 60c region but do feel a counter trend bounce is not too far away.
· MM remains bearish the $A targeting an eventual break below 68c – we are short via the BetaShares ETF.
The Australian Dollar ($A) Chart
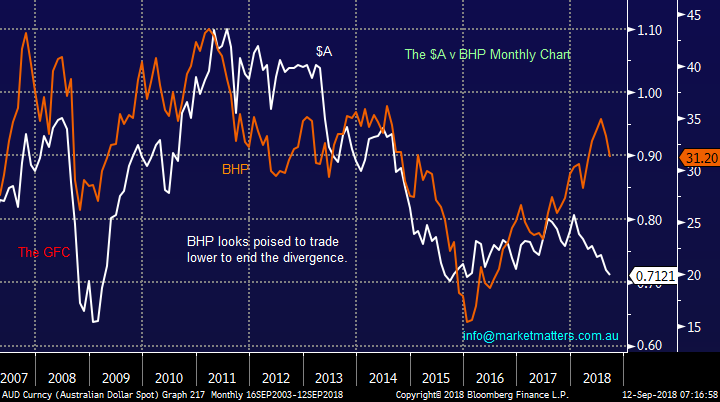
If we are correct on the $A the correlation with our resources sector is very concerning i.e. the likes of BHP usually follow the Aussie.
· Investors should not underestimate how far our resource stocks can fall if they agree with our bearish view on the $A.
We touched on when to buy the resource’s in yesterday’s afternoon report following JP Morgan’s comment “Unless you think there’s a recession right around the corner, mining stocks are a buying opportunity following their recent sell-off.”.
However the below chart makes us believe that patience remains the investors friend with regard to the resources in general.
· MM plans to stick with our plan of the last 6-months i.e. Buy BHP under $30 i.e. around 5% lower.
The Australian Dollar ($A) v BHP Billiton (BHP) Chart
The Telco’s, still value?
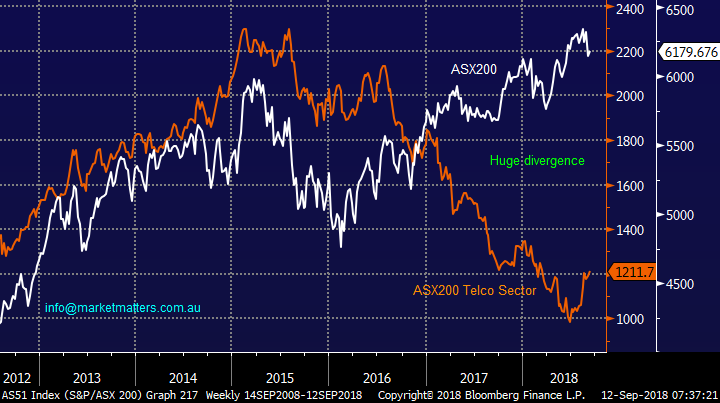
The telco sector is by far the best performer on the ASX200 over the last month i.e. gaining +31.2% while the index is down -1.6% - it’s clearly an impressive stat and one that the bulk of talking heads certainly did not predict! The merger of TPG Telecom (TPM) and Vodafone was the catalyst to ignite the sector as investors decided that a discounting war is now less likely.
Its very easy to say that “the Telco’s have enjoyed their bounce, it’s time to sell and move on” but the below chart illustrates the sectors underperformance over the last few years remains very pronounced and this month’s rally is only a “blip” on the radar. The “shorters” in the sector have certainly felt the heat with decent short covering especially evident in TPG Telecom (TPM).
Shorts in the sector – Telstra (TLS) 1.31%, TPG Telecom (TPM) 3.46% and Vocus (VOC) 9.33% - TPM’s short position has fallen by 2.35% over the last month.
While the short covering in TPM clearly has aided the stock we feel that the rally in TLS has largely been fuelled by a hugely underweight professional market i.e. retail investors not fund managers are long. History tells us that the Telcos perform well in a market downturn / recession which is not a bad quality at this stage of the economic & stock market cycles.
ASX200 v Australian Telco Sector Chart
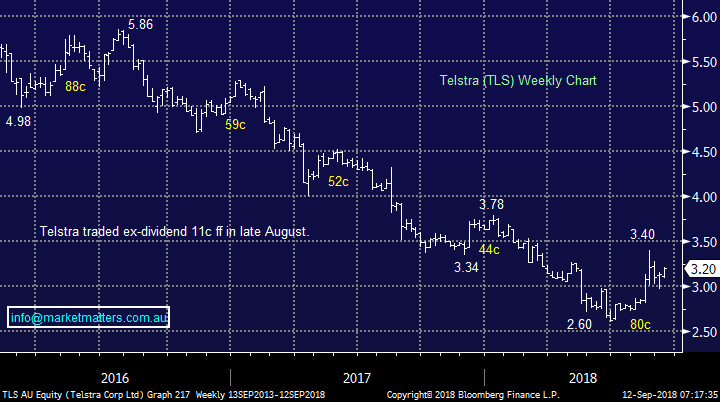
1 Telstra (TLS) $3.20
TLS is up 14% over the last month and is trading 23% above its June low, plus it traded ex-dividend 11c fully franked in late August.
TLS is now trading on an EST P/E of 15.2x for 2019 while yielding 6.87% fully franked – clearly less compelling than the 9x it was trading on in June. We can see TLS trading between $3 and $3.50 for the next few months with risks on the upside.
Telstra is now the 10th largest stock in the ASX200 with a 2% weighting hence our holdings are significantly overweight at this point in time.
· We will consider trimming our Growth Portfolio position from 7% to 5% closer to $3.50, or 8-9% higher.
Telstra (TLS) Chart
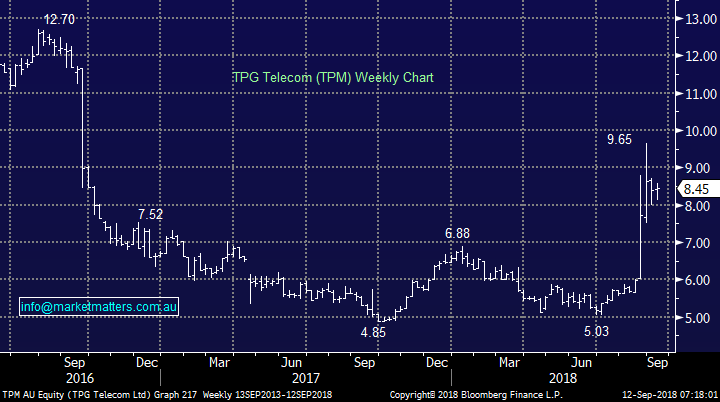
2 TPG Telecom (TPM) $8.45
TPM has been the outstanding winner in both the market and sector soaring almost 50% over the last month with large short covering certainly assisting the move.
The announced merger between TPM and Vodafone should create a company with better financial clout to compete with Telstra and Optus while potentially increasing margins across the sector i.e. 3 not 4 companies fighting for market share reducing the likelihood of an aggressive price war. Overall we believe it’s a great move for both the stock and sector but a 50% rally has already built in a significant benefit for TPM.
TPM is now trading on an EST P/E of 19.1x for 2018 while yielding 0.47% fully franked.
· MM is now neutral TPM and want to watch the merger with Vodafone unfold.
TPG Telecom (TPM) Chart
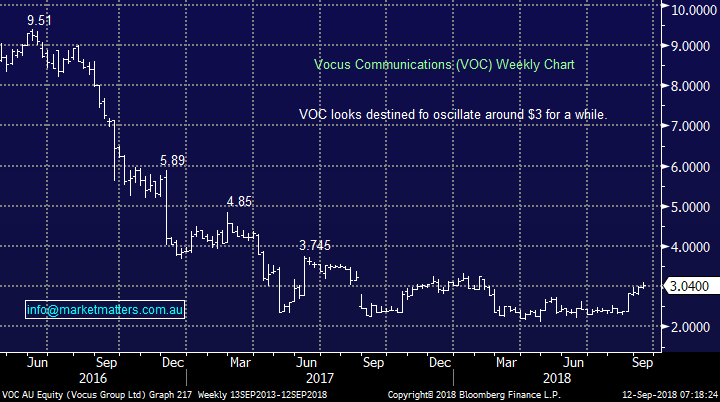
3 Vocus (VOC) $3.04
VOC is the company that’s largely remained in the doldrums and its huge 9.3% short position illustrates that professional investors remain bearish the stock – it’s still the 14th most shorted stock on the market.
We don’t regard VOC as an investment grade stock compared to its peers given some balance sheet issues but it may offer a good risk / reward trade into a pullback. On the flipside, if they are dragged higher from here, we’d be surprised if the company didn’t tap into the improving ‘vibe’ in the sector and raise capital to repair the balance sheet.
VOC is now trading on an EST P/E of 17.3x for 2019
· MM likes VOC as a trade around $2.80 with stops under $2.65.
Vocus (VOC) Chart
Conclusion
We remain bullish TLS, especially when compared to the overall index.
However we may consider trimming our 7% holding back to 5% in our Growth Portfolio around the $3.50 level.
Overseas Indices
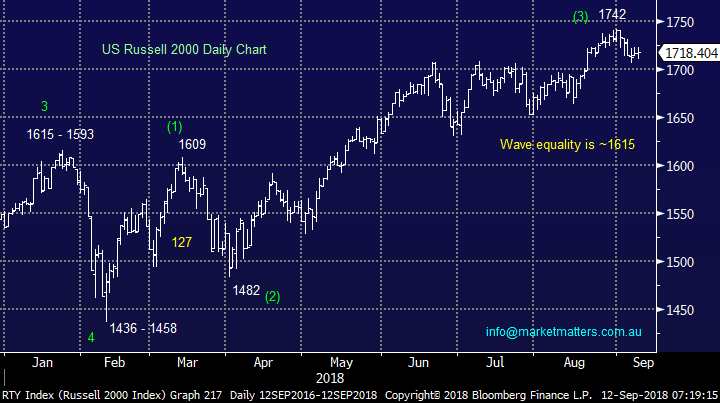
US stocks remain strong and I read one trader state this morning “they are defying gravity”, perhaps we are all wrong and they are gaining strength before another leg higher – we must remain open minded.The US index we are focusing on the most at present is the Russell 2000 and it was basically unchanged last night.
Ideally we are targeting a pullback towards 1615 but there are no signals while it holds above 1700.
US Russell 2000 Chart
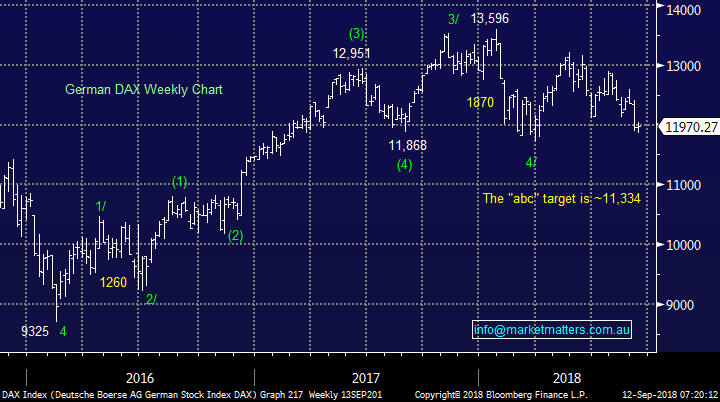
European indices were very quiet last night leaving our bearish view intact.
The target for the German DAX remains ~5% lower.
German DAX Chart
Overnight Market Matters Wrap
· The US had a solid session overnight, with all 3 major indices ending the day in positive territory, led by the tech sector ahead of Apple releasing its new iPhone models.
· US bond yields also remained under pressure in the wake of the higher wage inflation numbers of 2.9%. 10-year yields sold off below 3% and 2-year yields hit decade highs on expectations of further rate hikes, fuelled by the higher inflation expectations.
· A weaker base metals complex however is expected to weigh on the local market as trade war fears continue to affect sentiment. Aluminium, copper and iron ore were all lower. The oil price jumped, with crude up 2.53% as Hurricane Florence threatened US east coast oil supplies and sanctions on Iranian supplies also start to bite.
· The September SPI Futures is indicating the ASX 200 to open 13 points lower, towards the 6165 level this morning.
Have a great day!
James & the Market Matters Team
Disclosure
Market Matters may hold stocks mentioned in this report. Subscribers can view a full list of holdings on the website by clicking here. Positions are updated each Friday, or after the session when positions are traded.
Disclaimer
All figures contained from sources believed to be accurate. Market Matters does not make any representation of warranty as to the accuracy of the figures and disclaims any liability resulting from any inaccuracy. Prices as at 12/09/2018
Reports and other documents published on this website and email (‘Reports’) are authored by Market Matters and the reports represent the views of Market Matters. The MarketMatters Report is based on technical analysis of companies, commodities and the market in general. Technical analysis focuses on interpreting charts and other data to determine what the market sentiment about a particular financial product is, or will be. Unlike fundamental analysis, it does not involve a detailed review of the company’s financial position.
The Reports contain general, as opposed to personal, advice. That means they are prepared for multiple distributions without consideration of your investment objectives, financial situation and needs (‘Personal Circumstances’). Accordingly, any advice given is not a recommendation that a particular course of action is suitable for you and the advice is therefore not to be acted on as investment advice. You must assess whether or not any advice is appropriate for your Personal Circumstances before making any investment decisions. You can either make this assessment yourself, or if you require a personal recommendation, you can seek the assistance of a financial advisor. Market Matters or its author(s) accepts no responsibility for any losses or damages resulting from decisions made from or because of information within this publication. Investing and trading in financial products are always risky, so you should do your own research before buying or selling a financial product.
The Reports are published by Market Matters in good faith based on the facts known to it at the time of their preparation and do not purport to contain all relevant information with respect to the financial products to which they relate. Although the Reports are based on information obtained from sources believed to be reliable, Market Matters does not make any representation or warranty that they are accurate, complete or up to date and Market Matters accepts no obligation to correct or update the information or opinions in the Reports. Market Matters may publish content sourced from external content providers.
If you rely on a Report, you do so at your own risk. Past performance is not an indication of future performance. Any projections are estimates only and may not be realised in the future. Except to the extent that liability under any law cannot be excluded, Market Matters disclaims liability for all loss or damage arising as a result of any opinion, advice, recommendation, representation or information expressly or impliedly published in or in relation to this report notwithstanding any error or omission including negligence.


