Are some local fund managers becoming too cheap? (MFG, PPT, PDL, CGF, AMP)
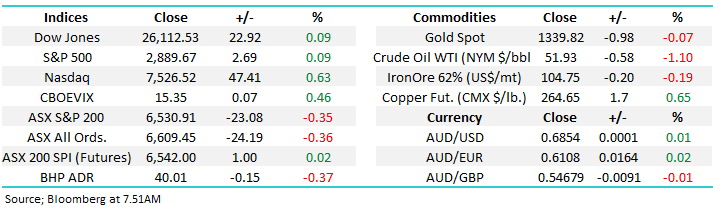
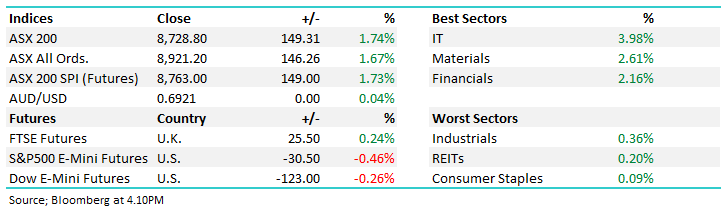
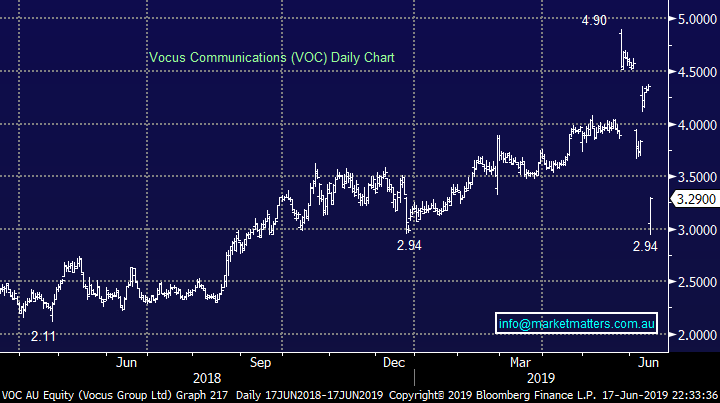
The ASX200 had a disappointing start to the week finally closing down -0.35% after only managing a few minutes in the green just after lunch. The relatively weak performance was amplified by local stocks ignoring a positive lead from both Asian indices and by US futures. However we actually outperformed that runaway train NZ equities which fell -0.6%, perhaps a little “profit taking” simply hit our little region. On the sector level the Energy and Resources groups dragged the chain assuming we ignore the 24% plunge by Vocus (VOC) and subsequent fall by the Telco sector.
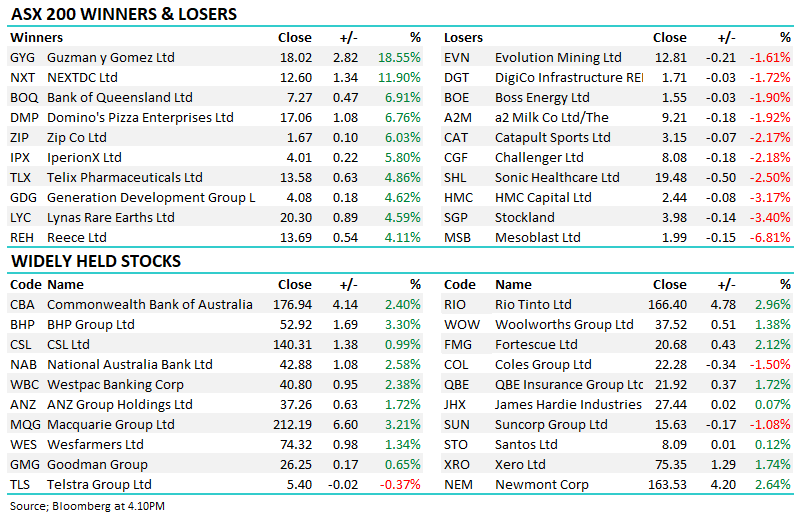
Under the hood less than a 1/3 of the ASX200 closed up for the session which confirms the “look & feel” of the day which actually felt worse than the final points finish. When we see stocks like Emeco Holdings (EHL) and Nanosonics gain over 10% on average while Pilbara Minerals (PLS) and Afterpay (APT) fell an average of 8% its hard for sceptics not to agree with MM’s active approach looking to be in the correct stocks and sectors, as opposed to simply “buying the market” – all we have to do is get it right!
Iron ore is also feeling a little tired at present which should come as no surprise to investors after its tremendous rally in 2019, its only corrected ~5% over the last 3-days but with BHP, RIO and Fortescue (FMG) such large influences on the ASX200 it does create a slight headwind. We reiterate that we like the stocks but are considering taking some money from our BHP position into ongoing strength – the iron ore party like most periods of exuberance won’t go on indefinitely.
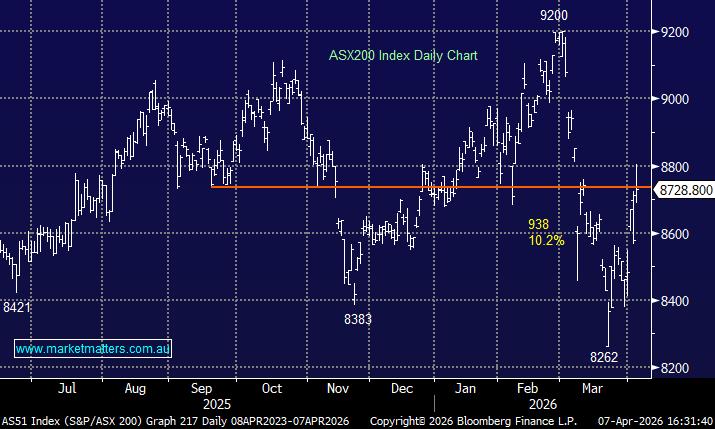
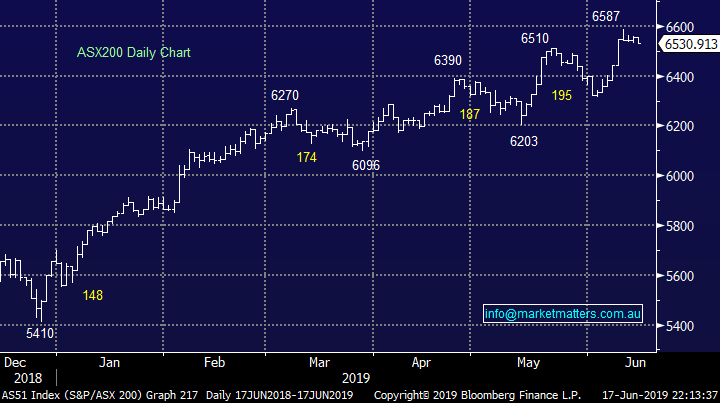
MM is neutral to bullish the ASX200 following its test of the 6600-area but we remain bullish global equities for now.
Overnight US stocks were quiet with the Dow closing up just 22-points while the SPI futures are calling the ASX200 to open up around 10-points, back at the level before what appeared to a late portfolio selldown into yesterdays close.
In today’s report we have revisited the struggling fund manager space which has endured some horrible moves over the last 3-months like Challenger (CGF) -18.2% and Pendal Group (PDL) -19.1%.
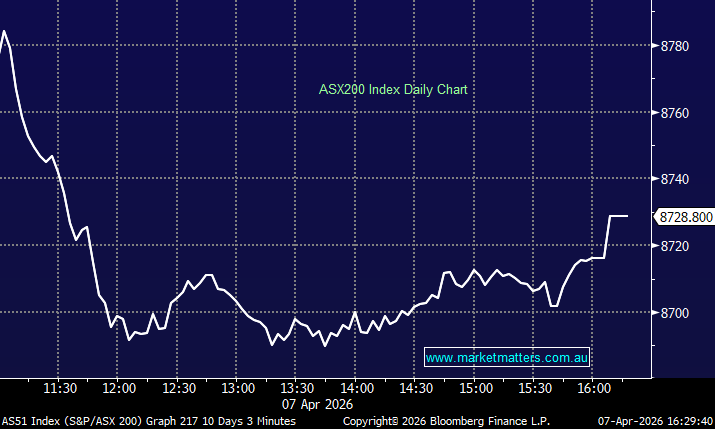
ASX200 Chart
Yesterday saw AGL Energy (AGL) walk away from a deal that we thought might actually go ahead but our perceived risk / reward around the deal fortunately didn’t warrant a position. Following 2 suitors walking away from their respective bids early on in their due diligence periods it’s hard not to become wary of potential skeletons in the closet.
MM has placed VOC in the too hard basket.
Vocus Communications (VOC) Chart
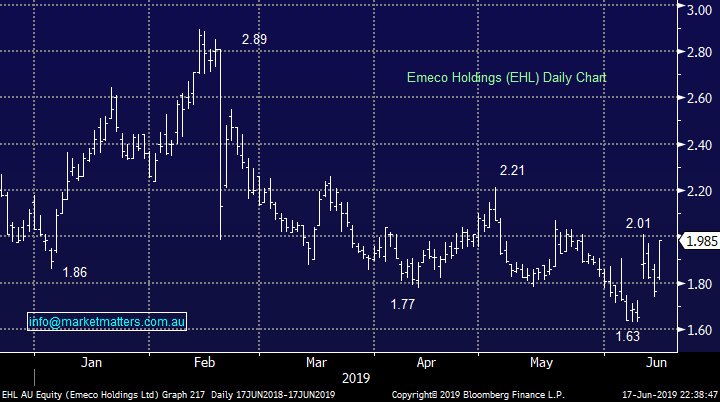
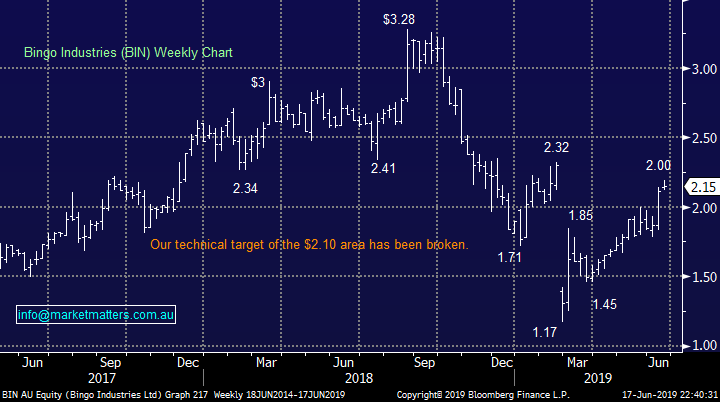
In Mondays questions a few subscribers were interested in our “dogs” Bingo (BIN) and Emeco (EHL) and after yesterday’s performance they are again worth a mention just in case anybody missed Harrys coverage in Monday’s pm report:
1 Emeco Holdings (EHL) up +12.5% to $1.98 – Paradice Investment increased their holding by 5m shares, a popular manager like David Paradice can have that effect on a stock and we see another 10% upside before we will re-evaluate but it “feels right” for now.
2 Bingo Industries (BIN) up +1.9% to $2.15 – It may take some effort to punch through the $2.20-30 area but a $75m buyback that’s only 10% complete should at least underpin the stock.
MM remains bullish both EHL and BIN.
Emeco Holdings (EHL) Chart
Bingo (BIN) Chart
Are the fund managers showing value as the ASX200 tests fresh decade highs?
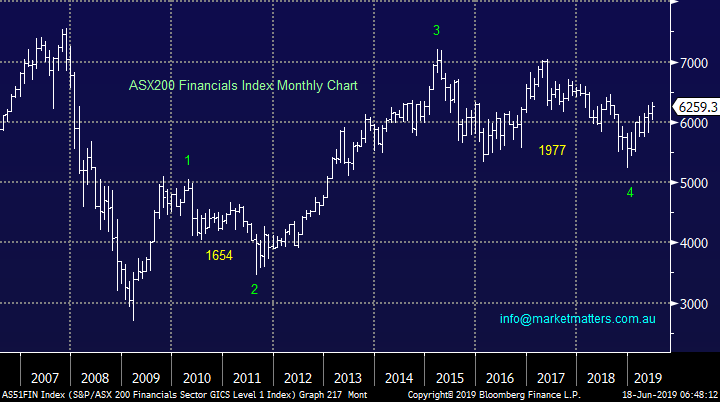
There are times when a chart from a technical analysis perspective looks so good that we sit up and take notice and the Financials Index is currently a great example targeting another 15-20% upside. However its important to understand this index also includes our banks and insurers so its far from perfect as an indicator for the embattled fund managers but at least it’s encouraging.
Over the last 3-months while the ASX200 has rallied to fresh decade highs we’ve seen the fund mangers continue to fall under a number of headwinds from declining funds under mgt. (FUM) to regulatory issues, the question is are they ready to bounce just like the banks in 2019. In most cases their valuations are pushing high levels of pessimism but its been like that for a while so a catalyst may be needed to reignite the sector, it could be simply the very same fund managers sitting on cash looking for a home that’s not too expensive.
Today we have looked at 5 stocks starting with the star performer Magellan (MFG) and finishing with the perennial “dog” AMP Ltd (AMP). We have left out Janus (JHG) and Platinum (PTM) from the motley group simply because we have touched on them in recent weeks.,
ASX200 Financials Index Chart
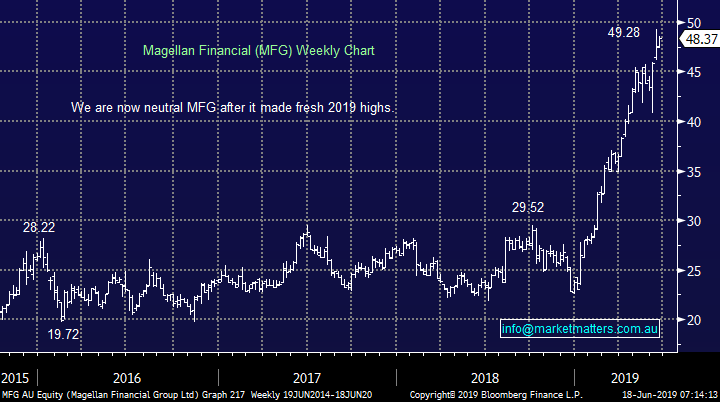
1 Magellan (MFG) $48.37
MFG is a wonderful success story not just of the sector but also the whole market, Hamish Douglass has kicked more than a few goals with this international equities group – in May alone the business enjoyed inflows above $260m.
The business benefits from a weak $A and when combined with the stellar track record it has taken the business to the next level in 2019, the companies P/E for 2019 of 25.5x is relatively rich for the sector but deserved at this point in time - its yield of 3.4% part franked, like much of our market, is way above term deposits. However following the markets re-rating of the business its share price in our opinion will now be largely dictated by the performance of global equity markets i.e. a higher market = greater FUM and hence larger fees.
The stocks been the clear go to in the sector this year as investors have remained understandably scarred to take on the other cheaper but higher risk members of the group. This has pushed its PE to 23.8x forward, just a shade below its all-time P/E high of 24.1x and 5 year average or 18.7x . Hence while we like the stock our perceived risk / reward buy level is in the low $40 region. Priced off its average 5 year P/E, MFG is worth ~$38.
MM likes MFG but around 10% lower.
Magellan (MFG) Chart
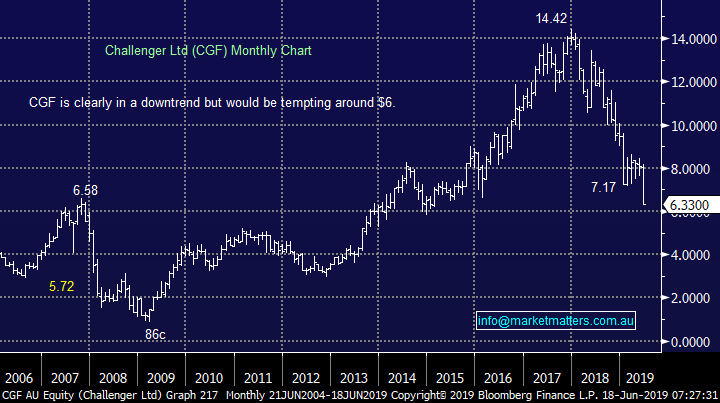
2 Challenger (CGF) $6.33
The elastic band of pessimism is stretching for CGF which has been smashed this month following a guidance revision to the downside with normalized net profit to now be $545m to $565m – the markets over 20% drubbing of the stocks is now building in a fairly tough few years ahead. The downgrade related in part to poor investment returns across the business. The Funds Management chief was recently “moved on” always an ominous sign plus the shift to selling more annuity products has created a longer term earnings model, it has also forced Challenger to change its investment mix, moving down the risk curve in more conservative but less lucrative investments.
Not a place we want to be at the moment, and it won’t be helped by lower interest rates and higher costs within the business. This is business very leveraged to external factors and those external factors have been a headwind in recent times. I still remember when CGF traded below $1 during the GFC!
Looking longer term though, and if we do see any further panic lows this may create some opportunity, after all the business does enjoy an ageing population tailwind. The stocks currently trading on a Est P/E of 11.8x for 2019 while yielding over 5% fully franked. CGF shares have more than halved over the last 18-months and it’s now clearly a candidate for “tax loss” selling, we see value emerging around 5% lower if its gets clobbered into EOFY.
We may get interested in the coming weeks below $6.
Challenger (CGF) Chart
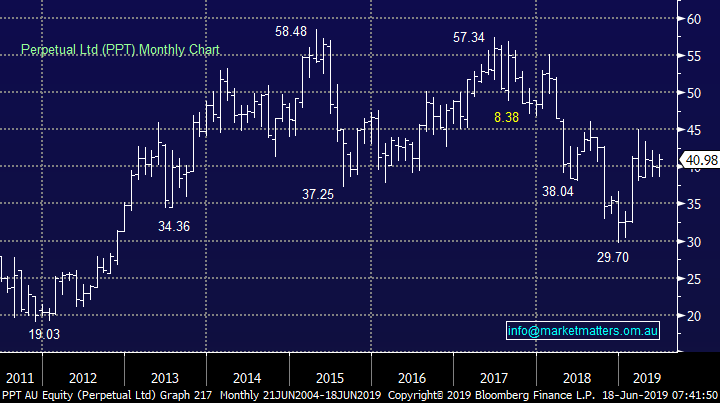
3 Perpetual Ltd (PPT) $40.98
PPT has actually enjoyed a revival of such in 2019, albeit from a low base but it does illustrate how the stocks in the sector can perform when they kick a few goals. The ASX orientated fund manager actually suffered $1.9m of outflows in Q1 of 2019 with the stocks reaction implying very limited good news is built into the company’s share price; it’s a simple game deliver poor returns and money looks for a different home.
The company obviously enjoys the tailwind of a growing Australian Super pool of money, it just needs to demonstrate it’s a good home for these funds. The stocks currently trading on an average P/E of 15.8x while it yields an attractive ~6.5% fully franked, undoubtedly a factor in the stocks resilience in 2019. Currently its trades on an average valuation, with an above average yield. Better fund performance and PPT could trade in the high $40’s
MM holds PPT in our Income Portfolio and remain comfortable to do so.
Perpetual LTD (PPT) Chart
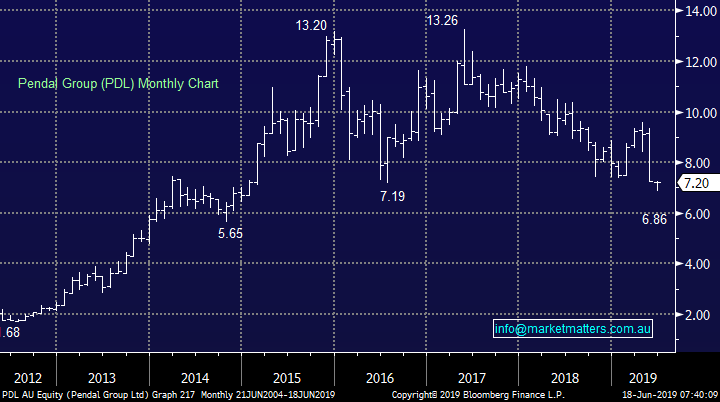
4 Pendal Group (PDL) $7.20
The Pendal Group was smacked in May following a disappointing interim result which showed a net profit of almost $85m, down over 25% on the same time last year. The blame was laid at the door of lower performance fees which crashed over 90%, they obviously struggled in a volatile market.
The stock is cheap trading on an Est P/E for 2019 of 13.7x while yielding almost 7% part franked, particularly compared to its historical average around 17x, however its weak performance is justifying the discount. We’ve seen with the likes of Janus (JHG) which trades on just 8.5x that fund managers that struggle with performance can sustained low multiples for extended periods.
MM is neutral PDL at present.
Pendal Group (PDL) Chart
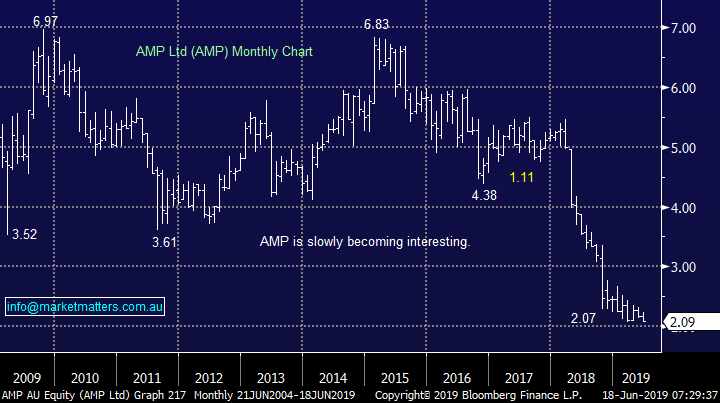
5 AMP Ltd (AMP) $2.09
What more needs to be said about AMP, if they could get it wrong they have! While the stock is cheap on an Est P/E of 10.4x while yielding 6.7% part franked, the predictability of what earnings look like in the next 12 months is low. For example, consensus profit for FY19 sits at ~$553m across 12 analysts, however the range between analysts it huge $341m to $831m at the profit line implying a lack of clarity.
Avoiding AMP has been a huge plus for MM over the years so I’m reticent to buy today but a little lower and the risk / reward will start to become interesting. Next big lick of poor news could present the opportunity.
MM thinks AMP is close to a buy as an aggressive play.
AMP Ltd (AMP) Chart
Conclusion (s)
Of the 5 stocks we looked at today none jumped out at us with CGF and AMP looking interesting if they experience aggressive EOFY selling.
At todays prices PPT is our favourite and we remain long in our Income Portfolio.
The main conclusion to MM is while the Financial Sector looks strong it doesn’t yet feel the fund managers will be a major contributor to the strength.
Global Indices
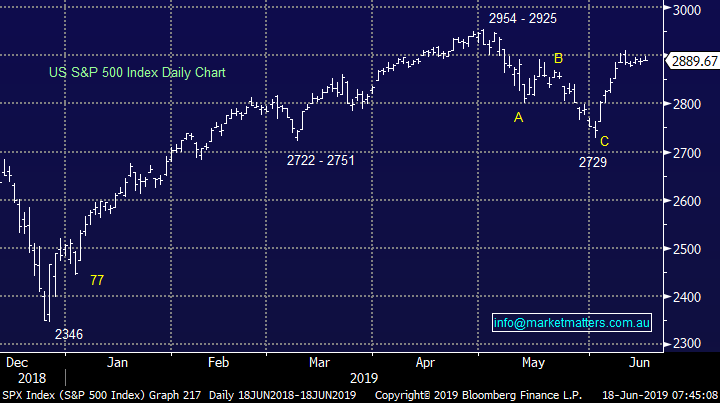
Again nothing new with our preferred scenario - the recent pullback was a buying opportunity although we are initially only looking for a test of / slight new 2019 highs from US indices.
The current dovish stance by the Fed has helped the S&P500 get within 2% of its all-time high, perhaps some positive news from this week’s G20 meeting between on trade between the US & China will create the market optimism for a test of the large psychological 3000 area.
US S&P500 Index Chart
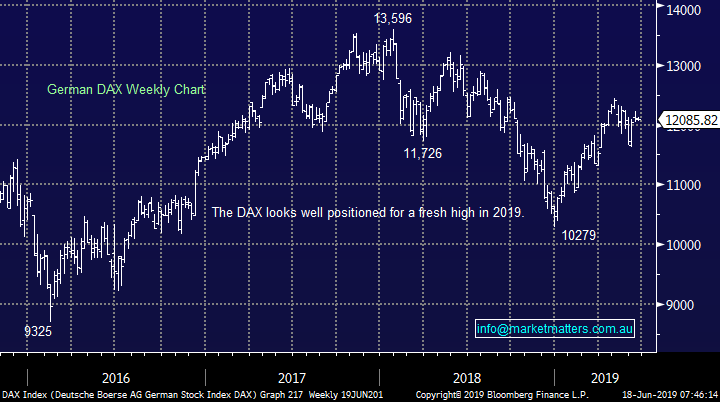
No change again with European indices, we remain cautious European stocks but the tone has improved recently and fresh highs in 2019 look a strong possibility.
German DAX Chart
Overnight Market Matters Wrap
· The US equities started the week marginally stronger, led by the tech. heavy, Nasdaq 100 as investors regain their focus on the Fed interest rate decision this Thursday, with most expecting June to be unchanged, however they seek to read in for any signal of a cut in the near future.
· Crude oil continued its descent, off 1.10% to US$51.93/bbl. as Saudi Arabia conveyed concerns that OPEC and its allies will agree to extend production cuts into the second half of the year.
· Tonight in the UK there will be a second ballot on the leadership contest to select who will succeed as the leader of the country’s ruling party.
· BHP is expected to underperform the broader market after ending its US session down 0.37% from Australia’s previous close.
· The June SPI Futures is indicating the ASX 200 to open marginally higher this morning, towards the 6540 level.
Have a great day!
James & the Market Matters Team
Disclosure
Market Matters may hold stocks mentioned in this report. Subscribers can view a full list of holdings on the website by clicking here. Positions are updated each Friday, or after the session when positions are traded.
Disclaimer
All figures contained from sources believed to be accurate. Market Matters does not make any representation of warranty as to the accuracy of the figures and disclaims any liability resulting from any inaccuracy. Prices as at 18/06/2019
Reports and other documents published on this website and email (‘Reports’) are authored by Market Matters and the reports represent the views of Market Matters. The MarketMatters Report is based on technical analysis of companies, commodities and the market in general. Technical analysis focuses on interpreting charts and other data to determine what the market sentiment about a particular financial product is, or will be. Unlike fundamental analysis, it does not involve a detailed review of the company’s financial position.
The Reports contain general, as opposed to personal, advice. That means they are prepared for multiple distributions without consideration of your investment objectives, financial situation and needs (‘Personal Circumstances’). Accordingly, any advice given is not a recommendation that a particular course of action is suitable for you and the advice is therefore not to be acted on as investment advice. You must assess whether or not any advice is appropriate for your Personal Circumstances before making any investment decisions. You can either make this assessment yourself, or if you require a personal recommendation, you can seek the assistance of a financial advisor. Market Matters or its author(s) accepts no responsibility for any losses or damages resulting from decisions made from or because of information within this publication. Investing and trading in financial products are always risky, so you should do your own research before buying or selling a financial product.
The Reports are published by Market Matters in good faith based on the facts known to it at the time of their preparation and do not purport to contain all relevant information with respect to the financial products to which they relate. Although the Reports are based on information obtained from sources believed to be reliable, Market Matters does not make any representation or warranty that they are accurate, complete or up to date and Market Matters accepts no obligation to correct or update the information or opinions in the Reports. Market Matters may publish content sourced from external content providers.
If you rely on a Report, you do so at your own risk. Past performance is not an indication of future performance. Any projections are estimates only and may not be realised in the future. Except to the extent that liability under any law cannot be excluded, Market Matters disclaims liability for all loss or damage arising as a result of any opinion, advice, recommendation, representation or information expressly or impliedly published in or in relation to this report notwithstanding any error or omission including negligence.