Are People Scared – Gold Falls $US30/oz. But Gold Stocks Rally (EVN, NCM, NST)
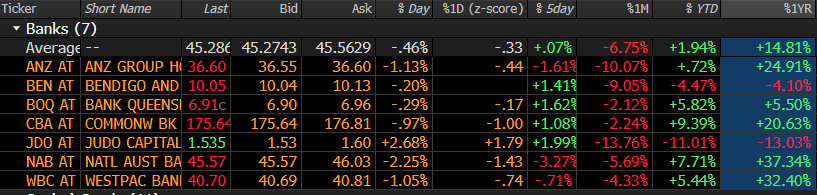
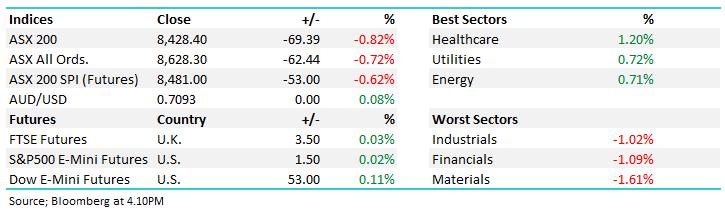
What a stellar performance by the ASX200 closing up +10-points in the face of poor leads from overseas markets on Friday, the US S&P500 futures tumbling another -0.5% by 4pm AEST and as expected, our resources getting walloped, led by BHP -2.4%. As we often say, it’s “hard to go up without the banks,” but the opposite is also true, yesterday our banks rallied +0.9% adding 14-points to the index in the process, dragging the index within 0.75% of a fresh decade high on the close.
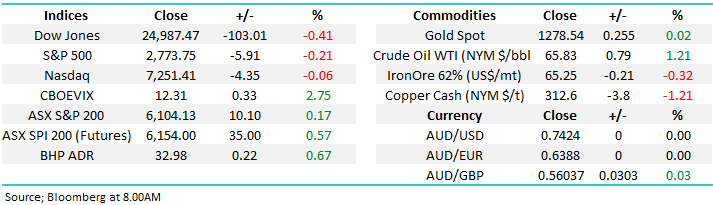
Overnight global stocks slipped lower, but the damage was not as bad as the overnight futures were implying with the US S&P500 only closing down -0.2%. The SPI futures are implying another solid session on the local market closing up +35-points indicating the ASX200 will open smack on its decade old swing high at 6150. With BHP set to bounce $0.20, the likely heavy lifting may again come from the previously unloved banking sector.
- Short-term MM remains mildly positive with a close below 6060 required to negate this view, however we remain in “sell mode”.
Today’s report is again going to look at the gold sector, which yesterday looked set to follow overseas gold ETF’s down around 2% with gold falling ~$US30oz. over the weekend. However while most gold stocks did open lower, they rallied all day to actually close positive on the day.
Remember one of our favourite sayings:
- “A market that rallies on bad news is a strong market”.
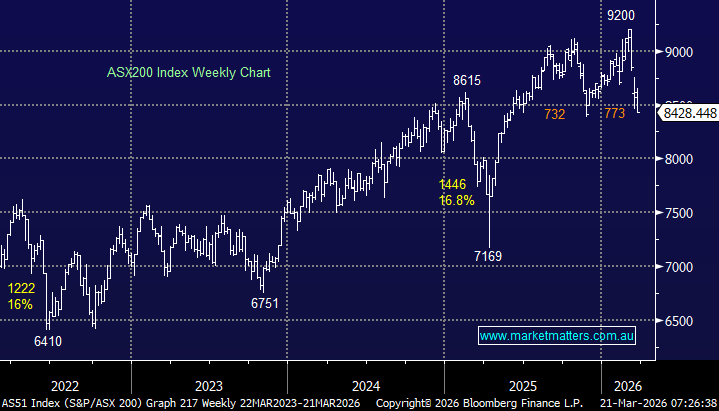
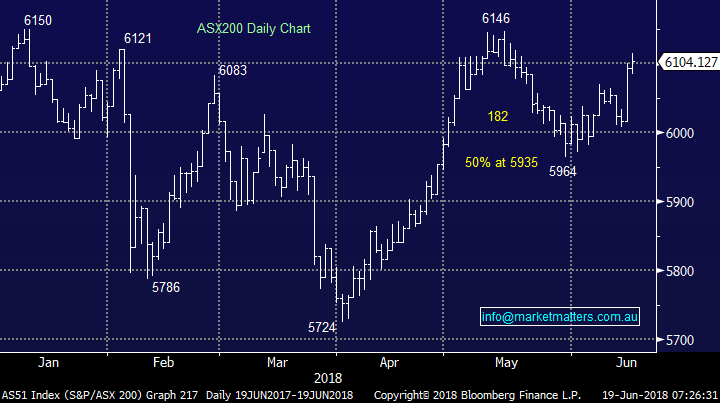
ASX200 Chart
An interesting technical / statistical signal was triggered yesterday derived from the “DOT Theory”, one which we hold in our armoury to generate solid risk / reward opportunities:
- “80% of the time the high or low of any timeframe is formed in the first 20% of any particular timeframe” – DOT Theory.
Hence with the ASX200 making fresh highs for June yesterday at 6114, on the 18th of this month, we extrapolate the theory to say the monthly low is in place. Then if we take it one step further and consider usual monthly ranges for the ASX200:
- May was a quiet month, but its range was still 182-points however 3 times in 2018 we have travelled around 270-points.
- Hence if assume that 5972 is now the low for June the strong likelihood is we will make fresh decade highs into EOFY i.e. probably today.
- However, if we consider that many investors will be short / underweight equities because of the combination of seasonality and negative macro-economic noise a squeeze towards 6250 is easy to comprehend.
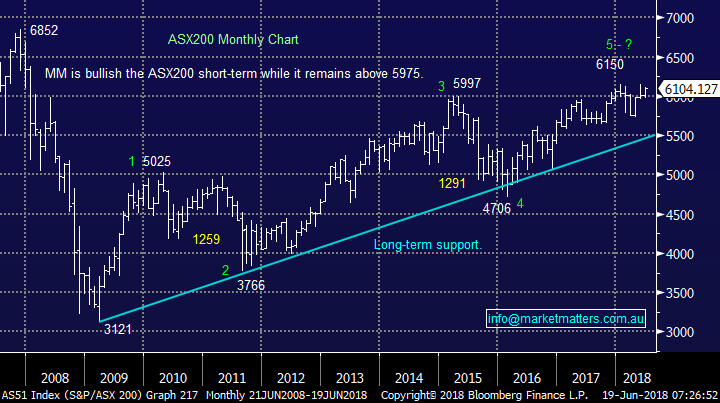
ASX200 Chart
The Australian Gold Sector
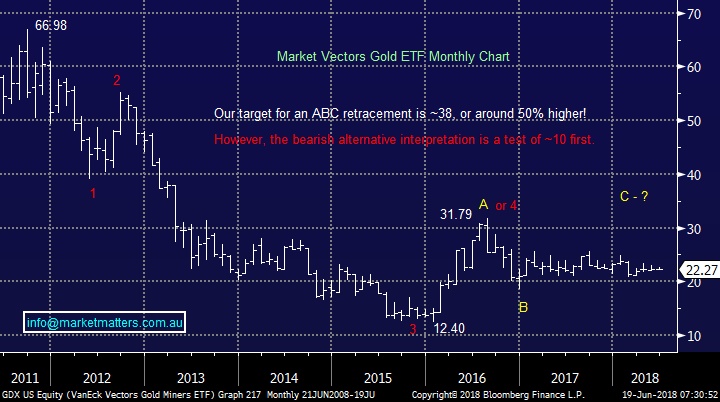
Gold has been very quiet over recent years trading today around the same levels as it was 2-years ago i.e. $US1280/oz. Hence gold miner’s ETF’s have also trod water since 2016, the below Market Vectors Gold ETF has looked almost closed since 2017, especially when compared to the previous 5-years.
Market Vectors Gold ETF Chart
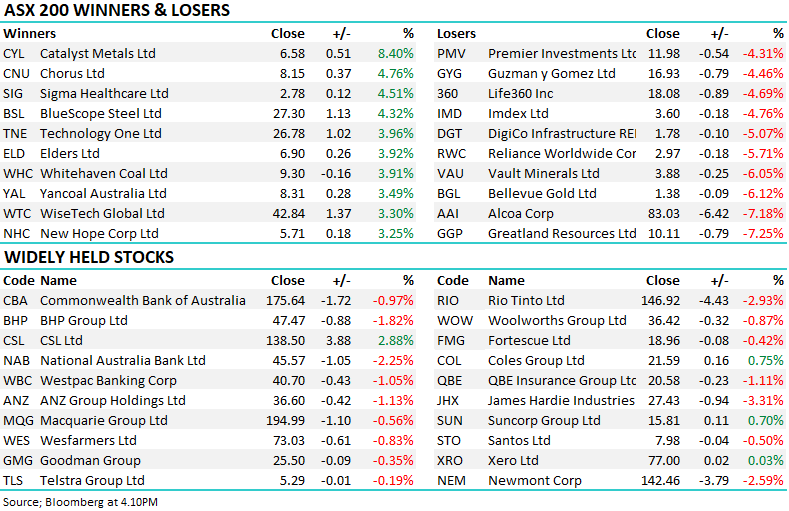
However the Australian gold sector appears to be running its own race with Northern Star (NST) and Evolution Mining (EVN) both up well over 30% during the last year. Typically Newcrest (NCM) still managed to fall -2% over the year as this serial disappointment remains comfortably in the “naughty” basket with the likes of Telstra (TLS) and QBE Insurance (QBE) – NCM does appear to be offering solid value currently but it’s a position that would certainly require decent entry.
We’ve avoided the local sector for most of this financial year correctly forecasting the gold price in $US and the respective gold ETF’s but its lead to us missing some nice moves in most local gold stocks - we ask why and what comes next?
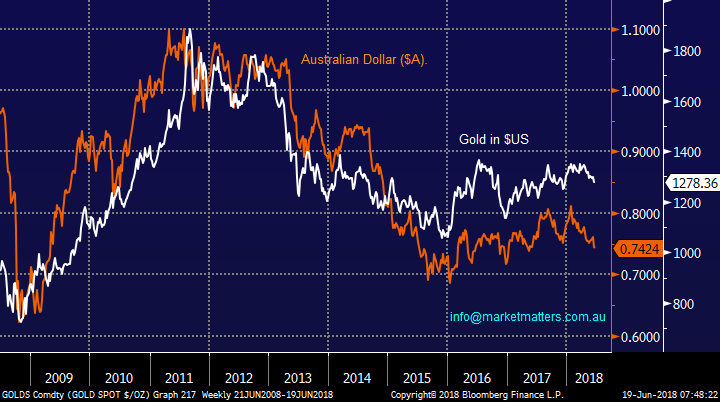
The correlation shown below between the $A and Gold ($US) is almost perfect although unfortunately there is no clear leader / follower.
Hence if we are correct at MM and the $A is headed down another 10-15% then gold in $US is likely to be testing ~$US1,200/oz but if history is anything to go on this is potentially bullish for the Australian gold sector.
Gold in $US v $A Chart
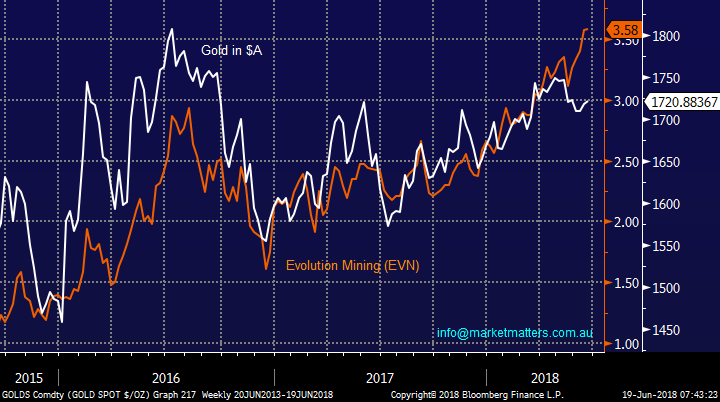
Over the last 2- years gold has rallied in $A terms, although it remains well below its 2016 high.
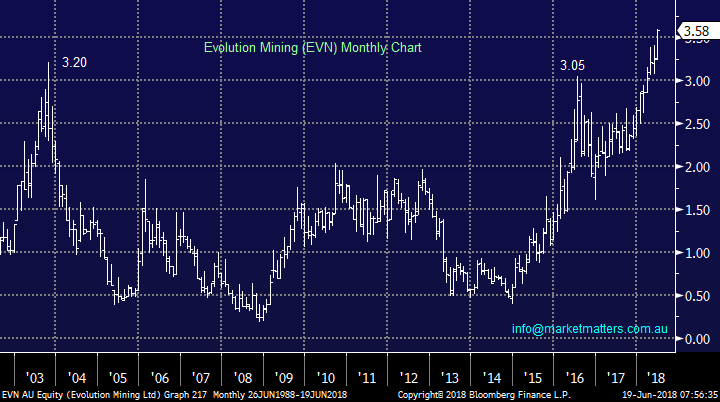
However Evolution Mining (EVN) has outperformed the precious metal, even in $A’s and soared to fresh all-time highs. When we stand back and look at EVN over the last 15-years from a technical perspective an aggressive breakout may just be commencing.
- At MM we remain keen buyers of EVN around $3 BUT its tempting to go long with a stop below $3.40 as a very aggressive play i.e. risk 5%.
From a valuation perspective EVN is trading on a P/E of 23x while yielding 1.8% fully franked, not exciting compared to say resources heavyweight RIO trading on a valuation of 12.8x and yielding 4.4% fully franked.
On balance MM is likely to sit on the sidelines until the picture is slightly clearer, especially as EVN is not cheap.
Evolution Mining v Gold in $A Chart
Evolution Mining Chart
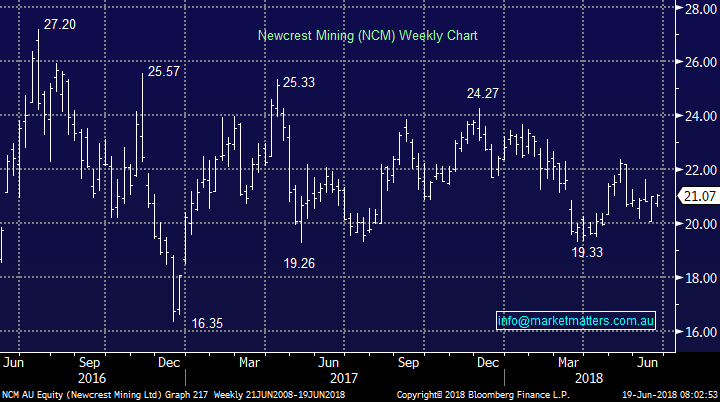
Local sector heavweight and perennial dissapointment NCM has been in the sin bin on a relative basis for a few years but its worth watching for a change in sentiment – it will take many fund managers a decent period of time to get back into NCM in earnest. Also, as EOFY dawns we may se some tax loss selling which may provide a good risk / reward entry.
- We are neutral NCM at present but watching carefully.
Newcrest Mining (NCM) Chart
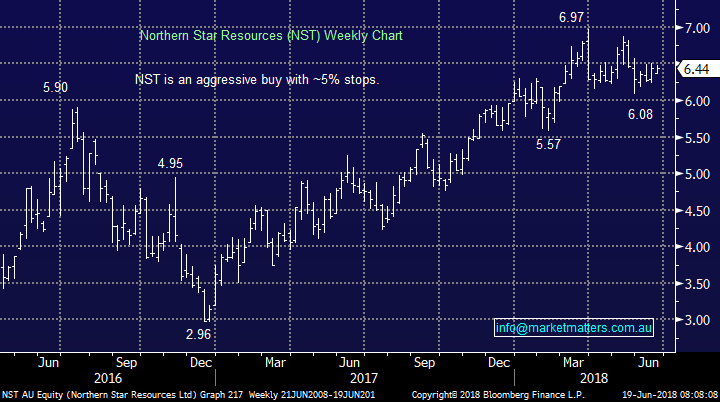
Two other sector favourites Regis Resources (RRL) and Northern Star (NST) are also providing trading / aggressive opportunities with a stop of around 5% i.e. very similar to Northern Star Resources (NST).
Similar to EVN we are likely to sit on the sidelines until the picture is slightly clearer, especially as stocks are not cheap.
Northern Star (NST) Chart
Moving onto other macro factors that historically affect the gold price, they are far from totally supportive of the precious metal in traditional $US terms;
- Rising interest rates is bad for gold which yields zero i.e. exactly what the Fed are presently doing with 7 hikes already this cycle.
- A strong US economy and $US is generally bad news for gold.
- Obviously supply & demand has a huge influence similar to any market, both the growing Chinese and Indian middle class love gold as an investment / jewellery.
- Rising inflation tends to push gold higher which works in the opposite direction to points 1 & 2 which are economically linked but theoretically hinder gold.
- The “X factor” gold has historically benefited during times of uncertainty like war but this often vanishes as fast as it arrived.
When we put all of the above in a mixing bowl it feels neutral for gold at present which is no great surprise as its exactly what’s unfolded for gold in $US terms for ~18-months.
The movement of our in favour gold stocks seems to currently be driven by the $A which we are bearish through 2018 /9, a positive for the sector.
Conclusion
A fascinating mix of thoughts / opinions which has evolved over recent weeks:
1 We are neutral to bearish gold in traditional $US terms.
2 We remain bearish the $A which is a potentially bullish sign for gold in $A and the local gold sector.
3 We are on the lookout for solid risk / reward buying opportunities in the domestic gold sector.
4 Sophisticated traders might consider a mix of short $A, long Australian gold stocks and short global gold ETF’s but the simple approach is sell $A and buy local gold stocks.
NB MM is already short the $A via an ETF for the Growth Portfolio.
Overseas Indices
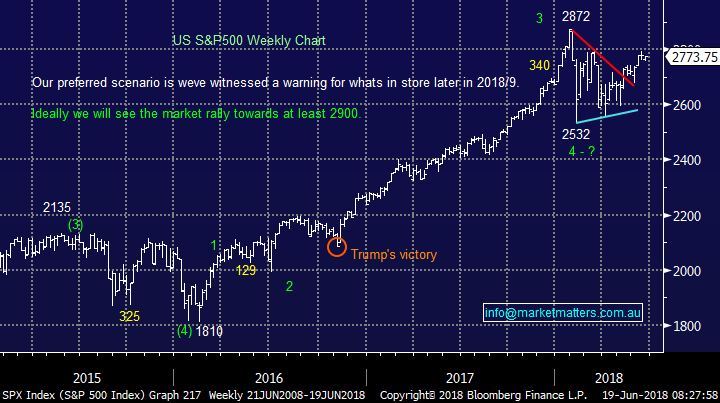
The tech-based NASDAQ again closed near its all-time highs after recovering from early weakness, while the broader S&P500 sits 3.4% below its same milestone.
We would still prefer to see the S&P500 make fresh all-time highs to quantify the risk / reward when we turn bearish but for now we will watch the NASDAQ for any sell signals.
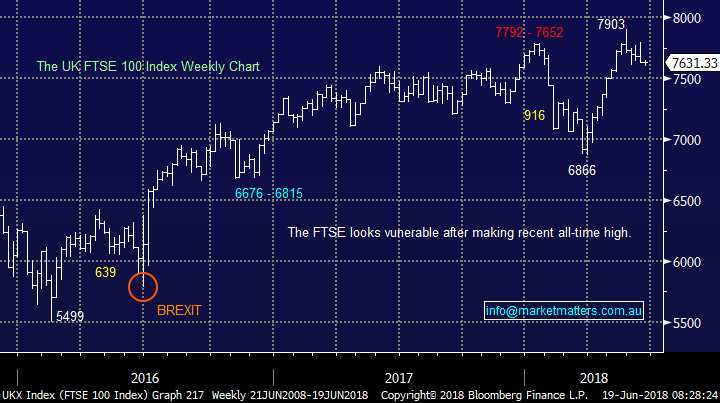
In Europe the UK FTSE like the NASDAQ recently made fresh all-time highs, but it’s struggling to maintain these gains, our “gut feel” is a correction is looming.
Bigger picture no change, we are on alert for a decent market correction and are still looking to increase our cash position into strength.
US S&P500 Chart
UK FTSE Chart
Overnight Market Matters Wrap
· The US drifted lower overnight as global trade tensions and oil supply remain as the main focus to investors… for now!
· Oil gained as fears OPEC would significantly increase supply at this week’s meeting in Vienna eased.
· The June SPI Futures is indicating the ASX 200 to make fresh highs for the year, up 50 points towards 6155 level this morning.
Have a great day!
James & the Market Matters Team
Disclosure
Market Matters may hold stocks mentioned in this report. Subscribers can view a full list of holdings on the website by clicking here. Positions are updated each Friday, or after the session when positions are traded.
Disclaimer
All figures contained from sources believed to be accurate. Market Matters does not make any representation of warranty as to the accuracy of the figures and disclaims any liability resulting from any inaccuracy. Prices as at 19/06/2018.
Reports and other documents published on this website and email (‘Reports’) are authored by Market Matters and the reports represent the views of Market Matters. The MarketMatters Report is based on technical analysis of companies, commodities and the market in general. Technical analysis focuses on interpreting charts and other data to determine what the market sentiment about a particular financial product is, or will be. Unlike fundamental analysis, it does not involve a detailed review of the company’s financial position.
The Reports contain general, as opposed to personal, advice. That means they are prepared for multiple distributions without consideration of your investment objectives, financial situation and needs (‘Personal Circumstances’). Accordingly, any advice given is not a recommendation that a particular course of action is suitable for you and the advice is therefore not to be acted on as investment advice. You must assess whether or not any advice is appropriate for your Personal Circumstances before making any investment decisions. You can either make this assessment yourself, or if you require a personal recommendation, you can seek the assistance of a financial advisor. Market Matters or its author(s) accepts no responsibility for any losses or damages resulting from decisions made from or because of information within this publication. Investing and trading in financial products are always risky, so you should do your own research before buying or selling a financial product.
The Reports are published by Market Matters in good faith based on the facts known to it at the time of their preparation and do not purport to contain all relevant information with respect to the financial products to which they relate. Although the Reports are based on information obtained from sources believed to be reliable, Market Matters does not make any representation or warranty that they are accurate, complete or up to date and Market Matters accepts no obligation to correct or update the information or opinions in the Reports.
If you rely on a Report, you do so at your own risk. Any projections are estimates only and may not be realised in the future. Except to the extent that liability under any law cannot be excluded, Market Matters disclaims liability for all loss or damage arising as a result of any opinion, advice, recommendation, representation or information expressly or impliedly published in or in relation to this report notwithstanding any error or omission including negligence.
To unsubscribe. Click Here