Are investors on the wrong foot again with bond yields? (BIN, BAL)
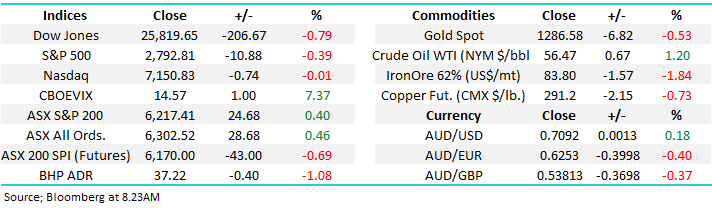
Another strong day for the ASX200 which closed at levels not seen since September 2018, not a bad effort for a market that so many people still feel is cactus! Arguably more importantly the ASX200 Accumulation Index (includes reinvested dividends) closed at an all-time high, certainly outperforming other more traditional asset classes like property and cash – interestingly we’ve spoken to a number of MM followers who are moving out of property and are looking at opportunities in equities (some flowing into the MM Funds – click here for info), perhaps some of the fuel for the recent market acceleration higher.
Under the hood we again saw broad strength with only the golds noticeably dragging the chain with most of the sector down between 2 & 3%, no hurry here just yet in our opinion. The “dogs” of recent times like Bingo (BIN) and Nufarm (NUF) on this occasion, continue to surprise on the upside as investors struggle for value in what’s a fairly rich market but the upside momentum does continue to slow as the banks in particular look tired after their stellar recovery from late 2018 lows.
As we’ve discussed and enjoyed over recent weeks we have witnessed some exciting rallies from the “dogs” but we won’t be surprised to see some of these turn as fast as they bounced hence we are watching them closely as a potential sign of appetite for equities / risk is starting to wane.
MM is now neutral the ASX200 after its almost 17% rally from late December lows.
Overnight US markets closed weaker led by the Dow which fell over 200-points although it again bounced strongly from its lows having been down ~400-points with under 2 hours of the day remaining. The SPI futures are calling the AX200 to open down around -0.8% with BHP closing down over 1% in the US not likely to help.
Today we have looked at US bond yields which are so pivotal in the performance of equities.
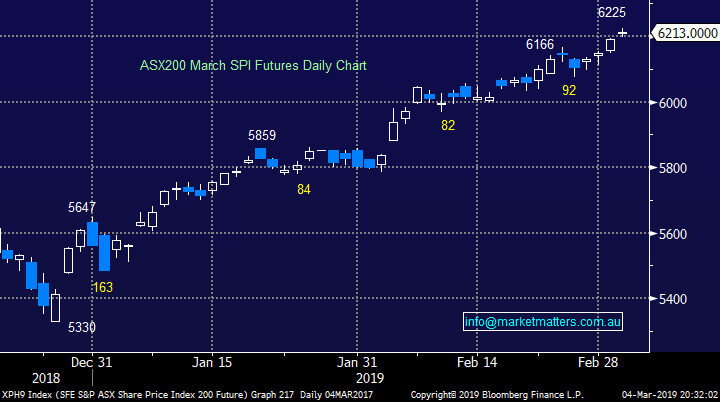
ASX200 March SPI Futures Chart
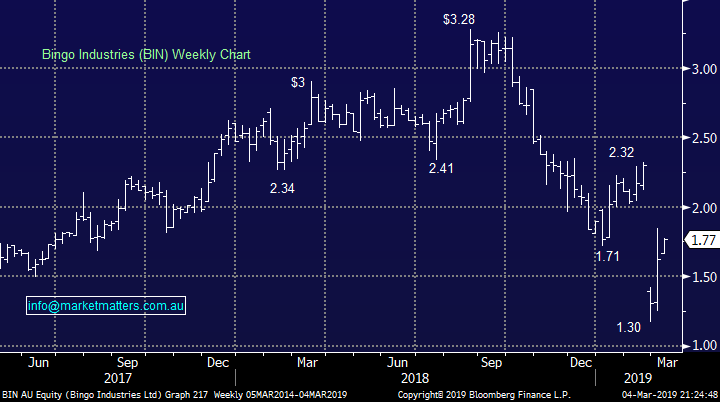
Bingo Industries (BIN) has rallied ~45% since we went long only 2-weeks ago making it easy to grab the profit and puff out the chest. However we are still bullish both short and medium term:
1 – Short-term we can see BIN reaching the $1.90-$2 area i.e. another 7-10% higher.
2 – Medium term we can see a test of the $2.30 breakdown area but a pullback towards $1.60 would not surprise.
MM may look to “trade” the above 2 scenarios if / when the opportunity unfolds.
Bingo Industries (BIN) Chart
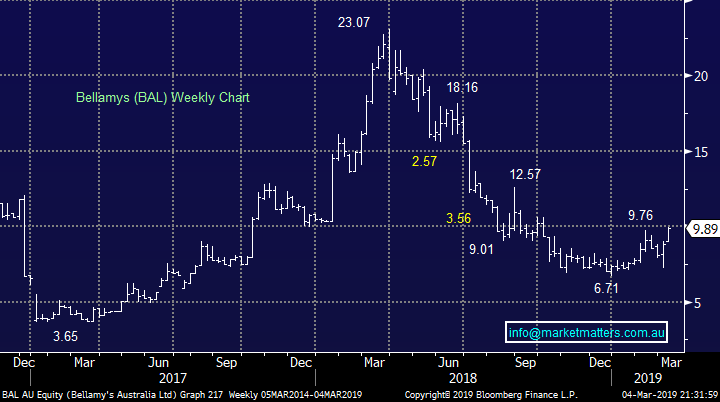
In Mondays question report we wrote when discussing Bellamy’s (BAL) “Fans of the stock could buy with stops below $8.10, or ~8% risk” however I can assure you we didn’t expect a 12% surge in one day!
This is another example of a market dog surging which often occurs when a market advance is close to maturity.
Technically MM is now bullish BAL with stops below $9, not great risk / reward but at least it’s with the current trend.
Bellamy’s (BAL) Chart
Global stock markets
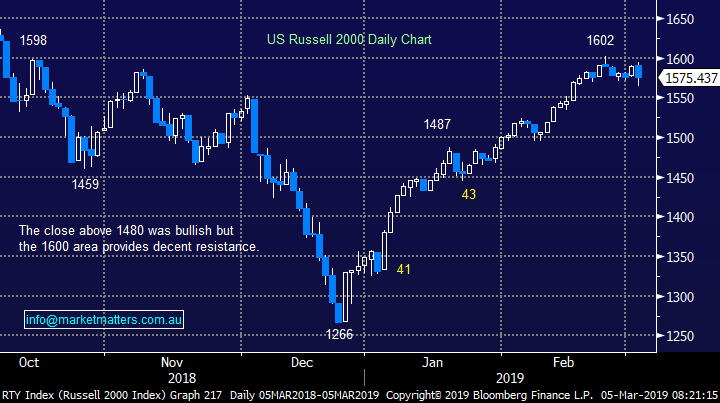
US stocks continue to recover after attempts to fall, technically we can actually still see another short-term high by the small cap Russell 2000 but we believe a decent correction is now approaching rapidly – the ASX200 often leads global markets lower, it will be interesting to see how we trade over the coming weeks.
US Russell 2000 Chart
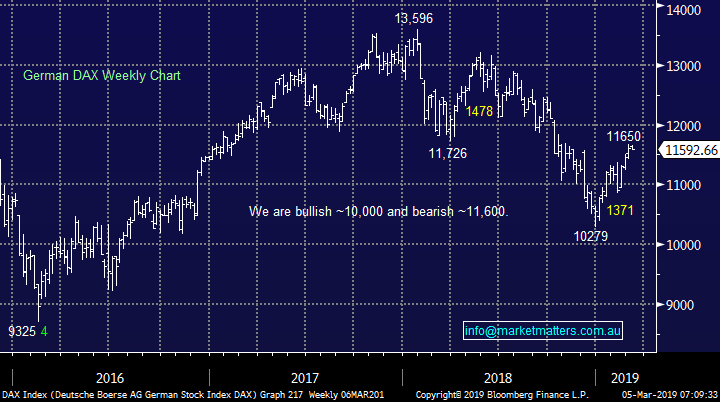
No change with European indices who have reached major resistance and our target area following their ~13% bounce, we are now neutral to bearish from a simple risk / reward basis.
This reaffirms our believe that patience is likely to be rewarded with buying of the market in general – clearly not necessarily on a stock by stock basis.
German DAX Index Chart
Australian & US bond yields
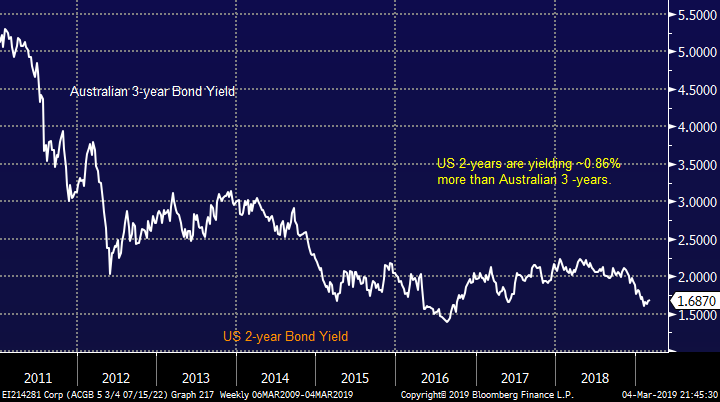
Australian bond yields (interest rates) have resumed their downward trajectory with relative gusto since late 2018 as the decline in property prices and large household debt levels pressure an economy that looks solid on the surface following the 50% surge in iron ore after the Vale disaster in Brazil.
Last month we had prominent Westpac economist Bill Evans climb out on a limb and forecast 2 interest rate cuts by the RBA in 2019 – in August and November respectively, it’s been a while since rates were changed on Melbourne Cup Day. While MM doesn’t expect both of the 2 cuts, the RBA’s return to a neutral stance implies our central bank is concerned that the local economy is vulnerable at this point in time.
The talk of lower rates seemed to throw petrol on the fire of an already hot market helping the ASX200 rally almost 17% since December, outperforming many major global indices on its way.
Australian 3-year and US 2-year bond yields Chart
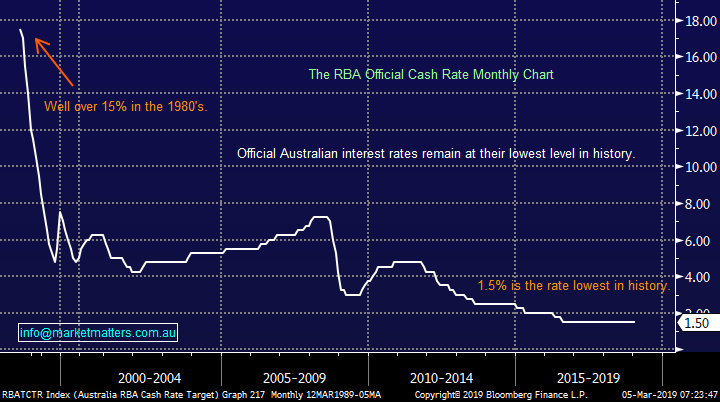
Our major concern at MM remains the lack of ammunition at the RBA’s disposal when / if the Australian economy does slow down, you cannot cut far from 1.5%. If we do experience our first recession in 27-years moving forward we can see the RBA implementing some sort of quantitative easing, similar to the rest of the world after the GFC, in an attempt reboot consumer confidence and spending – some wages growth and inflation would help.
Australian RBA official cash rate Chart
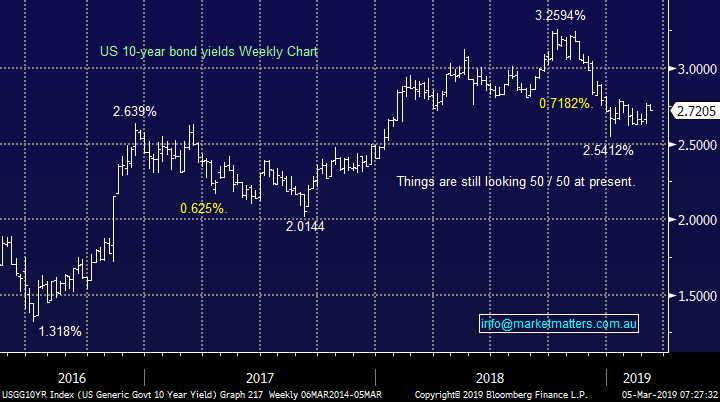
Moving onto the globally very influential US 10-year bond yields which rallied relatively strongly last week.
At this stage we are 60-40 that the next meaningful move in US bond yields is up but that’s obviously not a strong enough opinion to invest around. However, a break above 2.77% and we will become technically bullish US bond yields which does carry with it some important thematic’ s around market and sector selection e.g. higher bond yields (interest rates) is usually bad for growth stocks, the “yield play” and the gold sector.
US 10-year bond yields Chart
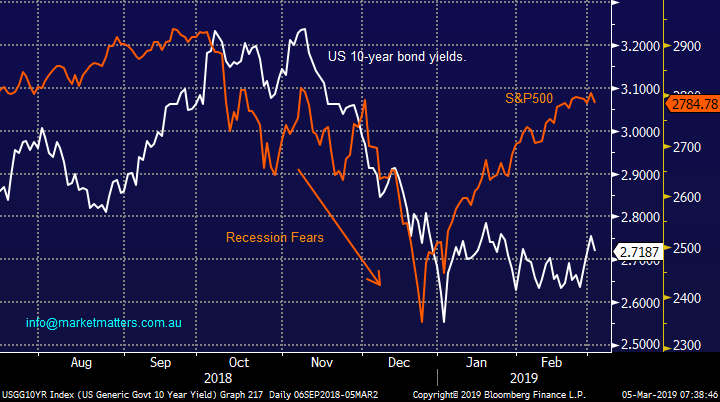
US 10-year bond yields have an enormous influence on stocks as they represent both a safe comparative return on money and a yardstick on what it costs corporates to borrow money – especially important in today’s environment of huge stock buybacks.
We have 2 takeout’s from the below comparison of bond yields and US stocks (S&P500):
1 – When US bond yields rallied up towards 3.2% they appeared to be the “straw that broke the camels back” for stocks as investors panicked on mass that rising rates would rapidly push the US economy from growth into a recession.
2 – US stocks have rallied strongly since December as they shrug off concerns of a recession BUT bond yields are clearly not convinced.
We believe the parting of the seas has gone too far and either stocks need to come back towards bond yields, or the same bond yields are set to rally, either way the risk / reward is diminishing rapidly for stocks.
US 10-year bond yield v S&P500 Chart
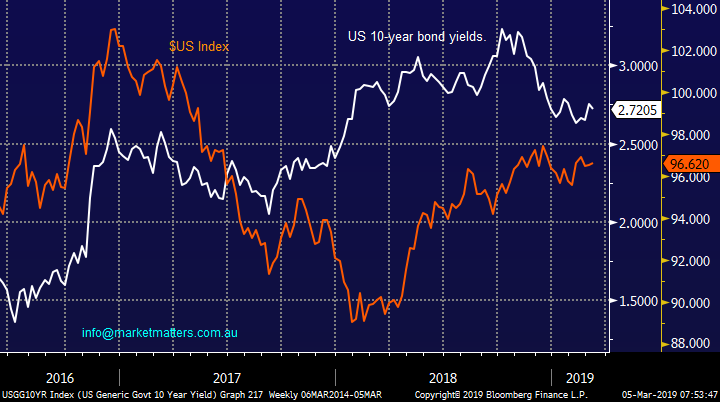
When I started writing this piece I thought if US 10-year bond yields are set to rally then the likelihood is the $US will follow suit and my bullish $A opinion will be shot down in flames – as a number of subscribers have eluded to.
However as we can see from the chart below over the last 2-years, US bond yields have little to no correlation on the $US.
While our bullish call on the AUD is a contentious one, and certainly not with consensus, the rationale for a weak AUD stems from a host of factors that in my opinion are all known, understood and priced into the market.
We remain bullish the $A against the $US targeting 80c before 60c.
US 10-year bond yield v $US Chart
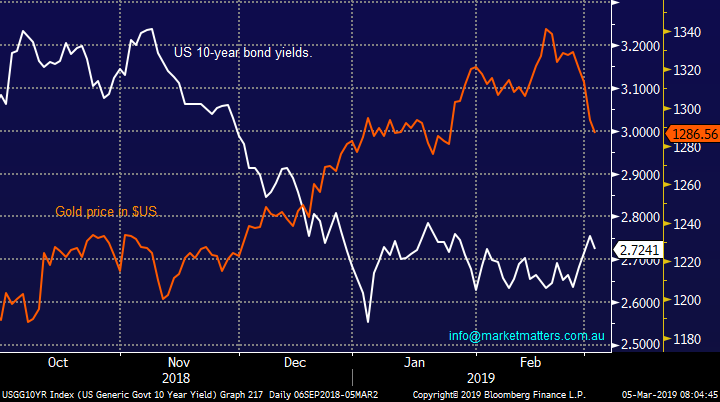
However, US 10-year bond yields have a clear impact on the gold price over the last 6-months i.e. lower bond yields (interest rates) is clearly bullish for gold.
Interestingly the gold price is potentially leading here as it’s fallen ~$US60/oz or well over 4% since early February. Hence considering our current 60-40 opinion on bond yields subscribers should understand our patience in buying into the gold sector.
US 10-year bond yield v Gold Chart
Conclusion
MM is 60-40 that US bond yields are set to rally over the coming months, a break above 2.77% would generate a bullish technical signal.
Importantly we don’t believe the market is positioned for bond yields to rally hence we are now cautious on stocks / sectors that are likely to be adversely affected i.e. growth stocks, “yield play” and the gold sector.
Overnight Market Matters Wrap
- The US started the week in the red, with all 3 major indices lower as investors weighed up what is already priced into the equity markets for a pending US-China trade settlement and instead focused on further weak economic signals, with US construction spending falling 0.6% in December, following Friday’s weaker manufacturing numbers and falling consumer sentiment.
- Locally, investors anticipate the RBA to keep its interest rate left unchanged at 1.5%, however analysts’ outlook for 2019 is a 0.25-0.50% cut this year.
- The March SPI Futures is indicating the ASX 200 to open 29 points lower towards the 6190 level this morning.
Have a great day!
James & the Market Matters Team
Disclosure
Market Matters may hold stocks mentioned in this report. Subscribers can view a full list of holdings on the website by clicking here. Positions are updated each Friday, or after the session when positions are traded.
Disclaimer
All figures contained from sources believed to be accurate. Market Matters does not make any representation of warranty as to the accuracy of the figures and disclaims any liability resulting from any inaccuracy. Prices as at 05/03/2019
Reports and other documents published on this website and email (‘Reports’) are authored by Market Matters and the reports represent the views of Market Matters. The MarketMatters Report is based on technical analysis of companies, commodities and the market in general. Technical analysis focuses on interpreting charts and other data to determine what the market sentiment about a particular financial product is,or will be. Unlike fundamental analysis, it does not involve a detailed review of the company’s financial position.
The Reports contain general, as opposed to personal, advice. That means they are prepared for multiple distributions without consideration of your investment objectives, financial situation and needs (‘Personal Circumstances’). Accordingly, any advice given is not a recommendation that a particular course of action is suitable for you and the advice is therefore not to be acted on as investment advice. You must assess whether or not any advice is appropriate for your Personal Circumstances before making any investment decisions. You can either make this assessment yourself, or if you require a personal recommendation, you can seek the assistance of a financial advisor. Market Matters or its author(s) accepts no responsibility for any losses or damages resulting from decisions made from or because of information within this publication. Investing and trading in financial products are always risky, so you should do your own research before buying or selling a financial product.
The Reports are published by Market Matters in good faith based on the facts known to it at the time of their preparation and do not purport to contain all relevant information with respect to the financial products to which they relate. Although the Reports are based on information obtained from sources believed to be reliable, Market Matters does not make any representation or warranty that they are accurate, complete or up to date and Market Matters accepts no obligation to correct or update the information or opinions in the Reports. Market Matters may publish content sourced from external content providers.
If you rely on a Report, you do so at your own risk. Past performance is not an indication of future performance. Any projections are estimates only and may not be realised in the future. Except to the extent that liability under any law cannot be excluded, Market Matters disclaims liability for all loss or damage arising as a result of any opinion, advice, recommendation, representation or information expressly or impliedly published in or in relation to this report notwithstanding any error or omission including negligence.


