Are Insurance stocks telling us where interest rates are headed? (BLD, NCM, SUN, MPL, NHF, IAG, QBE)

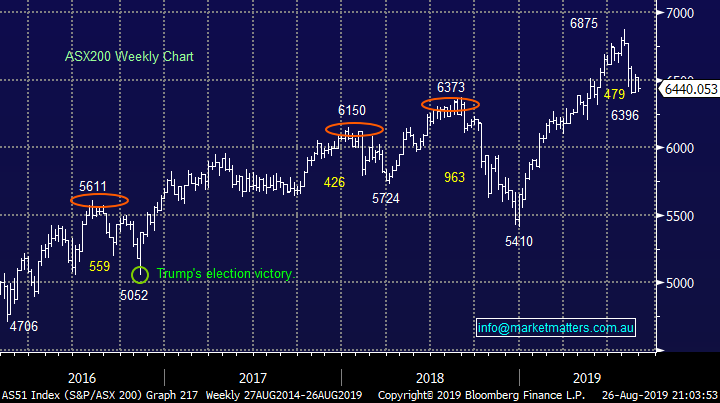
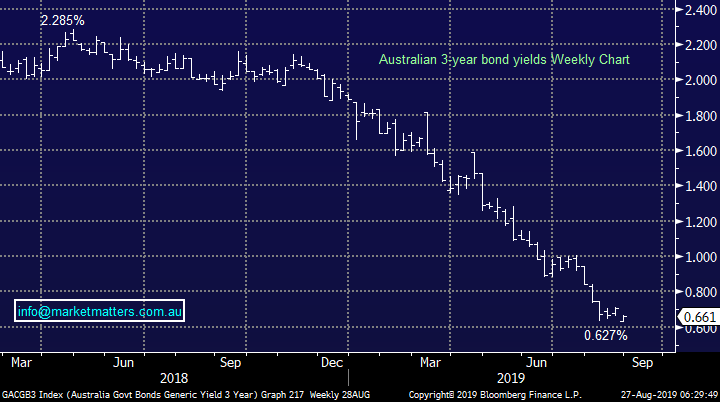
The ASX200 commenced the last week of a very volatile August with a thud, falling 83-points / -1.3% with over 80% of the ASX200 closing in the red. Just to add confirmation to the markets negativity all 11-sectors closed down while Australian 3-year bond yields made fresh all-time lows at 0.627% i.e. money ran for the safety of bonds. Overall no great surprise considering the Trump induced lead from both Friday and over the weekend, it’s almost felt like the volatile President has been pushing the self-destruct button with regards to US – China trade and perhaps even the looming election in late 2020.
Yesterday we wrote “why don’t we write the MM reports 5-minutes before the market opens!” and this felt on the money again just after our market closed on Monday as US futures surged following comments from Trump “that China talks were back on” - wow he could be making an absolute fortune by frontrunning his own tweets. The conciliatory tone continued overnight as he reiterated that “the US is open to calm negotiation”. Hopefully the President currently being in the presence of the G7 leaders is calming him but unfortunately I feel like many that this might only last 1-2 days before he again implodes with the unpredictable volatility of a 2-year old child.
Moving onto old fashioned reporting season with this August one that many investors / companies would rather forget. This morning we see Wesfarmers (WES), OZ Minerals (OZL), Reliance Worldwide (RWC), Spark Infrastructure (SKI), Caltex (CTX) and Ingham’s (ING) face the music as things slowly wind down on the earnings front. Reporting calendar available here. I cover Initial thoughts below on: WES, RWC, & ING.
Technically we can still see imagine another few weeks of consolidation for the ASX200 between 6400 and 6600 although the volatility on a day to day basis feels likely to remain elevated and unpredictable.
MM remains comfortable adopting a conservative stance towards equities, especially around the 6600 area.
I reiterate that MM intends to adopt a more conservative stance if / when the ASX200 reaches the 6600-area through a combination of increased cash levels, re-entering the gold sector and considering the leveraged bearish ETF (BBOZ) i.e. less than 3% higher.
ASX200 Chart
Overnight US stocks bounced as trade tensions eased, the Dow gained 269-points, almost half of Fridays loss. The SPI futures are implying the ASX200 will drag the chain this morning as they point to an open ~20 points higher.
Today we are going to look at the Insurance sector with one eye on how the sector leads or follows interest rates / bond yields, however before we move on to today’s topic, below is a recording that focusses on the Growth Portfolio and our intentions from here.
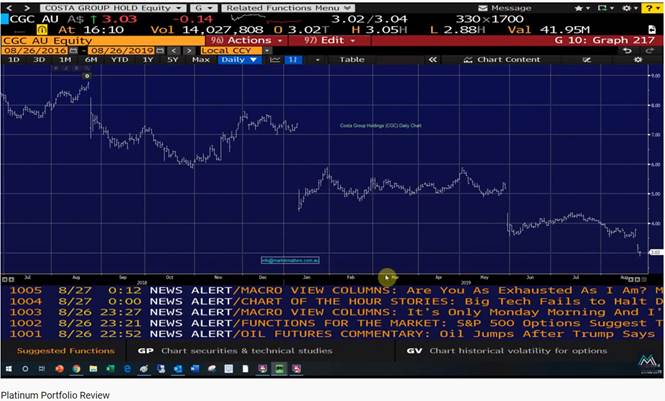
We have a number of stocks in the portfolio that have struggled through this reporting period and while the overall performance of the portfolio has tracked broadly inline with a weak market during August, there are some positions that are clearly causing us pain. I discuss our approach towards these positions in the update below, however in summary we are: Looking to cut ABC & ORE & reduce CGC.
Growth Portfolio Review – CLICK TO VIEW – 15 MIN VEIDEO
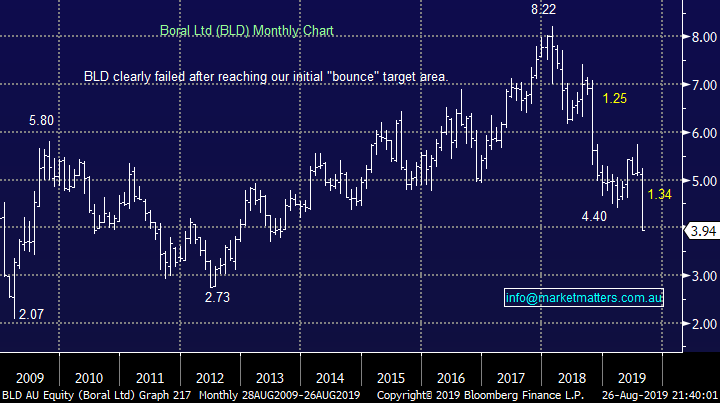
Yesterday Boral (BLD) plunged over 20% to a six-year low after it delivered a $272m net profit for 2019, however its guidance was weak - the company warned of a profit down 5 & 15% relative to FY19. The question is when will the infrastructure boom kick in to replace the lost earnings from the collapse in housing construction.
With BLD now down over 50% from its 2018 high the stocks trading on a cheap valuation of an Est. P/E of 9.8x for 2020 while yielding 6.85% part franked – arguably more attractive than Adelaide Brighton (ABC) which is trading on a P/E of 15.4x and who report later this week – although they have already downgraded ahead of results.
MM actually likes BLD as an infrastructure play over the next 12-months although entry is hard to pinpoint for now.
Boral Ltd (BLD) Chart
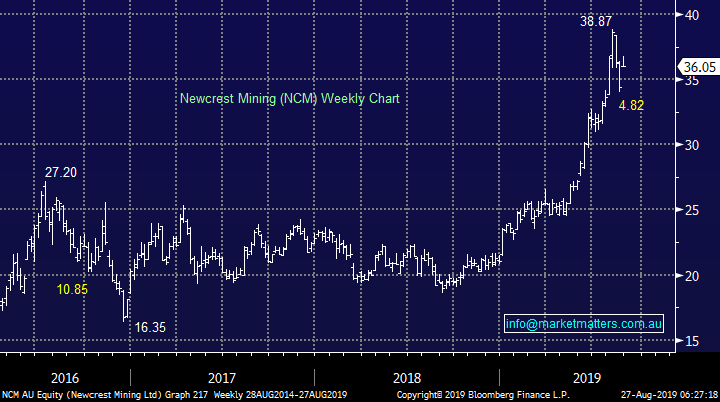
The Australian gold sector bounced yesterday as it garnered a safety bid similar to the bond market but most of the stocks closed near to their lows of the day e.g. heavyweight Newcrest (NCM) is still over 7% below its 2019 high.
MM still likes gold stocks into weakness but patience still feels warranted.
Newcrest Mining (NCM) Chart
Australian 3-year bond yields have tumbled from Q4 of 2018 as markets position themselves for the RBA to cut official interest rates from 1% to at least 0.5% while some are even expecting something closer to zero!
After yesterday’s capitulation like move to fresh all-time lows I feel there’s a strong possibility that some consolidation is about to unfold, rotation between 0.63% and 0.8% is our “best guess”.
MM still expects the RBA to cut interest rates at least once in 2019.
Australian 3-year Bond yield Chart
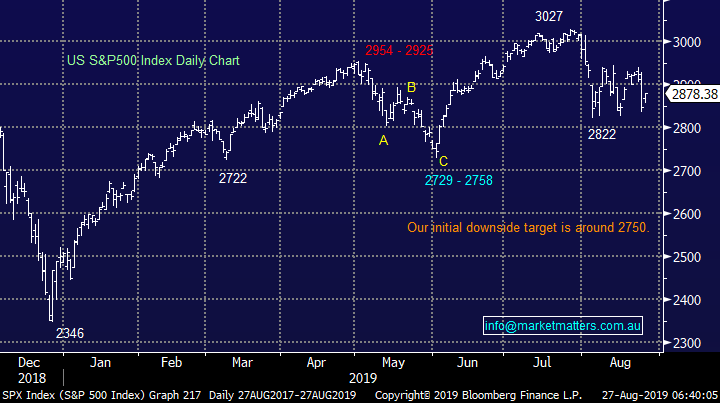
No change in our opinion for US stocks: “MM believes we have entered a new short-term cycle for US stocks where bounces should be sold for the active trader”.
Our medium-term target for this market correction is around 5% lower but we feel a squeeze towards 2960, or 3% higher, to stop out all the shorts is a strong possibility i.e. the market likes to move in the path of most pain.
Our initial target for this pullback by US stocks is ~5% lower.
US S&P500 Chart
Reviewing the Australian Insurance sector
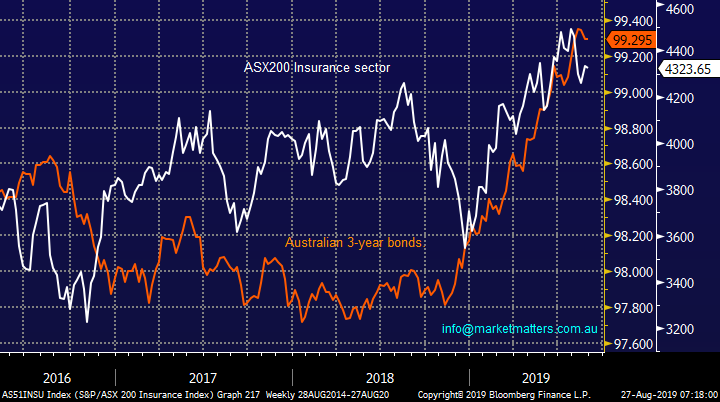
The insurance sector enjoys a higher interest rate environment as the returns generated on premiums being held in fix interest are simply higher, hence today’s historically low bond yields create a headwind for earnings. However the sector has rallied along with the index in 2019 as bond yields tumbled on global recession fears. In other words, the insurance stocks have been supported by their comparative value & yield as opposed to the loss of earnings caused by the low interest rate environment.
At MM we feel the trend for bond yields is mature but it can easily continue for another 6-12 months which theoretically should be supportive for insurance stocks.
NB higher bonds prices means lower bond yields.
MM believes the Insurance sector is clearly being supported by low bond yields / higher bond prices.
ASX200 Insurance Sector v Australian 3-year bonds Chart
Today we have briefly looked at 5 local insurance stocks as we look for both opportunities and clues to the path for the sector into 2020.
1 Suncorp Group (SUN) $13.38
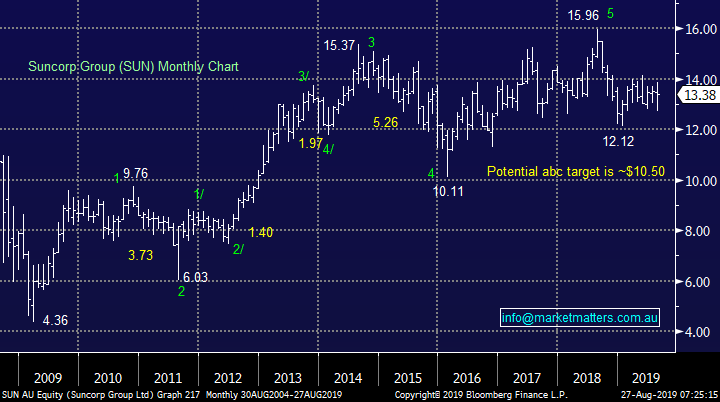
The Suncorp (SUN) business has not been performing particularly excitingly which has been reflected by the share price – this year the profit after tax was up just 1%. The stocks attractive dividend of 39c fully franked being in September feels potentially unsustainable as its payout ratio is now above the groups official 60-80% guide.
SUN has been an excellent technical barometer for MM over recent years and unfortunately the picture is not particularly pretty for the Queensland based banking & insurance business i.e. technically we remain bearish SUN targeting well under $11.
MM is neutral / bearish SUN at present.
Suncorp (SUN) Group Chart
2 Medibank Private (MPL) $3.50
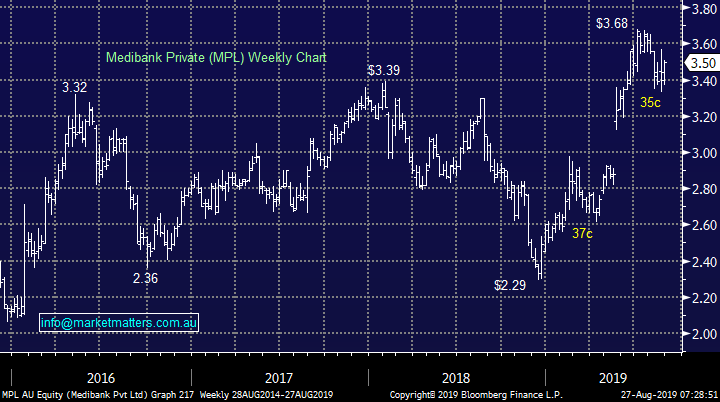
Private health stock MPL has been a quiet achiever in 2019 and it now sits only 5% below its all-time high. Both Medibank and NIB have enjoyed stellar runs after the surprise Coalition victory however we believe MPL is rapidly becoming fully priced – the recent sharp 17% correction by NHF is a potential warning signal.
MM is short-term bullish MPL targeting a test towards $3.80 but the risk / reward is not attractive enough to be a buyer i.e. we are more inclined to be sellers of fresh highs as opposed to chasing the stock for the last few crumbs.
MM is short-term bullish MPL at current prices.
Medibank Private (MPL) Chart
3 NIB Holdings (NHF) $6.97
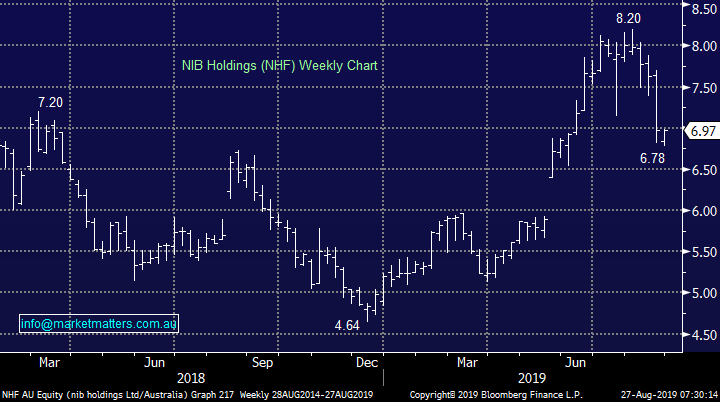
Private healthcare company NHF looked after MM nicely in 2019 as we took profit around $8.10 in late July! After the strong decline we are now neutral NHF but the election “sugar fix” is firmly behind us and an indebted Australian / struggling economy is a concerning headwind for earnings into 2020.
The issue is many Australians are now regarding private health care as a luxury which can be dropped when times are tough.
MM is neutral NHF short-term.
NIB Holdings (NHF) Chart
4 Insurance Australia Group (IAG) $7.91.
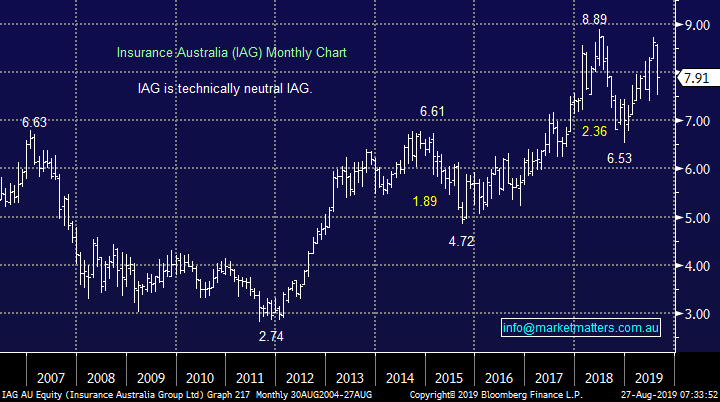
IAG disappointed the market earlier in the month when it delivered a 3.1% increase in written premium but a 13% drop in profits although margins improved by 2.5% to 16.6% while 2020 guidance was for “low single-digit” growth.
The stocks been trading in a range since 2018 and we see no need to fight the tape on this one i.e. we are neutral.
MM is neutral IAG short-term.
Insurance Australia Group (IAG) Chart
5 QBE Insurance (QBE) $12.23.
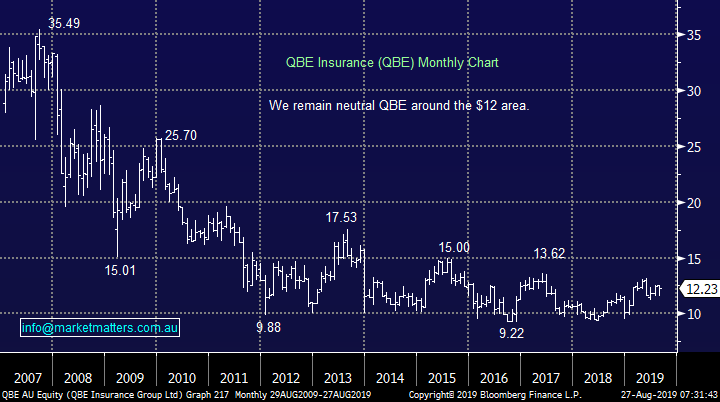
QBE is a recovery story which was illustrated by its latest 35% lift in profits to $520m after tax, the company finally appears to be successfully implementing their strategy. This serial underperformer / downgrade merchant appears to have moved on but 2 opposing macro themes are at work with their earnings:
1 – Plunging US bond yields are a major headwind for their earnings.
2 – The $A trading around fresh decade lows is a healthy tailwind for earnings.
While we believe both of the above factors are in mature trends no clear signals have been generated to aggressively position ourselves accordingly.
MM remains neutral QBE for now but we do like the prevailing turnaround story from management.
QBE Insurance (QBE) Chart
Conclusion (s)
Unfortunately we so no opportunities in the Australian Insurance sector at present.
Global Indices
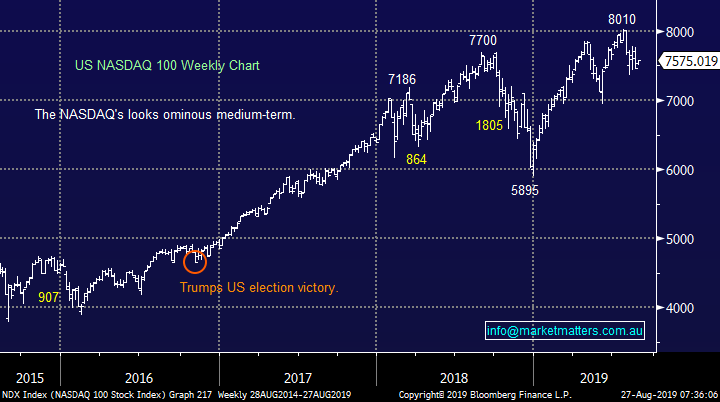
We believe US stocks are now bearish as discussed over recent weeks, the tech based NASDAQ’s resistance comes in around 7800.
US stocks have generated technical sell signals.
US NASDAQ Index Chart
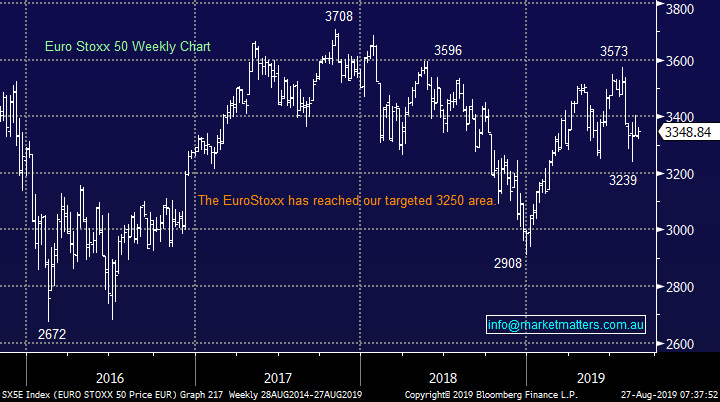
No change again with European indices, while we remain cautious European stocks as their tone has become more bearish over the last few months, however we had been targeting a correction of at least 5% for the broad European indices, this has now been achieved.
The long-term trend is up hence any “short squeezes” might be harder and longer than many anticipate.
Euro Stoxx 50 Chart
Overnight Market Matters Wrap
· The never ending trade war between US and China has seen global equity markets play its game of snakes and ladders where one tweet by Trump changes the stance of investors each day. Overnight we saw the US gain around half of last Friday’s losses with the tech. heavy Nasdaq 100 outperforming its major peers.
· The LME was closed for a bank holiday, while copper futures trading in NY fell to its lowest level since July 2017!
· BHP is expected to outperform the broader market after ending its US session up an equivalent of 0.46% from Australia’s previous close.
· The September SPI Futures is indicating the ASX 200 to open 19 points higher, testing the 6460 level this morning.
Have a great day!
James & the Market Matters Team
Disclosure
Market Matters may hold stocks mentioned in this report. Subscribers can view a full list of holdings on the website by clicking here. Positions are updated each Friday, or after the session when positions are traded.
Disclaimer
All figures contained from sources believed to be accurate. All prices stated are based on the last close price at the time of writing unless otherwise noted. Market Matters does not make any representation of warranty as to the accuracy of the figures or prices and disclaims any liability resulting from any inaccuracy.
Reports and other documents published on this website and email (‘Reports’) are authored by Market Matters and the reports represent the views of Market Matters. The Market Matters Report is based on technical analysis of companies, commodities and the market in general. Technical analysis focuses on interpreting charts and other data to determine what the market sentiment about a particular financial product is, or will be. Unlike fundamental analysis, it does not involve a detailed review of the company’s financial position.
The Reports contain general, as opposed to personal, advice. That means they are prepared for multiple distributions without consideration of your investment objectives, financial situation and needs (‘Personal Circumstances’). Accordingly, any advice given is not a recommendation that a particular course of action is suitable for you and the advice is therefore not to be acted on as investment advice. You must assess whether or not any advice is appropriate for your Personal Circumstances before making any investment decisions. You can either make this assessment yourself, or if you require a personal recommendation, you can seek the assistance of a financial advisor. Market Matters or its author(s) accepts no responsibility for any losses or damages resulting from decisions made from or because of information within this publication. Investing and trading in financial products are always risky, so you should do your own research before buying or selling a financial product.
The Reports are published by Market Matters in good faith based on the facts known to it at the time of their preparation and do not purport to contain all relevant information with respect to the financial products to which they relate. Although the Reports are based on information obtained from sources believed to be reliable, Market Matters does not make any representation or warranty that they are accurate, complete or up to date and Market Matters accepts no obligation to correct or update the information or opinions in the Reports. Market Matters may publish content sourced from external content providers.
If you rely on a Report, you do so at your own risk. Past performance is not an indication of future performance. Any projections are estimates only and may not be realised in the future. Except to the extent that liability under any law cannot be excluded, Market Matters disclaims liability for all loss or damage arising as a result of any opinion, advice, recommendation, representation or information expressly or impliedly published in or in relation to this report notwithstanding any error or omission including negligence.


