Are insurance stocks simply too hard? (BPT, BHP, SUN, IAG, QBE, NHF, MPL, SDF)
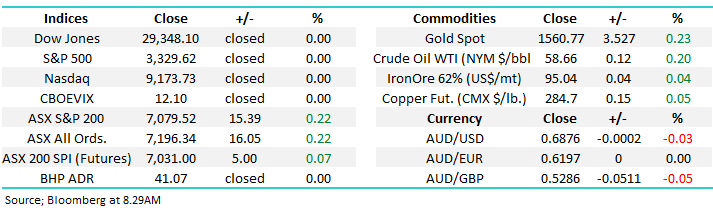
The ASX200 continues on its merry way, it’s already rallied almost 6% this month and there’s still 2-weeks to go. The winners and losers were actually evenly balanced on Monday as the market felt a touch tired but when the heavyweight resources rally aggressively the index will usually close in the green. On the sector level there were some differing narratives with 4 of the 11 sectors closing in the red as sentiment across the market was driven by the start of reporting season.
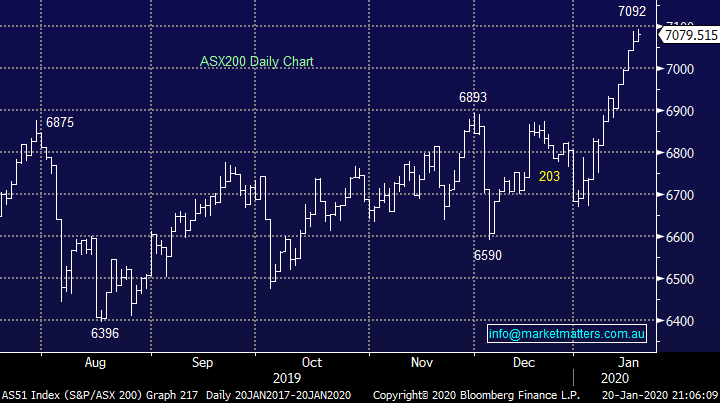
While the market remained strong the negative surprises have commenced as confession / reporting season kicks into gear e.g. NIB Holdings (NHF) -12.7%, and Kogan (KGN) -22.2%. Subscribers should remember interest rates are being cut because its tough out there and by definition we feel negative surprises will likely be quite common in the weeks ahead. Hence our best guess is the ASX200 will take a breather now and probably rotate between 7000 and 7100 until we get further clarification on the current economic strength from Australian companies.
As expected the market is also slowing down on both the volume and intra-day trading range front, this should be no surprise with a US holiday tonight, China’s New Year on Saturday night and our own Australia Day next Monday, there are simply plenty of easy reasons for fund mangers & investors to cite for sitting on their hands this week before getting into reporting season in February. As a side note of interest imagine the almost 3 billion individual trips which are expected over this Chinese Lunar holiday period, I’m sure very few of them are thinking about stocks, it puts our own school holidays into perspective which are coming to an end in 2-weeks.
MM remains bullish the ASX200 while it holds above 6930.
Overnight US stocks were closed for Martin Luther King Jr: Day while the SPI futures are calling the ASX200 to open just a few points higher.
Today we’ve looked at the Insurance Sector as first it gets squeezed by the catastrophic bushfires and now an ageing population has seen increasing claims putting pressure on our health insurers.
ASX200 Chart
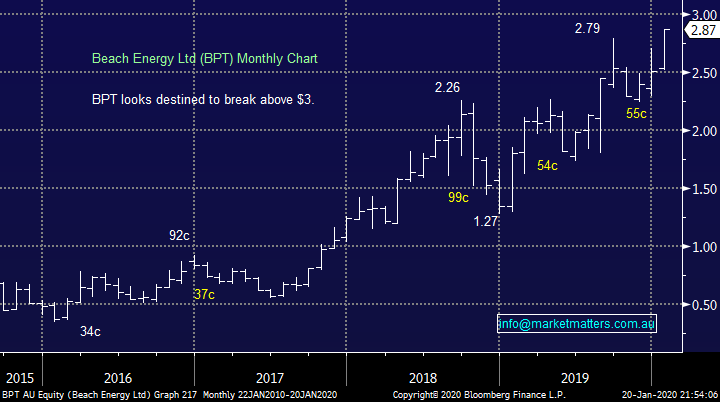
Happily, the 4th best performing stock yesterday Beach Petroleum (BPT) resides in the MM Growth Portfolio, the +3.6% advance by the oil & gas business to fresh post GFC highs is following our anticipated path for the stock. This is another MM position with a “paper profit” that we are comfortable letting run.
MM remains bullish BPT with a target ~$3.20.
Beach Petroleum (BPT) Chart
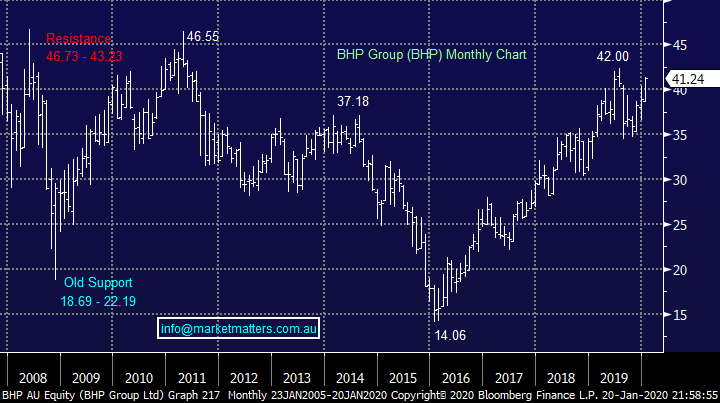
BHP Group (BHP) is similarly testing some important resistance areas, both last years and its post GFC high. The 3 local heavyweight miners BHP, RIO and Fortescue continue to move from strength to strength as commodities rally and investors start to lick their lips in anticipation of some likely chunky dividends in February – most analysts have them all yielding above 5% this year before we consider the attractive franking credits hence MM will be relatively pedantic if / when we take profit on some of our exposure to the group.
This morning, BHP released 2Q production numbers and they were mostly inline to a touch light on if we’re splitting hairs, although full year guidance was maintained, I’m in Sky around 10.15am discussing the release if anyone has an inclination to tune in.
MM remains bullish BHP looking for another 5-7% upside.
BHP Group (BHP) Chart
The Australian Insurance Sector
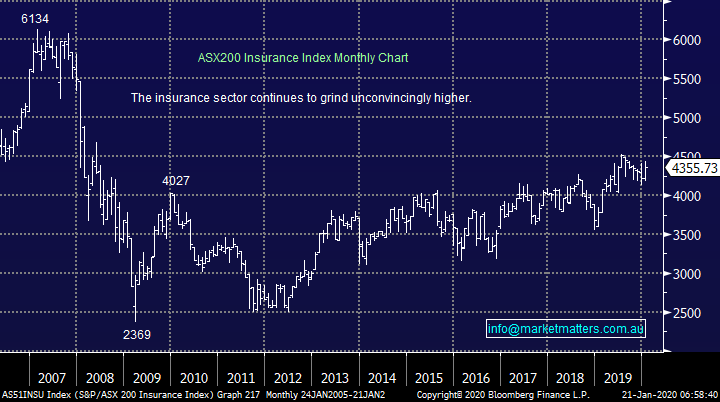
The Australian Insurance Sector comprises 6 members all of which are looked at briefly below, as an index its only regained about 50% of its GFC losses, an awful performance compared to the ASX200 which is making fresh all-time highs. Hence the index is not a huge influence on the local sector with the 2 largest stocks in the group Insurance Australia (IAG) and Suncorp (SUN) both individually making up under 1% of the ASX200.
At a sector level, MM is neutral the Insurance Index with a slight negative bias hence we will be wearing a “cautious hat” when we look at the 6 stocks in the sector.
ASX200 Insurance Sector Chart
Below is a relatively quick look at the 6 respective stocks as we potentially search for a needle in the proverbial haystack.
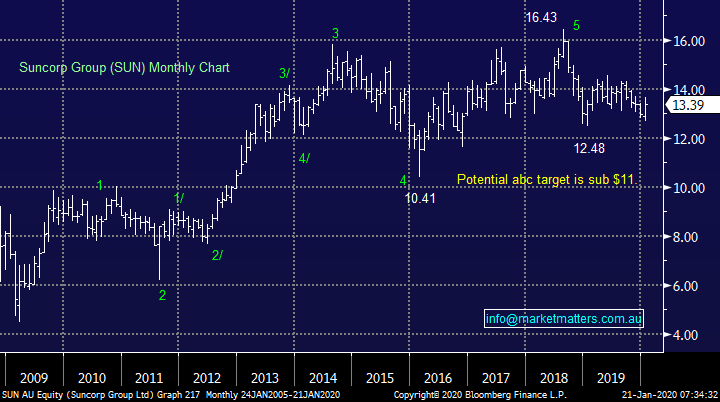
1 Suncorp Group (SUN) $13.39
MM hasn’t considered SUN as an investment since we exited our position back in 2018 and the stock continues to follow our technical path which has an ultimate target over 15% lower.
Fundamentally the Queensland based bank / insurer is forecast to yield 5.5% fully franked this year but at this stage we feel far more comfortable investing in the “Big Four” for this level of yield as opposed to SUN. Two of its largest insurance subsidiaries AAMI and GIO will be adversely affected by the bushfires but reinsurance provisions means that the likely worst hit AAMI has a $200m capped exposure hence the SUN share price hasn’t collapsed as many would have imagined but they’ve also suffered elevated claims due to storms, flood etc as our climate continues to break records in all directions. Hard to be bullish on insurance in this day and age!
Unfortunately were also not excited by the companies banking division which looks set to struggle in the next few years as interest rates remain at all-time lows, interestingly US investment bank Morgan Stanley has followed our lead here and have a sell / target close to $12 on SUN.
MM remains neutral / bearish SUN.
Suncorp Group (SUN) Chart
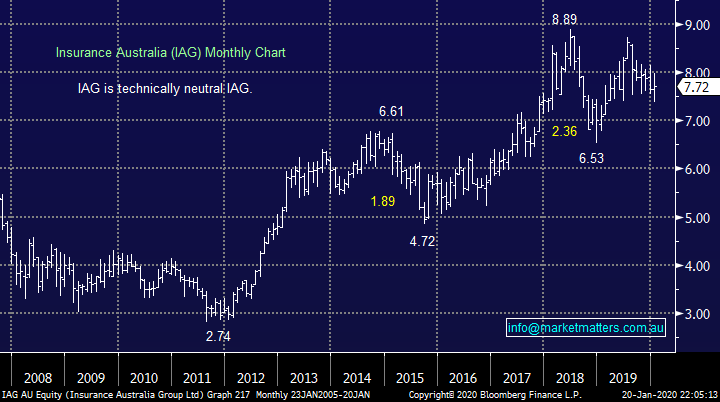
2 IAG Insurance (IAG) $7.72
IAG is Australia’s largest insurance company operating household names like NRMA, similar to SUN through reinsurance its mitigated large earnings damage from the recent extreme weather conditions allowing the shares to continue tracking sideways. However its hard to imagine the business enjoying exciting profit growth in the foreseeable future.
Although the IAG is likely to yield ~4.5% part franked in 2020 we don’t find it a particularly exciting yield play.
MM is neutral IAG.
IAG Insurance (IAG) Chart
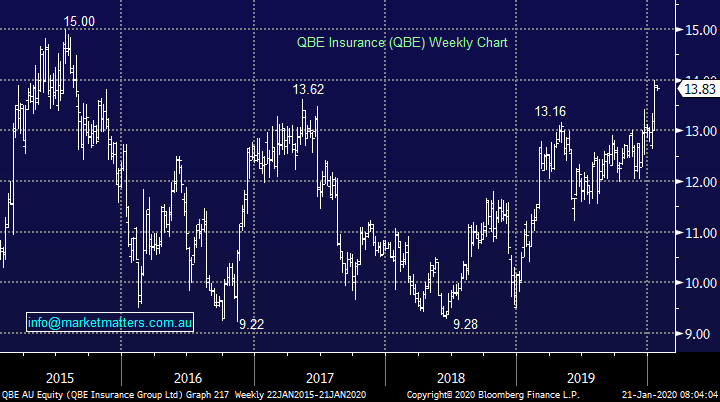
3 QBE Insurance (QBE) $13.83
QBE Insurance has been a serial underperformer over the last decade, remember the stock was trading above $35 in 2007. However we feel QBE has seen the back of its nasty surprises leaving the question if / where is the stock a buy. Things have now become a touch tougher for the buyers with the stock no longer priced for anticipated “nasty surprises”, the shares are now trading on a P/E for 2019 of 16.2x while it yields almost 4% part franked.
QBE might well be poised to enter an upgrade cycle after enduring a decade of the opposite but obviously some of this potential is already built into the recent rally towards $14 reducing the risk / reward but we could be buyers with stops below $13. Fundamentally QBE benefits from rising bond yields which MM can see unfolding later in 2020 plus a falling $A but we are bullish the $A hence on balance this should have a neutral impact on the stock with the overall operations at QBE likely to have far more impact on the share price.
MM is neutral / bullish QBE ~$14.
QBE Insurance (QBE) Chart
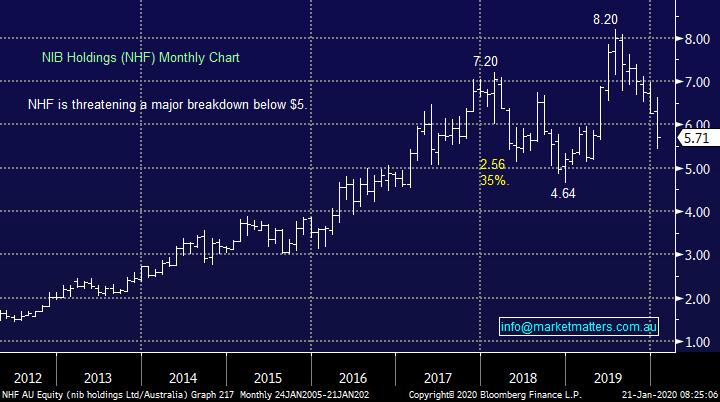
4 NIB Holdings (NHF) $5.71
Health insurer NHF received the wrath of the market yesterday after delivering a major downgrade of almost 20% from consensus and as expected the market has no tolerance for bad news after its strong run, although we note NHF has not participated in the broader market strength. An uptick in claims was blamed but our concern is this is likely to be an ongoing issue with our ageing population – I’m glad we took our $$ and ran back in July above $8.
One of my concerns for NHF is many of my friends / colleagues who have private health insurance only do so due to the tax implications not because they see particular value in the product / offering and I know of a number who are still considering saying goodbye to what was an automatic family cost just a few years ago i.e. a potentially a tough environment for margins.
Technically the stock has probably seen the worst of its correction to the multi-year rally but a break of $5 would not surprise.
MM is neutral / bearish NHF.
NIB Holdings (NHF) Chart
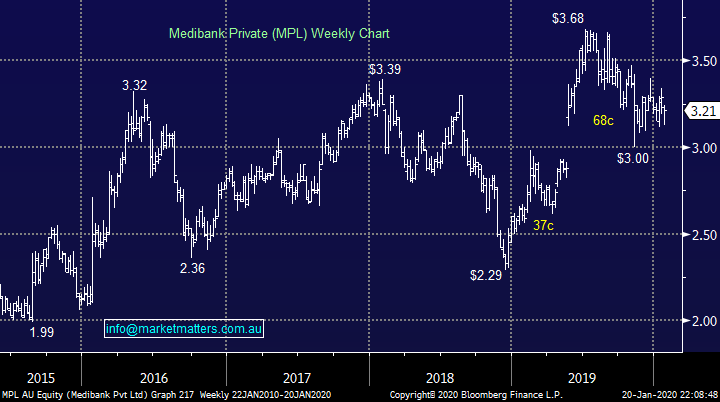
5 Medibank Private (MPL) $3.21
Fundamentally we have similar concerns for MPL as we do NHF which is no surprise as they operate in the same space hence MPL fell -2.4% yesterday although nothing like as bad as NHF’s -12.7%.
Technically MPL looks capable of breaking down towards $2.50 but no specific sell signals are in place.
MM is neutral / negative MPL.
Medibank Private (MPL) Chart
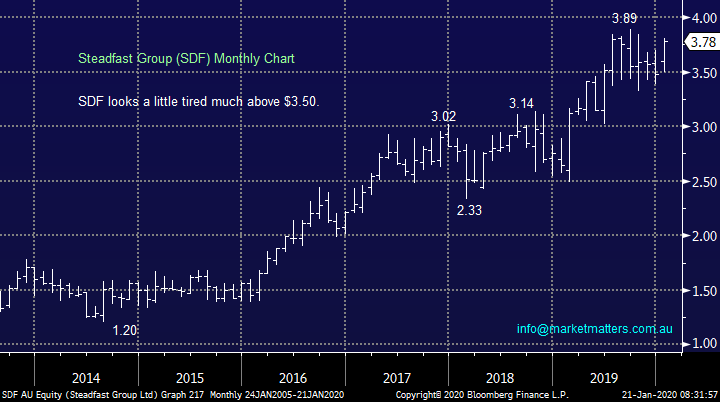
6 Steadfast Group (SDF) $3.78
Insurance broker SDF has been the standout performer in the sector rallying strongly over the last 3-years and at this stage we still can see the stock testing $4 as its forecast P/E of 23.8x for 2020 won’t worry some investors in the current value expansion environment, especially as many will have mandates that necessitate some $$ exposure to insurance.
The company announced a $100m capital raise last August to fund future acquisitions and general ongoing expenditure, the strong rally from this area illustrates the markets confidence in the businesses ability to deliver – at this stage of the markets rally we would consider the stock back around $3.50.
SDF is at the lower end of the dividend spectrum in the sector only paying 2.25% fully franked illustrating that high yield stocks are often the underperformers.
MM is short-term bullish SDF.
Steadfast Group (SDF) Chart
Conclusion
The only insurer MM would consider at today’s prices is QBE Insurance (QBE) followed by Steadfast (SDF).
Overnight Market Matters Wrap
- A quiet global session overnight as the US markets were closed for Martin Luther King holiday and the major Euro markets were mixed with little change.
- The IMF has predicted that world economic growth will increase in 2020 to 3.3% from 2.9% last year. Both these figures have been adjusted lower since October. There is, however, optimism that the fall in manufacturing caused by the trade war is bottoming with risks “less skewed” to negative outcomes.
- Across to the Asia Pacific region, we expect a quiet session towards the end of the week as the Lunar New Year celebrations kick on this weekend.
- On the commodities front, Aluminium, zinc and nickel rose on the LME, while iron ore quietens down towards the Lunar New Year festivities. Crude oil gained after a pipeline and ports were shut down by armed forces in Libya.
- The March SPI Futures is indicating the ASX 200 to open marginally higher, once again testing the 7100 level this morning.
Have a great day!
James & the Market Matters Team
Disclosure
Market Matters may hold stocks mentioned in this report. Subscribers can view a full list of holdings on the website by clicking here. Positions are updated each Friday, or after the session when positions are traded.
Disclaimer
All figures contained from sources believed to be accurate. All prices stated are based on the last close price at the time of writing unless otherwise noted. Market Matters does not make any representation of warranty as to the accuracy of the figures or prices and disclaims any liability resulting from any inaccuracy.
Reports and other documents published on this website and email (‘Reports’) are authored by Market Matters and the reports represent the views of Market Matters. The Market Matters Report is based on technical analysis of companies, commodities and the market in general. Technical analysis focuses on interpreting charts and other data to determine what the market sentiment about a particular financial product is, or will be. Unlike fundamental analysis, it does not involve a detailed review of the company’s financial position.
The Reports contain general, as opposed to personal, advice. That means they are prepared for multiple distributions without consideration of your investment objectives, financial situation and needs (‘Personal Circumstances’). Accordingly, any advice given is not a recommendation that a particular course of action is suitable for you and the advice is therefore not to be acted on as investment advice. You must assess whether or not any advice is appropriate for your Personal Circumstances before making any investment decisions. You can either make this assessment yourself, or if you require a personal recommendation, you can seek the assistance of a financial advisor. Market Matters or its author(s) accepts no responsibility for any losses or damages resulting from decisions made from or because of information within this publication. Investing and trading in financial products are always risky, so you should do your own research before buying or selling a financial product.
The Reports are published by Market Matters in good faith based on the facts known to it at the time of their preparation and do not purport to contain all relevant information with respect to the financial products to which they relate. Although the Reports are based on information obtained from sources believed to be reliable, Market Matters does not make any representation or warranty that they are accurate, complete or up to date and Market Matters accepts no obligation to correct or update the information or opinions in the Reports. Market Matters may publish content sourced from external content providers.
If you rely on a Report, you do so at your own risk. Past performance is not an indication of future performance. Any projections are estimates only and may not be realised in the future. Except to the extent that liability under any law cannot be excluded, Market Matters disclaims liability for all loss or damage arising as a result of any opinion, advice, recommendation, representation or information expressly or impliedly published in or in relation to this report notwithstanding any error or omission including negligence.


