AMP et, al. leads the ASX200 off the abyss! (WSA, ALL, IVC, FMG)
A tsunami of selling hit the ASX200 yesterday, especially after 3.30pm when the most optimistic of traders realised there was no bounce in sight, the paper losses for the market totalled just under $50bn. The selling hit many sectors from diversified financials, energy, resources to retail with an amazing 26 stocks in the ASX200 falling by 5%, or more. However the standout story was clearly household name AMP which collapsed over 24%, closing at a fresh all-time low of $2.50. The once proud insurer is now only 0.51% of the ASX200, smaller than the likes of Crown (CWN), REA Group (REA), Tabcorp (TAH) and Treasury Wines (TWE).
Our market was one of the worst in Asia compared with Hong Kong -1%, New Zealand -0.9% and China which actually closed marginally higher, only Japan of the big names performed worse than us. The panic was most felt in the SPI futures which saw 14,000 contracts change hands in the final 30mins of the day, to put this in context a normal good days volume is 30,000 contracts – investors / traders were dumping our broad market in panic fashion.
Technically we went into yesterday bullish from the 5750-5775 area, hence we were clearly looking well off the money by the market’s close, and being forced to question our market interpretation. However with the current extreme market volatility, plus the substantial market negative influence caused by AMP we have stuck with our interpretation – just!
MM remains mildly bullish the ASX200 short-term targeting the 5900 area in the short term.
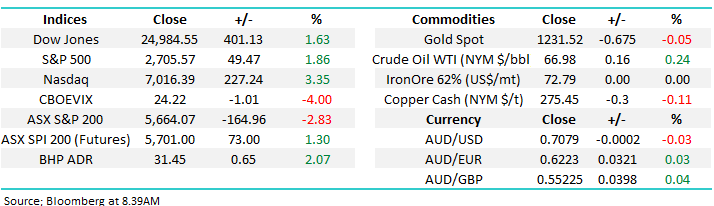
Overnight US stocks bounced strongly with the Dow gaining over 400-points and the NASDAQ a more impressive 227 / 3.35%. The local market is set to open up ~50-points / 1% with BHP closing up almost 2% in the US, regaining half of yesterday’s fall.
NB The severity of yesterday’s decline is unlikely to dissipate anytime soon from a sentiment perspective and it’s probably going to need more than just one positive day by global markets before any meaningful confidence returns - but there is undoubtedly a lot of cash on the sidelines and yesterday’s move had the stiff of capitulation.
Today’s report is going to look at the market “set up” on the stock specific level which has added some weight to our view that a decent bounce for stocks in general is the most likely short-term path.
ASX200 Chart
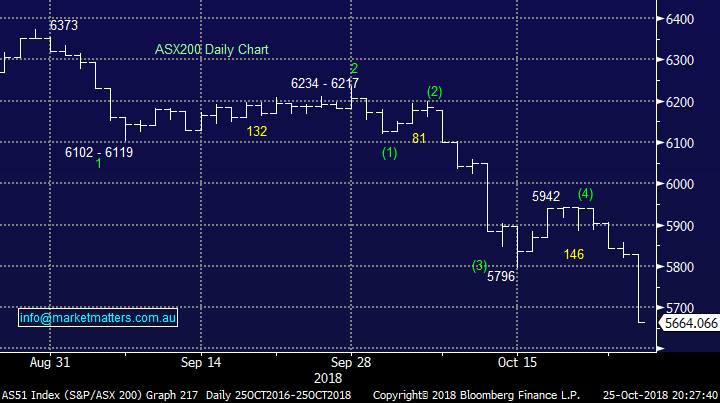
Bullish Technical set up.
Amongst Monday’s questions was one on our technical interpretation of Kidman Resources (KDR), the question and answer are below:
“Hi James, would you be able to explain and illustrate your view that KDR looks to be a good technical buy? I can’t see the technical rationale about this, so hoping you can explain.” - With thanks, Paul H.
Answer:
Hi Paul,
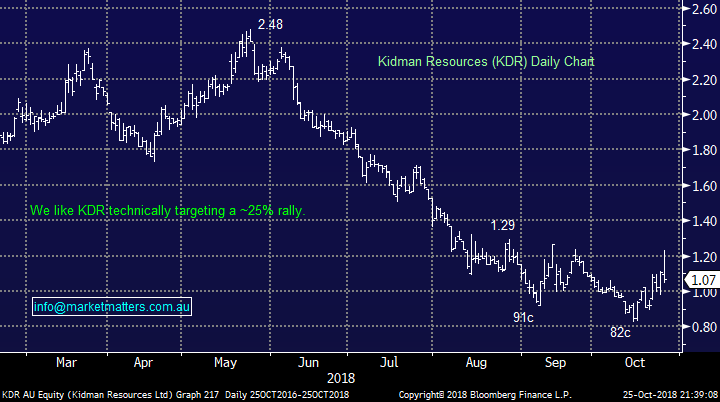
So far so good, we thought the market would bounce the first time it dipped under $1, albeit an extremely brief 30% rally to test the previous $1.30 resistance area.
We now see a Neutral Pattern between 91c and $1.29 (normal distribution of trading activity), the drop below 91c and close back above 96c triggers a technical buy signal using Steidlmayer Distribution / Market Profile.
MM is bullish technically targeting another ~30% rally into Christmas. - MM
Yesterday even while the market was crumbling before our eyes, KDR rallied strongly in the morning to be up almost 30% from when we penned the above, not bad in a falling market.
The technical picture has has a number of facets / catalysts before we will call a stock / market a buy, or sell in reverse, but in simple terms:
When a market has been in a prolonged bear trend in the case of KDR, a reliable trigger for a buying opportunity is a failed attempt to break to a fresh low, in this case below 91c – this of course assumes the business as a whole meets other criteria.
Once KDR had failed to follow through on the downside below 91c we became confident that a test of previous short-term resistance above $1.20 was the most likely immediate path.
Like all chart patterns this is not infallible, but we believe it has an over 75% strike rate when used correctly. Importantly we revisit this today simply because there are a number of other examples present in today’s market.
Kidman Resources (KDR) Chart
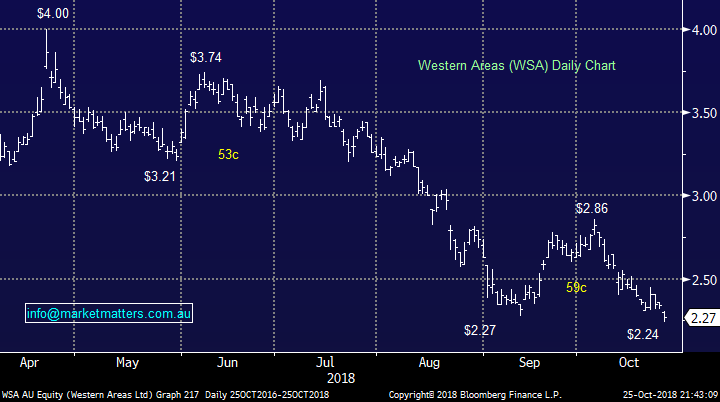
Western Areas (WSA) $2.27
MM has had nickel miner, WSA on our buy radar for all of October with a targeted failed break below $2.27, before an over 20% rally towards $2.80.
Yesterday we attempted to pre-empt the failure below $2.27 for 2 reasons, firstly on a fundamental level, WSA scans very cheaply to us and secondly we are in general looking to increase our resources exposure into the current market weakness.
Unfortunately we missed our buying even in the markets savage sell-off with WSA hitting a $2.24 low but we had set our limit at the $2.20 area.
Although stocks bounced overnight nickel slipped lower which may still enable a decent entry level into WSA.
Watch for alerts, we may increase our limit this morning
Western Areas (WSA) Chart
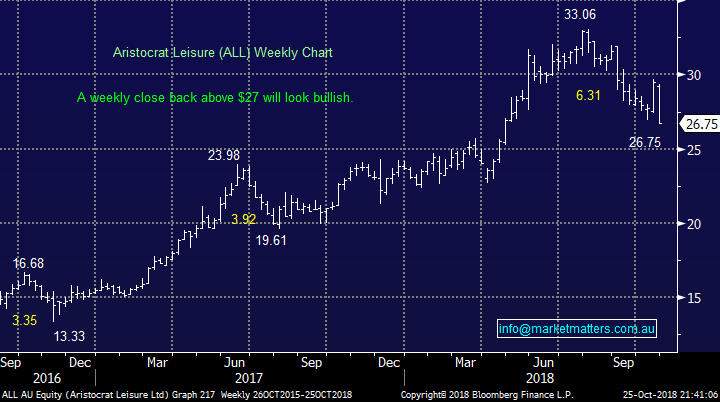
Aristocrat (ALL) $26.75
ALL is Interestingly one of the few high growth / valuation stocks in the MM Growth Portfolio and it’s still causing us a little pain even though we bought the stock 80% of the way into its current 19% pullback.
A decent close today back above $27 will trigger a short-term buy signal with a ~$29.50 target area, around 10% above yesterdays close.
Aristocrat (ALL) Chart
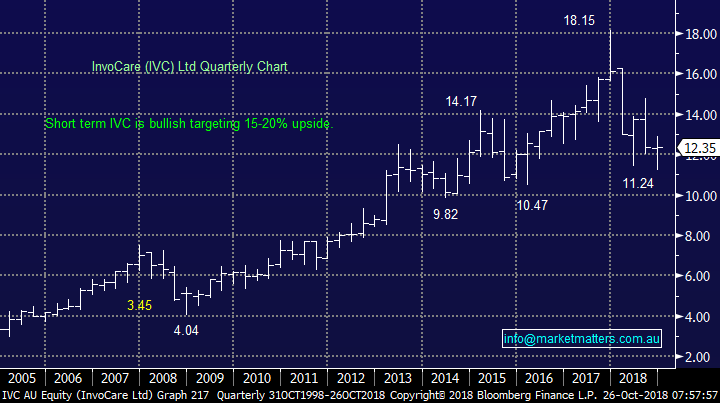
Invocare (IVC) $12.35
Funeral operator IVC has been under the cosh since the end of 2017 with weakness in the volume / growth of deaths (which is a positive for the majority of us!) plus concerns that the recent listing of rival Propel Funeral Partners (PFP) will lead to a reduction in margins as occurred in the UK with Dignity Plc when a rival entered the fray.
An almost 40% stock correction we believe more than covers a sharpening of the pencil by both Australian funeral operators.
Technically IVC looks to have made a failed attempt to break below $11.40 and our preferred scenario is a rally back towards $14.50, or over 15% higher.
IVC is a low Beta stock which may attract investors in today’s market i.e. IVC does its own thing, its not highly correlated to the ASX200.
Invocare (IVC) Chart
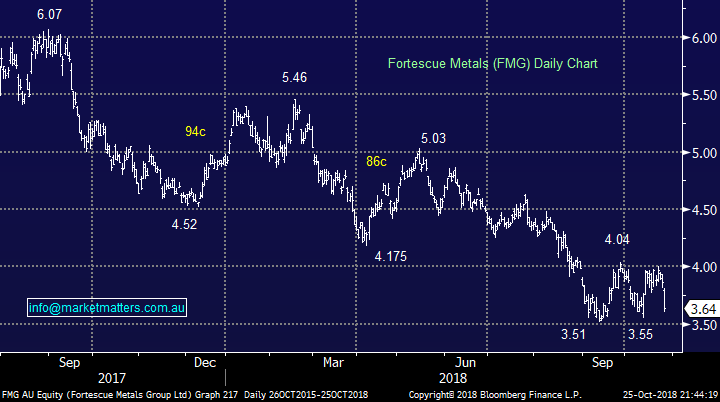
Fortescue Metals (FMG) $3.64
FMG is evolving in a similar manner, but importantly it hasn’t broken to new lows to generate a buy signal, perhaps one for the traditional Christmas rally.
MM will be interested in FMG below $3.50 targeting a ~15 to 20% rally in the Growth Portfolio.
This is a stock like WSA, which scans attractively to MM from a fundamental perspective.
Fortescue Metals (FMG) Chart
Conclusion
We are now mildly bullish stocks from current levels, but looking to reduce our market exposure into strength, ideally ~5950 for the ASX200.
Overseas Indices
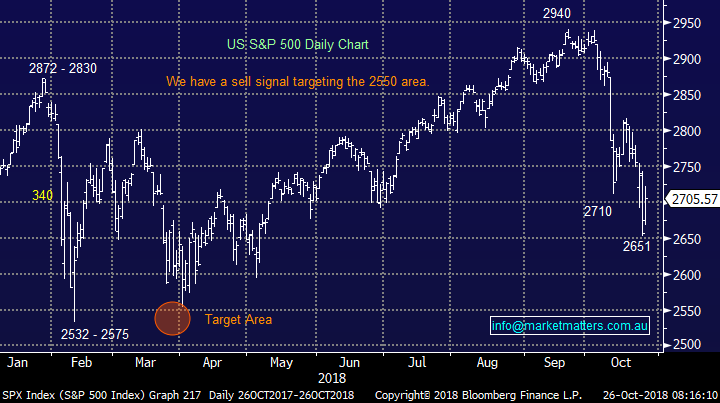
The US S&P500 exceeded our first target area by one panic day and ideally will now rotate back towards 2825-2850.
The current volatility should not be underestimated, this is not a buy and hold market.
US S&P500 Chart
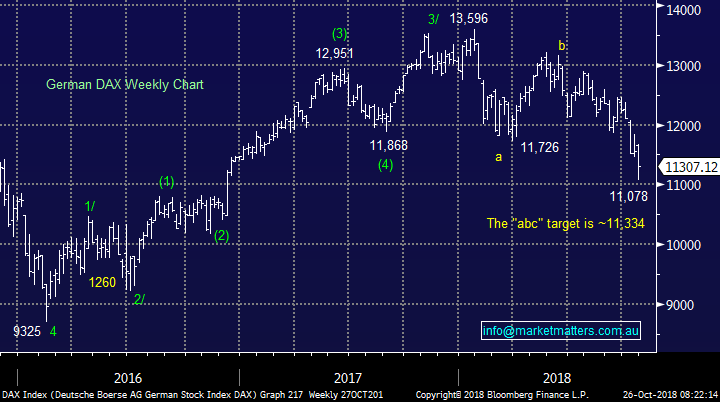
European indices are now also neutral with the German DAX hitting our target area which has been in play since January. To turn us bullish we need to see strength above 11,800.
German DAX Chart
Overnight Market Matters Wrap
· The US equity markets finally witnessed some solid investor support overnight with the three key indices recovering strongly, as the technology sector in particular led the way, following Microsoft’s better than expected quarterly earnings. The tech heavy Nasdaq 100 rallied 3.35%, the S&P 500 1.86% and the Dow up 1.63% as investors sought to take advantage of this month’s ferocious market selloff. Microsoft’s strong earnings saw the stock rise over 6% and sparked a rebound in the technology and communications sectors. Tesla also recovered strongly after posting a profit for the first time while Twitter jumped 15% on better earnings.
· But the rally was not solely the technology sector as most sectors including financial and cyclical stocks joined in with Visa, Goldman Sachs and Caterpillar leading the charge.
· Locally, the December SPI Futures is indicating the ASX 200 to claw back some of yesterday’s gains, opening up 56 points towards the 5720 level this morning.
Have a great day!
James & the Market Matters Team
Disclosure
Market Matters may hold stocks mentioned in this report. Subscribers can view a full list of holdings on the website by clicking here. Positions are updated each Friday, or after the session when positions are traded.
Disclaimer
All figures contained from sources believed to be accurate. Market Matters does not make any representation of warranty as to the accuracy of the figures and disclaims any liability resulting from any inaccuracy. Prices as at 26/10/2018
Reports and other documents published on this website and email (‘Reports’) are authored by Market Matters and the reports represent the views of Market Matters. The MarketMatters Report is based on technical analysis of companies, commodities and the market in general. Technical analysis focuses on interpreting charts and other data to determine what the market sentiment about a particular financial product is, or will be. Unlike fundamental analysis, it does not involve a detailed review of the company’s financial position.
The Reports contain general, as opposed to personal, advice. That means they are prepared for multiple distributions without consideration of your investment objectives, financial situation and needs (‘Personal Circumstances’). Accordingly, any advice given is not a recommendation that a particular course of action is suitable for you and the advice is therefore not to be acted on as investment advice. You must assess whether or not any advice is appropriate for your Personal Circumstances before making any investment decisions. You can either make this assessment yourself, or if you require a personal recommendation, you can seek the assistance of a financial advisor. Market Matters or its author(s) accepts no responsibility for any losses or damages resulting from decisions made from or because of information within this publication. Investing and trading in financial products are always risky, so you should do your own research before buying or selling a financial product.
The Reports are published by Market Matters in good faith based on the facts known to it at the time of their preparation and do not purport to contain all relevant information with respect to the financial products to which they relate. Although the Reports are based on information obtained from sources believed to be reliable, Market Matters does not make any representation or warranty that they are accurate, complete or up to date and Market Matters accepts no obligation to correct or update the information or opinions in the Reports. Market Matters may publish content sourced from external content providers.
If you rely on a Report, you do so at your own risk. Past performance is not an indication of future performance. Any projections are estimates only and may not be realised in the future. Except to the extent that liability under any law cannot be excluded, Market Matters disclaims liability for all loss or damage arising as a result of any opinion, advice, recommendation, representation or information expressly or impliedly published in or in relation to this report notwithstanding any error or omission including negligence.


