A few things on our radar as we commence 2020 (CBA, CSL, BHP, FMG)
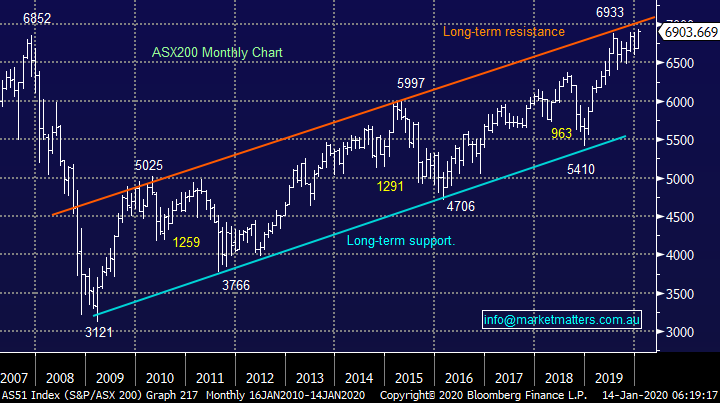
The ASX200 has kicked off 2020 in the same positive mood as last year with January already up +219-points / 3.3%. While we see no fundamental reasons to be scared for stocks just yet we are mindful that the best month in a very bullish 2019 was June which saw the ASX200 rally 376-points from its low, while 2 other months also rallied over 300-points from their respective lows. The point being another ~1% to test the psychological 7000 area and the local market is statistically likely to require at least a rest.
As we start the 12th year of the longest bull market in history a pertinent quote by famous investor John Templeton comes to mind:
“Bull markets are born on pessimism, grown on scepticism, mature on optimism and die on euphoria”: John Templeton 1912 – 2008.
At this stage the most bearish interpretation I can muster is we are now in a period of optimism; I’ve certainly not seen or felt any undue euphoria just yet. Fund managers turned bullish in a hurry at the end of last year as the US and China appeared to resolve their major differences, the largely followed Bank of America Survey showed world growth optimism jumped the most in history in November / December, perhaps a little euphoria is creeping in after all. Professional investors are now 31% overweight equities, the highest in a year potentially giving room for a pullback with people now long.
MM believes 2020 will be a more choppy year where alpha (value) can be added to portfolios by active investors who are prepared to fade the crowd.
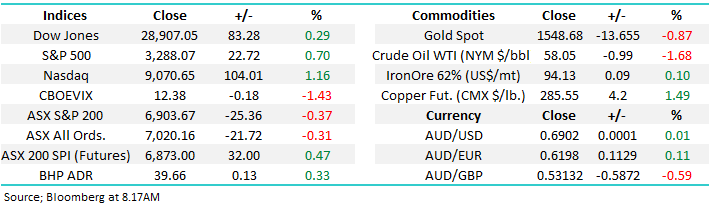
Overnight US stocks again made fresh all-time highs with the broad-based S&P500 gaining +0.65%, the SPI futures are indicting local stocks will open up almost +0.5% to test its all-time high.
Today we’ve looked at a few key markets and the 3 largest Australian stocks as we play our way into the new year like a cautious opening batsman. Some of the areas we have covered reiterate our thoughts in the MM Outlook Piece, but we’re keen for all subscribers to understand our thoughts as we enter an exciting new year.
ASX200 Chart
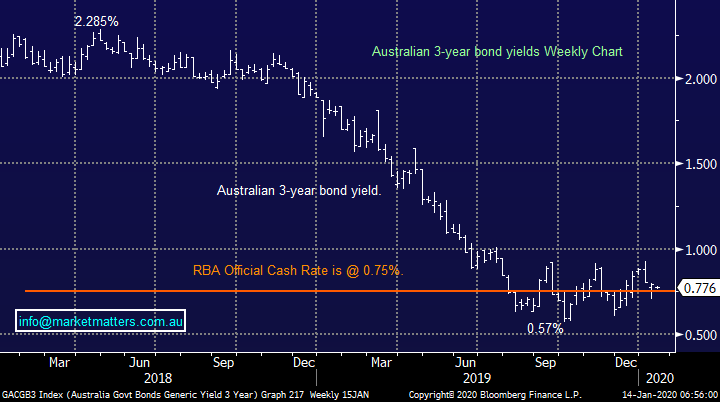
The hugely influential Australian 3-year bond yield continues to track sideways as fund managers balance the strength of the local / global economies, future RBA policy decisions and unfortunately the impact to domestic growth by the calamitous bushfires.
While at MM we continue to believe bond yields have seen their low, we’re on the fence as to whether or not the law (0.57%) will be tested again – my “Gut Feel” is that it probably will give the engrained nature of the trend i.e. it generally takes a few false dawns before the sun rises on such a long standing trend formation.
Ideally MM would be a buyer of a retest of lows in local bond yields.
Australian 3-year Bond Yield Chart
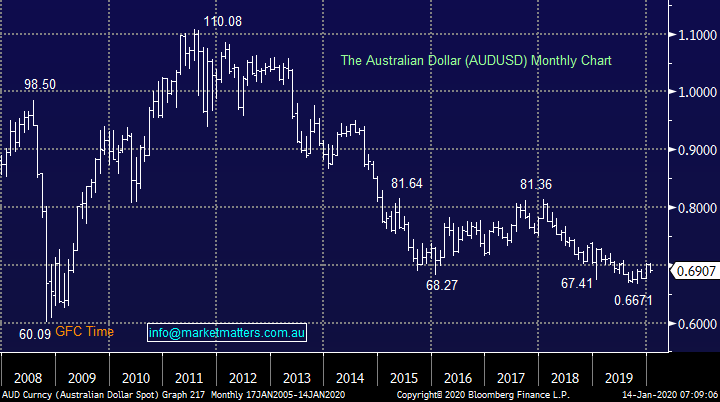
Similar to local bond yields the $A has been chopping around in a tight range for many months which makes sense considering the significant influence on a currency by its domiciled interest rates. We remain bullish the $A which implies bond yields will eventually turn higher but well-established bull and bear markets rarely roll over without a fight.
MM remain bullish the $A into 2020 / 2021 eventually targeting the 80c area.
Australian Dollar ($A) Chart
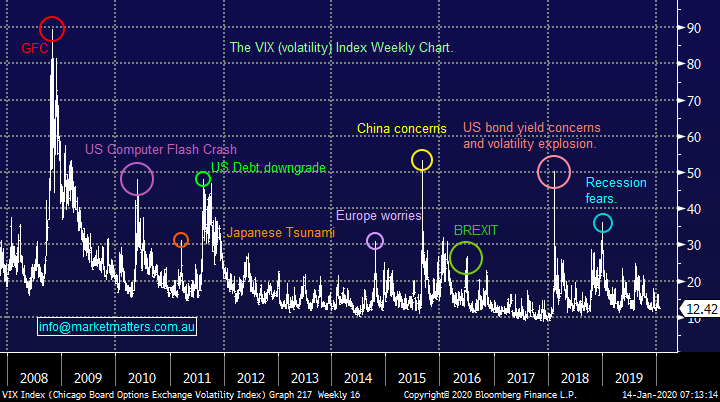
Recently stocks have largely ignored the likes of missile strikes and unrest in the oil market but interestingly, while US equities continually march to higher highs the VIX is not testing fresh lows – this divergence implies investors are becoming nervous and buying market protection in the form of Puts – something we are seeing in large volumes particularly in the US banking stocks which start reporting tonight.
Historically this has been a warning of a market pullback but not a signal to sell.
The VIX / Fear Gauge (volatility index) Chart
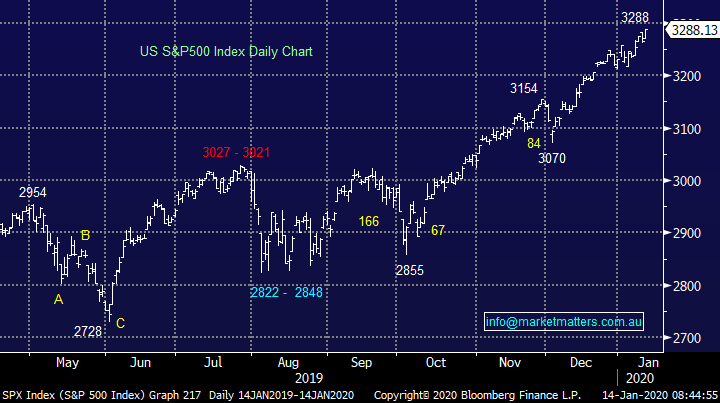
When we stand back and look at the runaway train being the US market the same 2 things jump out at me which we’ve been watching for the last few quarters:
1 – While the S&P500 remains in a clear bullish uptrend another 2-3% pullback feels close at hand i.e. it doesn’t feel an opportune time to chase stocks in the short-term.
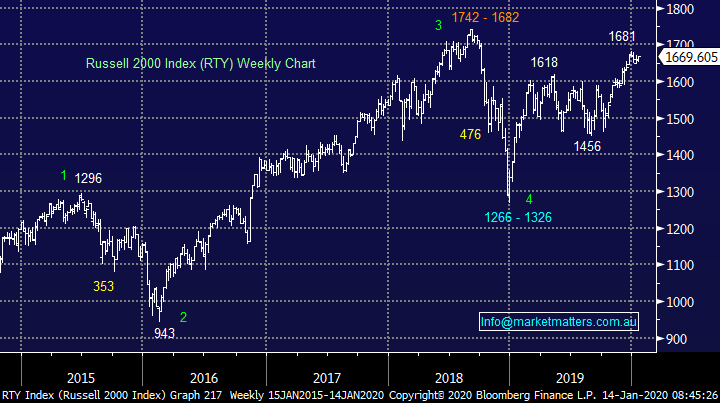
2 – The Russell 2000 small cap index remains in bullish catch up mode compared to its larger peers with an eventual target ~6-8% higher.
In other words, while US stocks may be in a very mature bull market selling weakness is fraught with danger, we feel it’s time to sell excessive strength and buy weakness.
US S&P500 Index Chart
US Russell 2000 Index Chart
Australia’s largest 3 listed stocks
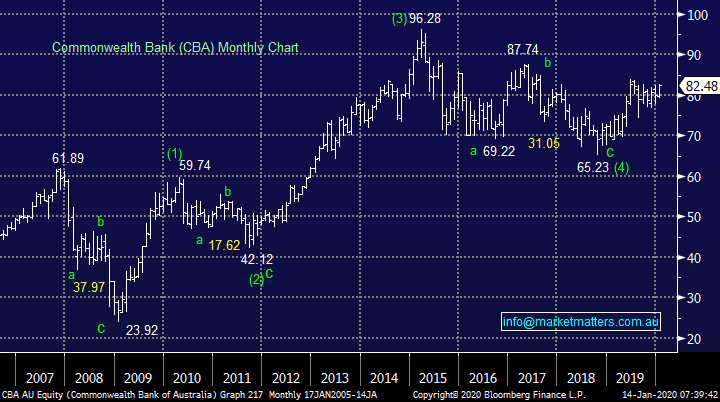
Even while the local banking sector has been well and truly thrown into the naughty corner Commonwealth Bank (CBA) maintains its position as Australia’s largest stock, now comprising of 7.3% of the ASX200. With the bank yielding 5.23% fully franked compared to the average term deposit paying sub 1.5% (unfranked) plus interest rates appearing to now have limited downside, which is good news for bank margins, MM can see the sector surprising many by delivering solid returns this year.
MM remains bullish CBA with our initial target above $85.
Commonwealth Bank (CBA) Chart
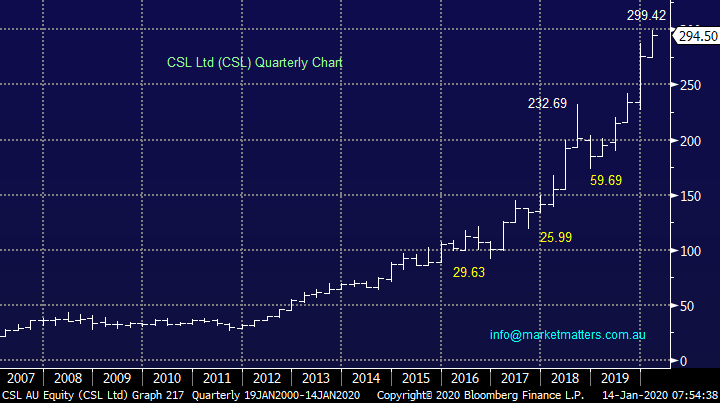
CSL’s meteoric rise has taken the blood plasma business to a market cap of over $133bn making it the second largest company on the bourse, well ahead of many household names. This is undoubtedly a world class business with the main question being what price represents value for especially as the stock has corrected between 15% and 25% three out of the last four years, in other words the patient investors whose prepared to buy CSL when others are fleeing can often gain more optimal entry levels into the stock.
Also, CSL is a major $US earner hence if we are correct and the $A is headed up towards 80c a significant tailwind might be about to become a headwind for CSL which would be a potential catalyst to create a pullback in the stock.
We also caution that this is the most crowded long / bullish trade on the ASX, even ahead of AfterPay (APT) which is saying something. Crowded trades have a tendency to unravel at some point!
MM likes CSL as a business but is reticent to chase the stock around $300.
CSL Ltd (CSL) Chart
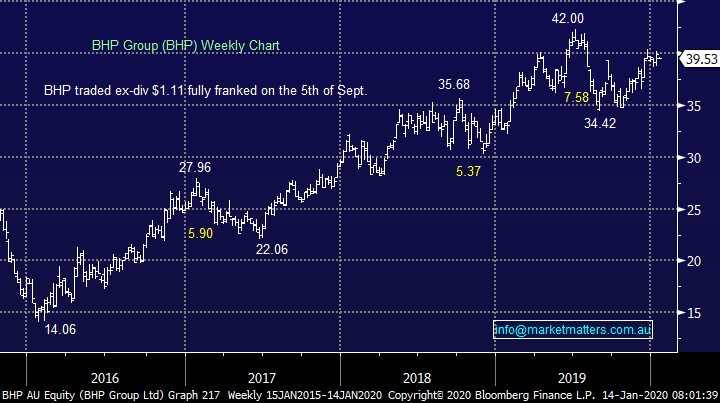
Lastly the old “Big Australian” BHP Group (BHP) which has slipped down the rankings to become the 3rd largest listed company on our shores. We remain bullish the resources complex with diversified goliath BHP perfectly positioned, our initial target is ~8% higher plus the stock is due to pay an attractive fully franked dividend in March.
If / when BHP does break above $42, we will be considering taking some $$ from the table, especially as we are also long the highly correlated RIO Tinto (RIO).
MM is bullish BHP targeting a break of its 2019 high.
BHP Group (BHP) Chart
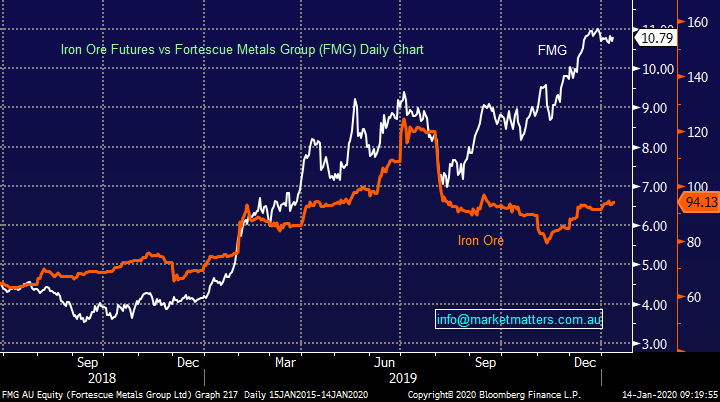
Interesting, yesterday we saw Fortescue Metals (FMG)’s largest shareholder (aside from Andrew Forrest) sell 1.26% of the company. Hunan Valin held 402m shares in FMG representing 13.06% of the company and sold 39m shares / $218m worth. They originally picked up their stake at $2.48 so clearly a big win, however insiders trimming positions into strength implies they believe FMG is now stretched.
We agree with FMG running very hard relative to the underlying Iron Ore price. Gaps like this typically close.
Fortescue Metals v Spot Iron Ore
Conclusion
At this stage while we sit outright bullish CBA / BHP and keen to buy CSL into weakness there appears no reason to be pressing the “sell button” with any enthusiasm but we will continue to look for opportunities to add alpha around the edges as the indices / stocks become too excited in either direction.
Overnight Market Matters Wrap
- The US equity markets started the second week of the year in positive territory, led by the tech. heavy Nasdaq 100 in further signs of an easing of tensions between the US and China, the US has removed China from the list of currency manipulators.
- On the commodities front, both copper and iron ore prices jumped gained, while oil and gold prices eased as US-Iranian tensions were pushed to one side.
- The March SPI Futures is indicating the ASX 200 to open 35 points higher, towards the all-time high levels of 6933 this morning.
Have a great day!
James & the Market Matters Team
Disclosure
Market Matters may hold stocks mentioned in this report. Subscribers can view a full list of holdings on the website by clicking here. Positions are updated each Friday, or after the session when positions are traded.
Disclaimer
All figures contained from sources believed to be accurate. All prices stated are based on the last close price at the time of writing unless otherwise noted. Market Matters does not make any representation of warranty as to the accuracy of the figures or prices and disclaims any liability resulting from any inaccuracy.
Reports and other documents published on this website and email (‘Reports’) are authored by Market Matters and the reports represent the views of Market Matters. The Market Matters Report is based on technical analysis of companies, commodities and the market in general. Technical analysis focuses on interpreting charts and other data to determine what the market sentiment about a particular financial product is or will be. Unlike fundamental analysis, it does not involve a detailed review of the company’s financial position.
The Reports contain general, as opposed to personal, advice. That means they are prepared for multiple distributions without consideration of your investment objectives, financial situation and needs (‘Personal Circumstances’). Accordingly, any advice given is not a recommendation that a particular course of action is suitable for you and the advice is therefore not to be acted on as investment advice. You must assess whether or not any advice is appropriate for your Personal Circumstances before making any investment decisions. You can either make this assessment yourself, or if you require a personal recommendation, you can seek the assistance of a financial advisor. Market Matters or its author(s) accepts no responsibility for any losses or damages resulting from decisions made from or because of information within this publication. Investing and trading in financial products are always risky, so you should do your own research before buying or selling a financial product.
The Reports are published by Market Matters in good faith based on the facts known to it at the time of their preparation and do not purport to contain all relevant information with respect to the financial products to which they relate. Although the Reports are based on information obtained from sources believed to be reliable, Market Matters does not make any representation or warranty that they are accurate, complete or up to date and Market Matters accepts no obligation to correct or update the information or opinions in the Reports. Market Matters may publish content sourced from external content providers.
If you rely on a Report, you do so at your own risk. Past performance is not an indication of future performance. Any projections are estimates only and may not be realised in the future. Except to the extent that liability under any law cannot be excluded, Market Matters disclaims liability for all loss or damage arising as a result of any opinion, advice, recommendation, representation or information expressly or impliedly published in or in relation to this report notwithstanding any error or omission including negligence.


