A few alarm bells are ringing in bond land – (APX, BHP, GDX, NST)
Happy Friday on the last trading day of August - we also wave goodbye to reporting season and a very choppy month. The ASX200 didn’t appear to do a great deal yesterday closing up only +0.1% but it tried to go down for most of the session before finally closing around its highs, up around +0.5% from the intra-day low as the bears failed to take control. The influential banking sector enjoyed a strong performance, the day after it was used as a funding vehicle for the Macquarie Group (MQG) institutional $1bn capital raise. Interestingly losers managed to outstrip winners by 20% illustrating the importance of the banks in our index, this poor market breath is usually a bearish signal as it is when the IT sector underperforms i.e. Appen’s (APX) fall dragged the sector down almost 1%.
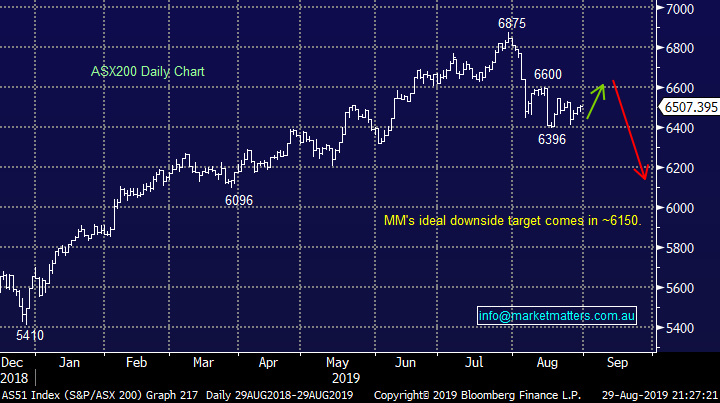
With the exception of the huge sell off mid-month, when the Dow tumbled 800-points on increased recession fears, it’s actually been relatively quiet at an index level over the last 3-weeks as the markets continued to follow MM’s anticipated path. If we are correct the ASX200 is likely to test the 6600 area before its time to move to a more defensive stance i.e. see the green and red arrows on the chart below, they’ve been correct so far hence MM has no reason to change its view. We remind subscribers of the Dot Theory we have alluded to in the past where statistically markets regularly form highs / lows early in a month e.g. in August the monthly high was on the 1st. Similarly we can see September’s high being formed early next week.
“80% of the time a market will form its high, or low, in the first 20% of any particular timeframe” – Dot Theory.
MM remains comfortable adopting a conservative stance towards equities, especially around the 6600 area.
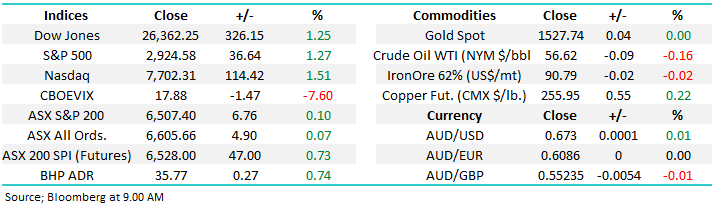
Overnight US stocks advanced strongly on US-China trade optimism, with the S&P500 rallying +1.3%, the SPI futures are calling the ASX200 to open up around 50-points this morning, putting it less than 1% away from our 6600 target area.
Today we have looked at the bond market, arguably the tail that wags the dog we call the stock market – a huge subject that we have attempted to KISS (keep it simple stupid).
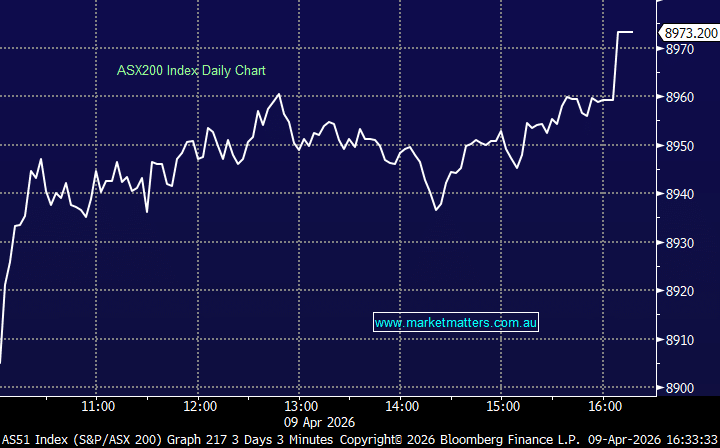
ASX200 Chart
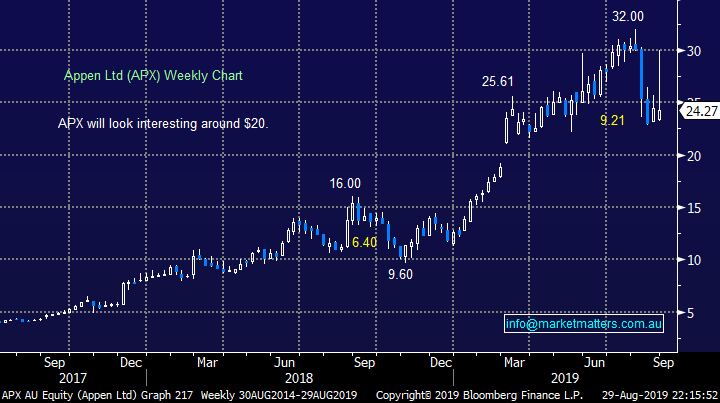
Yesterday Appen (APX) was smacked over 11% but the even more pronounced move was the intra-day decline after the stock initially rallied ~10% following the company report. As is often the case when a stock rallies into a result it proves hard to live up to expectations. APX reported some strong numbers but as we often say if everyone’s already long where’s the buying expected to come from i.e. in this case the market appeared to be positioned for an upgrade, not just a solid result.
This is the exact danger we have been outlining for the WAAAX (Wisetech, Afterpay, Altium, Appen, and Xero) stocks over recent months, MM has described it as “the elastic band of optimism being stretched too far leading to scary valuations.” There was nothing wrong with APX’s reported 60% increase in revenue to $245m while net profit after tax (NPAT) rose 67% to almost $30m.
MM likes APX around $21, or ~10% lower.
Appen Ltd (APX) Chart
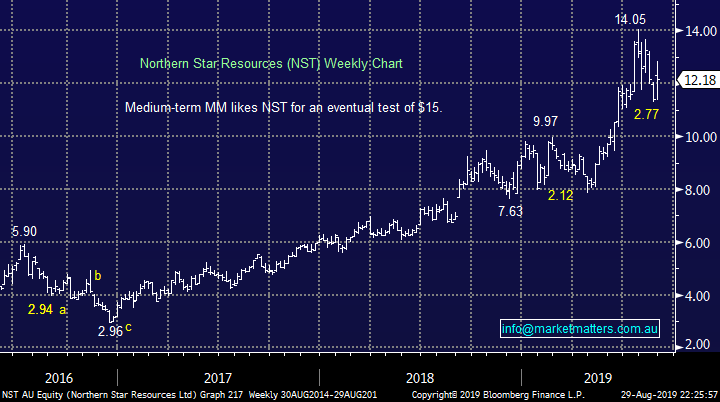
Northern Star Resources (NST) recovered strongly on Thursday to outperform the sector and close up +2.5%, nothing huge but noticeable when much of the sector struggled to close in the black.
Overnight gold fell $US12 leading to a ~3% drop in the gold miners ETF, this is a move which caught our eye as we are looking to buy weakness in the precious metal sector. NST has already corrected 20% and now looks attractive to us on any decent move back below $12.
MM likes NST around $11.50.
Northern Star Resources (NST) Chart
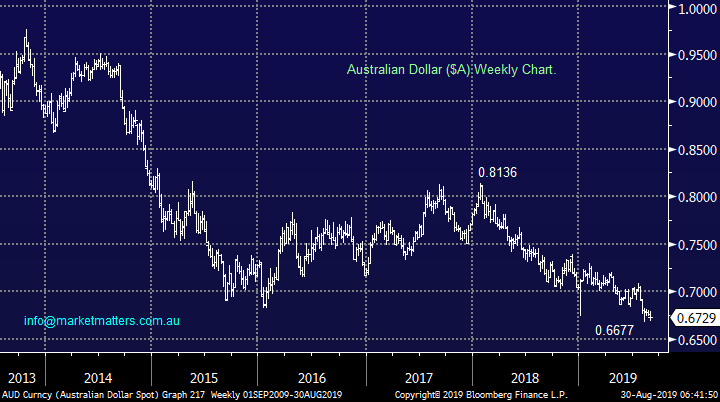
Similar to stocks most other markets have been quiet recently with the Aussie dollar actually bound between 67c and 68c since early August, an ok result considering that iron ore has corrected 30% in the last 2-months and the US bond yields have remained well above our own. Australian 3-year bonds have remained close to their all-time lows ~0.67% and although MM believes the RBA will cut rates this year the move appears factored into their price, we think another sharp decline by stocks is required to push them towards 0.5%.
Overnight US bond yields continued to track equities with the 10-years rallying back towards 1.5% but its only a blip in the ocean compared to the decline in both 2019 and this August.
Australian Dollar ($A) Chart
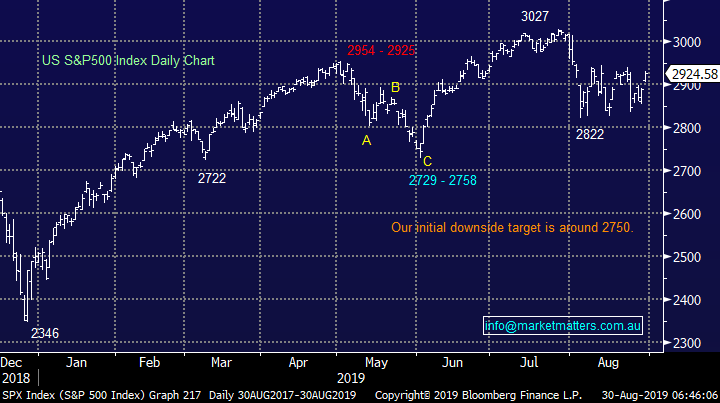
Still no change in our opinion for US stocks: “MM believes we have entered a new short-term cycle for US stocks where bounces should be sold by the active trader”.
Our medium-term target for this market correction is currently ~6% lower but we continue to feel a squeeze towards 2960, or 1-2% higher, to stop out all the shorts is a strong possibility i.e. remember the market likes to move in the path of most pain.
Our initial target for this pullback by US stocks is ~6% lower.
US S&P500 Chart
Bond & equity markets
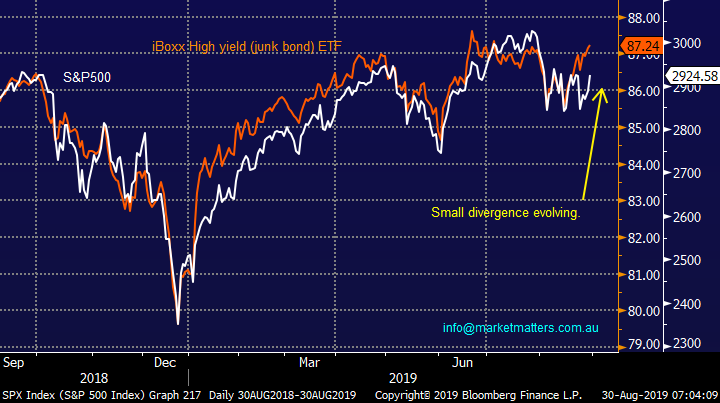
Whatever way we view markets a healthy bond market is almost a prerequisite for a bullish stock market, especially when numerous companies have been fuelling massive company buybacks by raising money in the bond market i.e. issuing company bonds, sometimes of low grade referred to as Junk Bonds (higher risk of default). The correlation between these corporate bonds is almost perfect as can be seen from the chart below.
However last week we saw a warning signal from the global bond market when Germany tried to raise Euro2bn but only managed well under Euro1bn, sure they are paying a negative yield but there’s been plenty of appetite for such bonds in the past – there are already $US16 trillion bonds paying negative yield i.e. bonds where investors are guaranteed to lose.
If countries have to increase the yield on their bonds to revive investors’ appetite the knock on effect will roll into the corporate market which is a very bearish catalyst for stocks.
MM is concerned that an inflection point for bond markets is on the horizon.
S&P500 v High yield (Junk Bond) ETF Chart
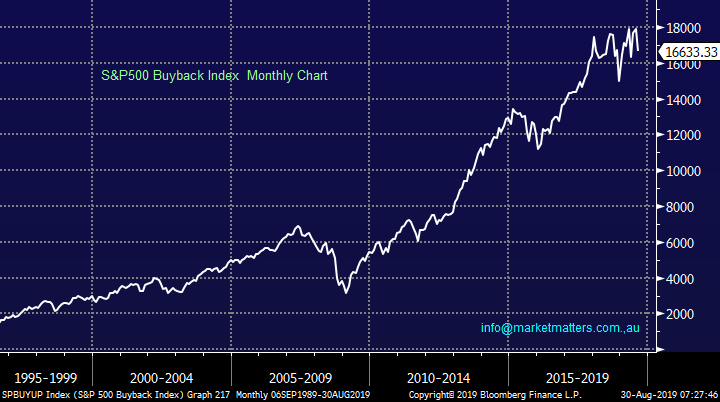
US companies are on track to buyback well over $US900Bn of stock in 2019 which combined with plunging bond yields is adding a massive tailwind for stocks. However we’ve now seen 2 consecutive quarters of lower $$ spent on buybacks as the sugar hit from Trumps tax reforms wears off. The combination of uncertainty around a global recession and US-China trade has put the brakes on companies chasing their own stock as the market trades around all-time highs raising questions on valuations.
While profits being retained by businesses for growth and flexibility is not an altogether bad thing it certainly removes a major short-term buyer from the market.
The chart below measures the performance of the top 100 stocks with the highest buyback ratio – looks like a carbon copy of the S&P500 itself.
S&P500 Buyback Index Chart
At MM we regularly attempt to look around 6-months ahead because the smart money is getting set before the obvious news hits the papers, 3 very big overlapping issues are looming in our opinion which will influence how we invest in the weeks / months ahead, especially when we consider simple risk / reward:
1 – The interest rate cycle feels very mature as central banks run out of room to cut interest rates further, hence they are likely to press the QE / fiscal stimulus (infrastructure spend) button to maintain post GFC expansion, inflation is likely to raise its head just when investors assume it’s a thing of the past.
2 - Company buybacks are likely to have topped out as interest rates / bond yields threaten to rally and stock valuations / prices sit around all-time highs.
3 – If central banks through a combination of fiscal and monetary policy fail to maintain growth in their economies we expect some shenanigans in the currency markets, just as Trump is already alluding to by his desire for a lower $US to improve their competitive position.
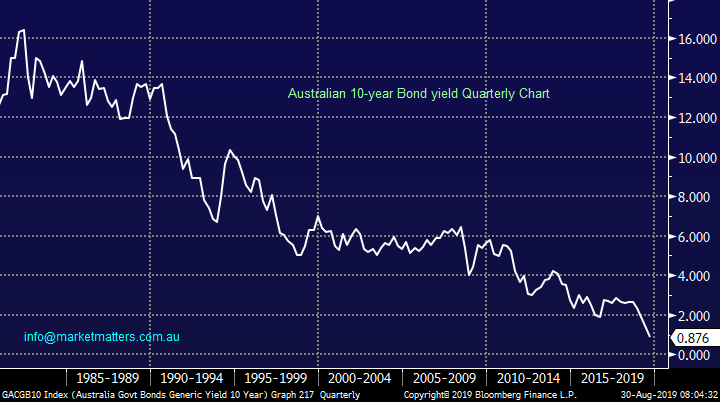
We often remind subscribers to remain openminded e.g. who in the 1980’s would have though Australian 10-year bond yields would tumble from 16% to well under 1% before the year 2020 – if they bounce back towards just say 5% its going to dramatically alter the current investment landscape.
Australian 10-year Bond Yield Chart
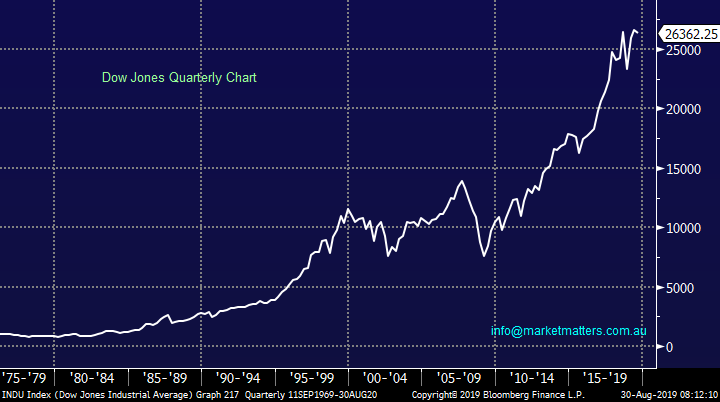
If we simply stand back and look at the US Dow Jones over the last 45-years its enjoyed a phenomenal run but as believers in stocks it comes as no great surprise to MM.
However a pullback to test the lows of Q3 2018 would not even dent the chart but it would have an enormous impact on the short-term performance of most investors’ portfolios – this is our preferred scenario in the months to come.
MM believes the risk / reward for stocks dictates a more conservative approach until further notice.
Dow Jones Chart
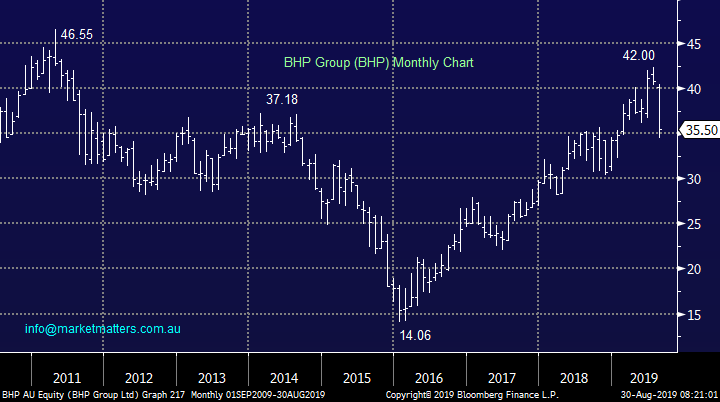
For those that cannot believe that such moves are possible / comprehendible just think of BHP post the GFC:
1 – BHP fell almost 70% in the 5-years after 2011 while the ASX200 rallied strongly, it was a hated stock in 2015/6.
2 – BHP then proceeded to double in the next 3-years becoming almost loved in 2019.
i.e. when cycles change investors should not underestimate how far markets can move.
BHP Group (BHP) Chart
There are 3 investment themes MM is watching carefully moving forward:
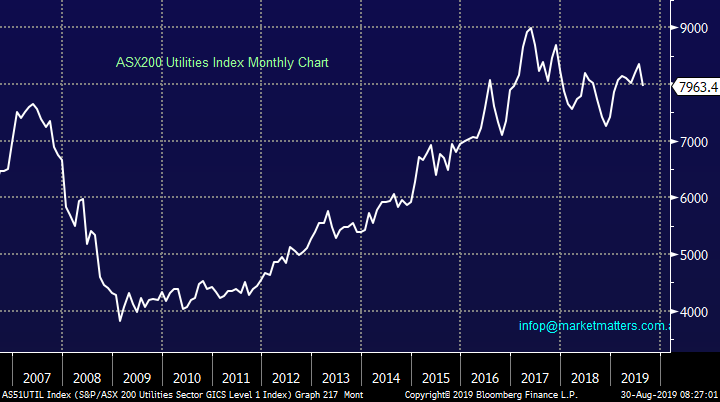
1 The Yield Play
Interestingly the Australian Utilities sector has already come off the boil while bond yields continue to fall – not a good sign. Hence we now have no interest chasing the classic yield play stocks.
While local term deposits sit ~1.5% and the likes of CBA yields over 5.5% fully franked a huge tailwind remains for stocks but we would rather play it via stocks who will benefit when interest rates bottom i.e. the banks.
MM prefers the banks to the traditional “yield play” space.
NB Our Income Portfolio will not change dramatically until we see a clear catalyst that signals interest rates are set to rise but obviously we are watching this carefully.
ASX200 Utilities Index Chart
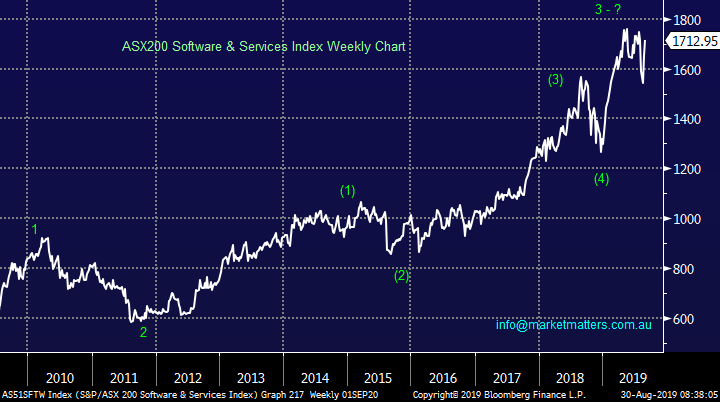
2 Healthcare & Growth
Yesterday we received a warning on high valuation stocks as market favourite Appen (APX) tumbled ~20% from its intra-day high. When the market decides interest rates will rise, or perhaps just not fall any more, these stocks are likely to struggle, just as they did at the end of 2018.
We have no sell signals yet but I could not buy many of them today from a risk / reward perspective.
MM is cautious on high valuation stocks.
ASX200 Software & Services Index Chart
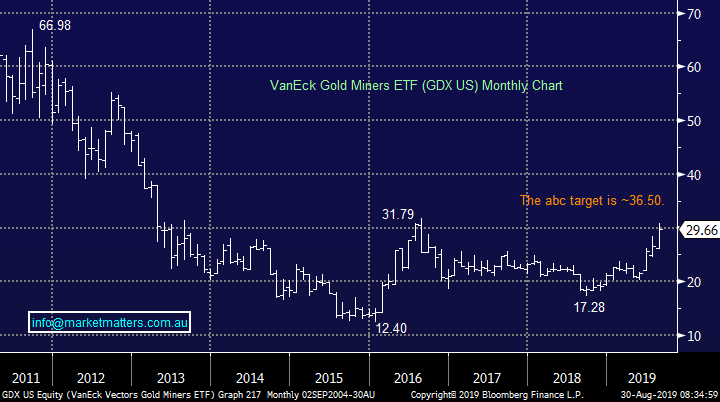
3 Gold sector
No change we are keen to buy the precious metals (gold & silver), historically they perform strongly when inflation raises its head although if / when interest rate rise it’s a headwind.
MM remains bullish gold stocks with an initial target ~20% higher.
VanEck Gold Miners ETF (GDX ETF) Chart
Conclusion (s)
MM likes the banks and golds in the months ahead but not the high growth / valuation stocks.
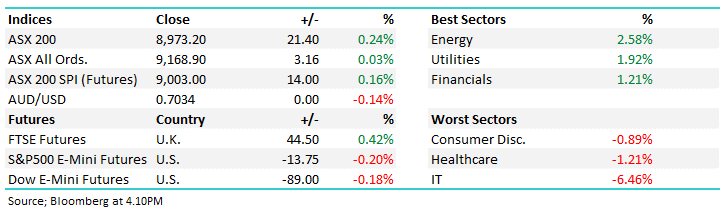
Global Indices
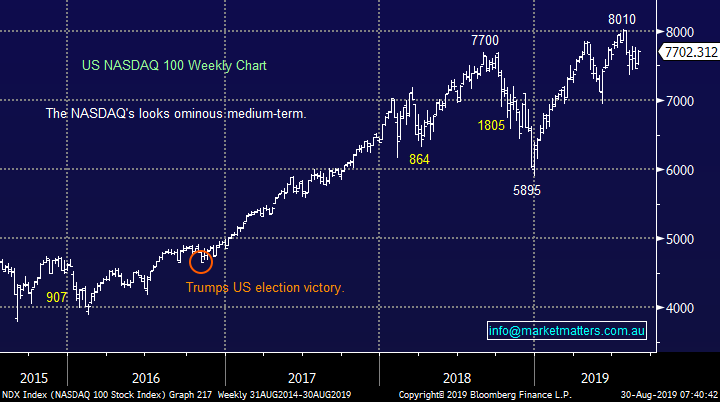
We believe US stocks are now bearish as discussed over recent weeks, the tech based NASDAQ’s short-term resistance comes in around 7800, only 1% higher, while initial support is around 8% lower.
US stocks have generated technical sell signals medium-term.
US NASDAQ Index Chart
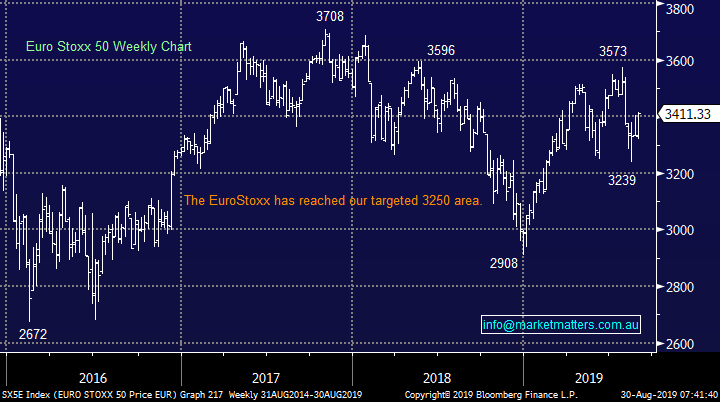
No change again with European indices, while we remain cautious European stocks as their tone has become more bearish over the last few months, however we had been targeting a correction of at least 5% for the broad European indices, this has now been achieved.
The long-term trend is up hence any “short squeezes” might be harder and longer than many anticipate.
Euro Stoxx 50 Chart
Overnight Market Matters Wrap
• US equities rallied yet again overnight on positive hopes around the US-China trade war with Chinese officials mentioning about the possibility of face to face negotiations in September if the US can create the necessary conditions. Beijing said that they won’t retaliate against the latest US tariff increase.
• Meanwhile, it seems the trade war is having an effect on US growth. GDP grew at 2% in the last quarter, way below the 3% pace in the first quarter. Personal consumption rose 4.7%, beating forecasts and the largest gain in 5 years.
• Metals on the LME were broadly higher, with nickel the stand-out. Iron ore was lower along with gold, while crude oil held firm.
• The September SPI Futures is indicating the ASX 200 to open 53 points higher, towards the 6560 level this morning.
Have a great day!
James & the Market Matters Team
Disclosure
Market Matters may hold stocks mentioned in this report. Subscribers can view a full list of holdings on the website by clicking here. Positions are updated each Friday, or after the session when positions are traded.
Disclaimer
All figures contained from sources believed to be accurate. All prices stated are based on the last close price at the time of writing unless otherwise noted. Market Matters does not make any representation of warranty as to the accuracy of the figures or prices and disclaims any liability resulting from any inaccuracy.
Reports and other documents published on this website and email (‘Reports’) are authored by Market Matters and the reports represent the views of Market Matters. The Market Matters Report is based on technical analysis of companies, commodities and the market in general. Technical analysis focuses on interpreting charts and other data to determine what the market sentiment about a particular financial product is, or will be. Unlike fundamental analysis, it does not involve a detailed review of the company’s financial position.
The Reports contain general, as opposed to personal, advice. That means they are prepared for multiple distributions without consideration of your investment objectives, financial situation and needs (‘Personal Circumstances’). Accordingly, any advice given is not a recommendation that a particular course of action is suitable for you and the advice is therefore not to be acted on as investment advice. You must assess whether or not any advice is appropriate for your Personal Circumstances before making any investment decisions. You can either make this assessment yourself, or if you require a personal recommendation, you can seek the assistance of a financial advisor. Market Matters or its author(s) accepts no responsibility for any losses or damages resulting from decisions made from or because of information within this publication. Investing and trading in financial products are always risky, so you should do your own research before buying or selling a financial product.
The Reports are published by Market Matters in good faith based on the facts known to it at the time of their preparation and do not purport to contain all relevant information with respect to the financial products to which they relate. Although the Reports are based on information obtained from sources believed to be reliable, Market Matters does not make any representation or warranty that they are accurate, complete or up to date and Market Matters accepts no obligation to correct or update the information or opinions in the Reports. Market Matters may publish content sourced from external content providers.
If you rely on a Report, you do so at your own risk. Past performance is not an indication of future performance. Any projections are estimates only and may not be realised in the future. Except to the extent that liability under any law cannot be excluded, Market Matters disclaims liability for all loss or damage arising as a result of any opinion, advice, recommendation, representation or information expressly or impliedly published in or in relation to this report notwithstanding any error or omission including negligence.