5 stocks that have shown their hand this week (FMG, MFG, KDR, NHF, A2M)
Local stocks bounced yesterday following 2 days of fairly aggressive selling with the gold sector performing the heavy lifting for a change. If the market dances to the recent tune different sectors will continue to come in / out of favour over the next few days – if we follow the US the financials and energy sectors will be strong today while the real estate and utilities will come under pressure.
When we stand back and look at stocks that have risen / fallen by more than 10% over the last month a number of names are likely to surprise many:
Winners– Monadelphous (MND), Beach Petroleum (BPT), Whitehaven Coal (WHC), Ingham’s (ING), Sigma Healthcare (SIG), Ausdrill Ltd (ASL), Independence Group (IGO), Mineral Resources (MIN), Western Areas (WSA), RIO Tinto (RIO), South32 (S32), Orocobre (ORE), Mayne Pharma (MYX) and Vocus (VOC) – 14 companies.
Losers – Seek (SEK), Aristocrat (ALL), Flight Centre (FLT), Treasury Wine (TWE), Bega Cheese (BGA), A2 Milk (A2M), Estia Health (EHE), Blackmores (BKL), NIB Holdings (NHF), St Barbara (SBM), CSR Ltd (CSR), Lynas (LYC), Nufarm (NUF), Iluka (ILU), CSL Ltd (CSL), Aveo Group (AOG), Webjet (WEB), Speedcast (SDA) and QANTAS (QAN) – 19 companies.
We have a couple of interesting observations from the above 2 groups:
- Volatility “under the hood” is increasing in a concerning way - within the ASX200 over 16% of the stocks have moved by over 10% in a month when the index itself is down just -2.6%.
- Resources stocks bounced well after being sold off hard since May / June i.e. the markets a buyer of weakness in that sector.
- The high value / growth stocks have fallen out of favour as we expected and although they are probably close to a good bounce, like the resources have, we are not a buyer of the group in general into 2019.
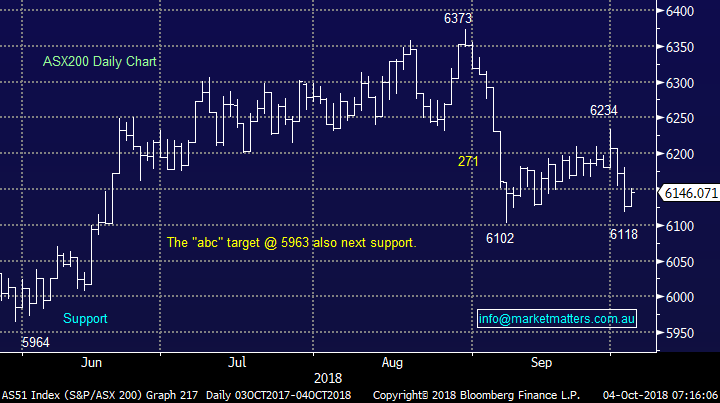
The ASX200 has now traded in the tight range of 6102 – 6230 for 20-trading days, even within this relatively small 128-point range the trend remains the same – the markets a buyer of weakness and seller of strength with very few people apparently believing a meaningful breakout is likely.
· MM remains mildly negative the ASX200 short-term with an initial target ~5965, around -3% lower.
NB MM will now lose this bearish technical bias if the index can close above 6240 i.e. breakout of trading range which has constrained the market since the 6th of September.
Overnight stocks were strong for most of the day until US bond yields surged higher with the 2-years hitting a new decade high following strong US economic data – interest rate sensitive stocks like real estate felt the brunt of the selling. With US 10-year bond yields roaring through 3.18% the $US not surprisingly came along for the ride sending the $A lower.
The ASX200 looks set to open mildly higher this morning in a day that is likely to have some very differing performances across the various sectors.
In today’s report we are going to look at 5 stocks who MM thinks have “shown their hand” this week, both buys and sells.
ASX200 Chart
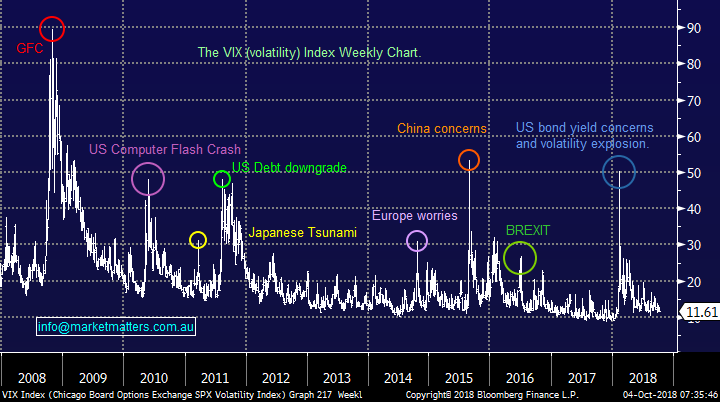
The VIX which measures fear in the market is basically at decade lows reiterating our earlier observation that the market doesn’t believe a decent market move is close to hand i.e. people are not buying protection via calls or puts.
· We believe the VIX is dangerously low but it can stay at these levels for years like between 2012 and 2015.
The VIX Volatility Index / Fear Gauge Chart
US 10-year bond yields surged higher overnight closing at levels not seen since 2011 while as we said earlier the 2-years reached levels not seen in a decade.
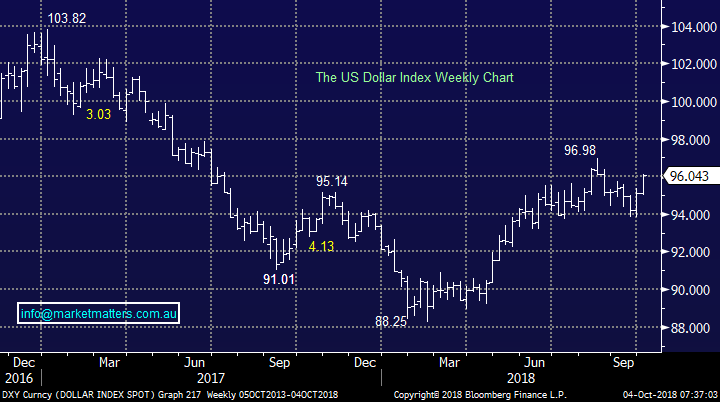
The strong increase in US rates lifted the $US to fresh 6-week highs with its 2018 high now less than 1% away.
· As discussed in yesterday’s morning report if we see ongoing strength in the $US Index towards the 98 area we will look to take profit in our $US BetaShares ETF position.
NB We will be looking for a ~5% correction before reinitiating the position.
US 2-year bond yield Chart

$US Index Chart
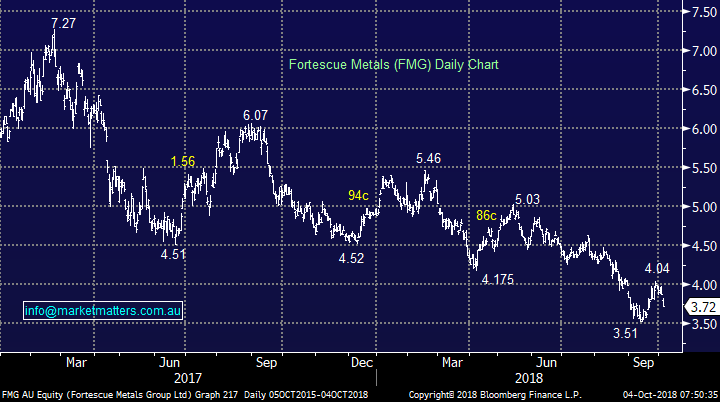
1 Fortescue Metals (FMG) $3.72
We discussed FMG in yesterday’s afternoon report without revealing how we intended to play the iron ore miner.
The stock came under pressure following a sell recommendation from Morgan Stanley – although the stock is already down almost 50% since February 2017 while over the same period RIO has rallied almost 15%.
Undoubtedly FMG’s lower grade iron ore is a negative but is this another elastic band becoming too stretched – FMG is now trading on an Est P/E for 2019 of 9.35x while yielding 6.18% fully franked, in comparison RIO is trading on an Est P/E for 2018 of 11.7x and yielding 5% fully franked. In our opinion RIO should be trading at a premium but the simple question is how much of one?
FMG is undoubtedly very unpopular at present but we believe value is relatively close at hand - we do intend to be careful catching this falling knife.
· MM is a buyer of FMG around $3.25, still over 10% lower.
Fortescue Metals (FMG) Chart
2 Magellan Financial (MFG) $26.99
We’ve touched on Magellan (MFG) a few times this year and while it remains strong the risk / reward opportunities have been thin on the ground.
The company shot the lights out with its results a few months ago while revealing a larger than expected dividend and plans to retain a higher payout ratio in the future. This is a business well and truly in the groove although we are aware that many competitors who have struggled over the last few years are likely to regain some strength in the not too distant future.
The ability of the stock to remain firm over the last few weeks while both the market and financial sector have struggled adds weight to our opinion that MFG will eventually test $30.
· We like MFG ~$26.60 targeting $30 with stops under $25 – solid 2:1 risk / reward while investing with the trend.
Magellan Financial (MFG) Chart

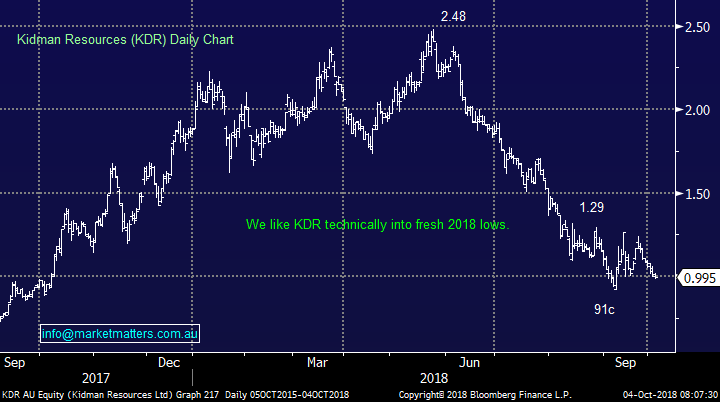
3 Kidman Resources (KDR) 99.5c
KDR has been our “Trade of the Week” in the Weekend Report for the last 2 weeks and nothing has changed with our opinion at this point in time.
Many lithium names like Orocobre (ORE) and Mineral Resources (MIN) have enjoyed strong bounces over the last month i.e. ORE +10.3% and MIN +9.6%.
However KDR has struggled to trade back above $1 after falling over 60% since June. The failure of KDR to rally with its peers gives us confidence that the stock will test below 90c in the coming weeks.
The miners main problem is the WA government specifically around its Mt Holland Project and as we all know uncertainty is a markets worst enemy. Another example of stocks on the ASX struggling with regulations, very different to Trumps America.
· MM likes KDR as a speculative buy below 90c.
Kidman Resources (KDR) Chart
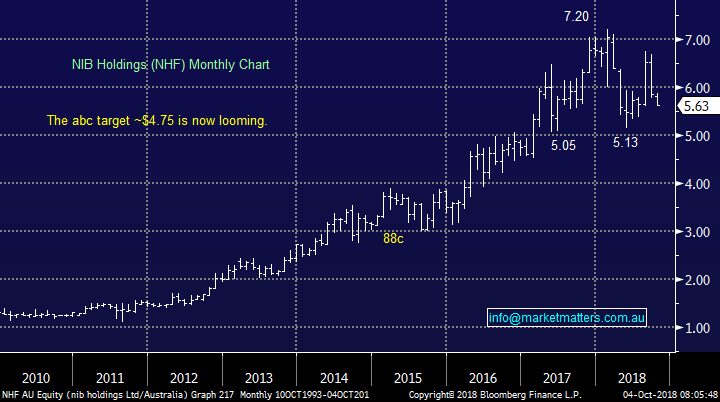
4 NIB Holdings (NHF) $5.63
NHF shares rallied strongly after the company released their annual results in August but the gains have since totally gone.
The APRA review of the sector is extremely unlikely to be good news as we saw with the banks, insurers and asset managers. Although new regulations are likely not to require implementation for a few years they are likely to be onerous – more regulatory influences on the ASX, a reoccurring theme of 2018/9 I believe.
Again uncertainty is a bad thing for stocks and in this case especially when the question being asked is “how bad will things be?”.
· We are short-term bearish NHF looking for ~15% downside.
NIB Holdings (NHF) Chart
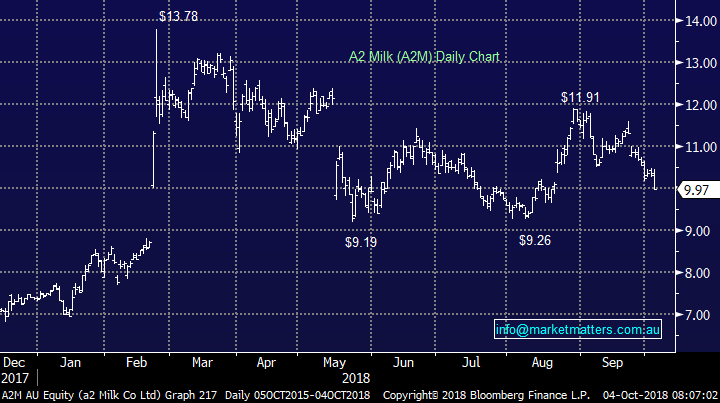
5 A2 Milk (A2M) $9.97
As we mentioned in yesterday’s afternoon A2 Milk (A2M) is suffering at the hands of further Director selling – this time it was Independent Non-Exec Director Peter Hinton who offloaded NZ$300k worth of stock.
Sometimes a stock just doesn’t feel right and at the moment, A2M certainly fits that bill plus the technical picture is now looking very average initially targeting a test of the $9 area.
Additionally as subscribers know we are not fans of the high growth / valuation stocks at this stage of the economic / stock market cycle.
· MM is bearish A2M and are very wary of this growth stock moving forward following the large director selling.
A2 Milk (A2M) Chart
Conclusion
We can split todays 5 stocks into to 2 simple groups:
Stocks we may buy – FMG, MGR and KDR.
Stocks we have no interest in – NHF and A2M.
Overseas Indices
No change with US stocks, they look wobbly but most definitely no sell signals at this stage.
US S&P500 Chart

European indices like the US continue to track sideways, our preference is a touch lower from here but no signals yet.
German DAX Chart

Overnight Market Matters Wrap
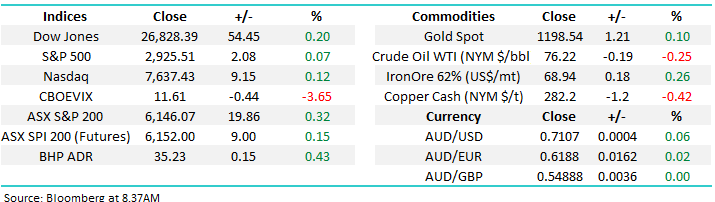
· The overseas major markets closed higher overnight, with the Dow edging 0.2% higher to a new record, while the broader S&P 500 was just 0.07% higher.
· US non-manufacturing activity rose 3 points to 61.6 in September, the highest reading in 21 years. Non-farm payrolls are due on Friday and could be stronger than analyst’s expectations.
· The Italian budget drama seems to have settled down and with the strong economic data out of the US, confidence in growth and therefore inflation and a steady rise in rates is increasing. Consequently, the yield on US 10-year bonds jumped to 3.18%.
· Copper lost ground a touch, while nickel rose ~2%. Aluminium was the big story, rising over 4% after a major alumina plant said it would stop production at one of its refineries.
· The December SPI Futures is indicating the ASX 200 to open 18 points higher, testing the 6165 level this morning.
Have a great day!
James & the Market Matters Team
Disclosure
Market Matters may hold stocks mentioned in this report. Subscribers can view a full list of holdings on the website by clicking here. Positions are updated each Friday, or after the session when positions are traded.
Disclaimer
All figures contained from sources believed to be accurate. Market Matters does not make any representation of warranty as to the accuracy of the figures and disclaims any liability resulting from any inaccuracy. Prices as at 04/10/2018
Reports and other documents published on this website and email (‘Reports’) are authored by Market Matters and the reports represent the views of Market Matters. The MarketMatters Report is based on technical analysis of companies, commodities and the market in general. Technical analysis focuses on interpreting charts and other data to determine what the market sentiment about a particular financial product is, or will be. Unlike fundamental analysis, it does not involve a detailed review of the company’s financial position.
The Reports contain general, as opposed to personal, advice. That means they are prepared for multiple distributions without consideration of your investment objectives, financial situation and needs (‘Personal Circumstances’). Accordingly, any advice given is not a recommendation that a particular course of action is suitable for you and the advice is therefore not to be acted on as investment advice. You must assess whether or not any advice is appropriate for your Personal Circumstances before making any investment decisions. You can either make this assessment yourself, or if you require a personal recommendation, you can seek the assistance of a financial advisor. Market Matters or its author(s) accepts no responsibility for any losses or damages resulting from decisions made from or because of information within this publication. Investing and trading in financial products are always risky, so you should do your own research before buying or selling a financial product.
The Reports are published by Market Matters in good faith based on the facts known to it at the time of their preparation and do not purport to contain all relevant information with respect to the financial products to which they relate. Although the Reports are based on information obtained from sources believed to be reliable, Market Matters does not make any representation or warranty that they are accurate, complete or up to date and Market Matters accepts no obligation to correct or update the information or opinions in the Reports. Market Matters may publish content sourced from external content providers.
If you rely on a Report, you do so at your own risk. Past performance is not an indication of future performance. Any projections are estimates only and may not be realised in the future. Except to the extent that liability under any law cannot be excluded, Market Matters disclaims liability for all loss or damage arising as a result of any opinion, advice, recommendation, representation or information expressly or impliedly published in or in relation to this report notwithstanding any error or omission including negligence.


