5 stocks catching my eye as we search for upside (CBA, APX, BGA, IVC, IPH, MIN)
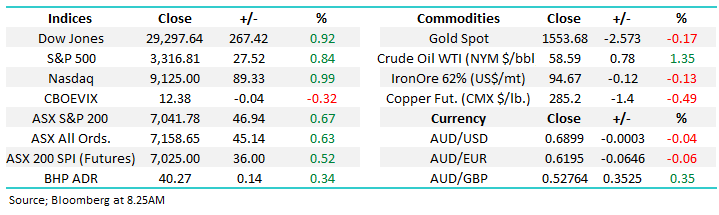
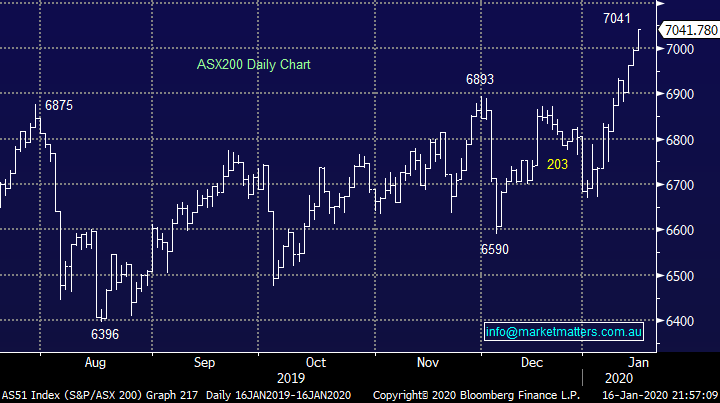
The ASX200 soared through the psychological 7000 area yesterday like a hot knife through butter, its only mid-January and the markets already up 357-points/ 5.3% for 2020, from a technical perspective MM must remain bullish while the index holds above 6930. Investors should not forget this is a liquidity led rally, not the more traditional valuation kind, hence don’t underestimate its potential. I’m a voracious reader and I haven’t come across one article calling equities to outperform 2019 this year, instead I’m seeing numerous articles calling imminent tops and excessive valuations – this reminds me of one of MM’s favourite mantras “remain open-minded”, why couldn’t we hit 8000 before 6500?
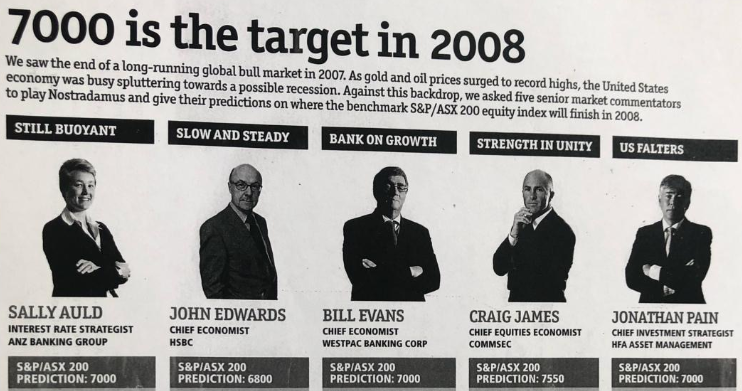
In the spirit of ‘open mindedness’ one snippet caught my eye this morning from Daniel Molseworth from Iplan Financial Planning who rehashed the experts view at the start of 2008, the last time 7000 was attracting the media headlines. The end of 2007 saw the ASX 200 close at 6339 but by the end of 2008 the market was plumbing lows of 3722, a ~40% decline on the year. A really strong example of the fluidity of markets and why keeping a finger on the pulse is very important!
Experts Predictions for 7000 in 2008
A few days ago, we quoted legendary fund manager John Templeton, I feel like were slowly transitioning through optimism but with the exception of the tech space euphoria is still hard to find. We believe fund manages / investors are finally being forced to buy equities as “Fear of Missing Out” (FOMO) raises its head throughout the investment community but this dangerous phenomenon still feels in its infancy.
“Bull markets are born on pessimism, grown on scepticism, mature on optimism, and die on euphoria,” – John Templeton.
Reporting season is slowly looming in February, we feel the current upside momentum will probably run out of steam in the next week or two as investors brace for potential disappointments. With the market trading on some of the highest valuations on traditional metrics since WW2 we anticipate some significant volatility under the hood next month as stocks are likely to be dealt savagely with if they fail to deliver, but the buying will probably return once the dust settles.
MM is bullish the ASX200 while it holds above 6930.
Overnight US stocks rallied strongly led by the tech-based NASDAQ which advanced yet another 1%, the SPI futures are calling the ASX200 to open up close to 40-points this morning, we’ll be knocking on the 7100 door before we know it!
Today we’ve looked at 5 stocks that have caught our attention as we look for opportunities early in 2020 – please excuse the cliché style report!
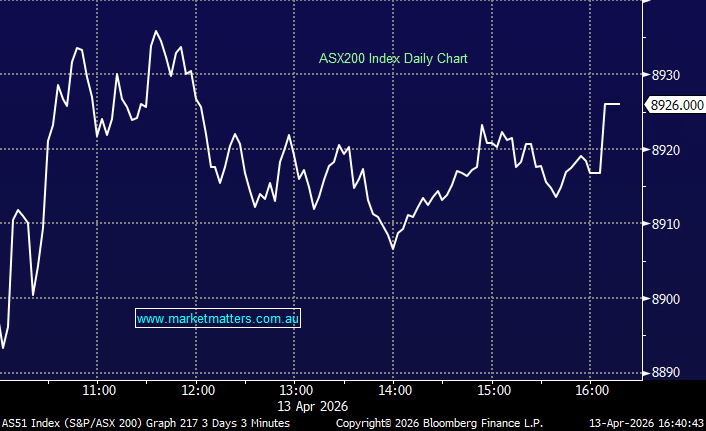
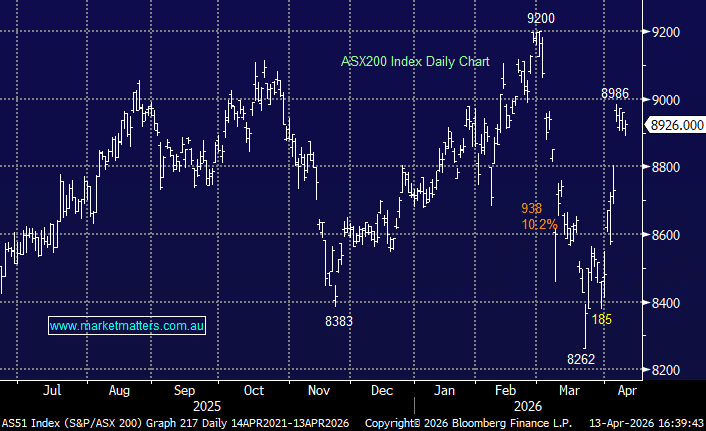
ASX200 Chart
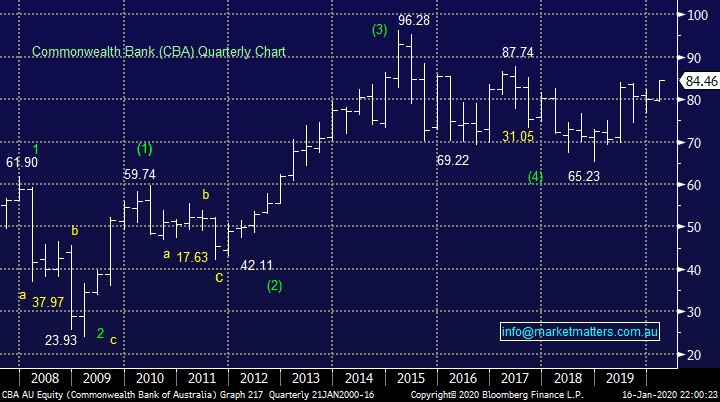
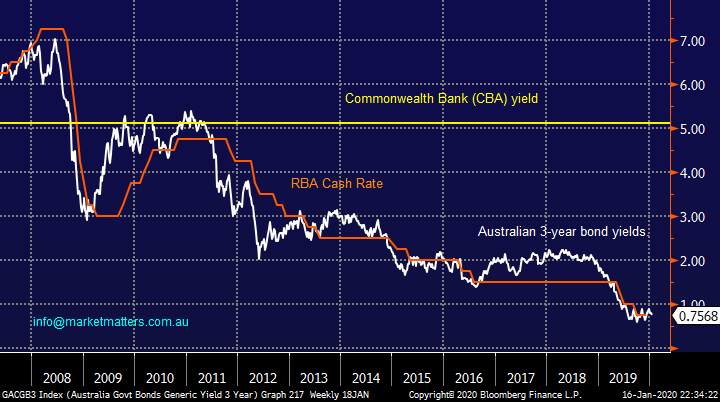
Commonwealth Bank (CBA), Australia’s largest stock, made fresh 2 ½ year highs yesterday and as we often say at MM the local market doesn’t go down without the banks. With CBA still yielding over 5% fully franked, while its hard work finding a term deposit paying much above 1.5%, its fairly easy to imagine our banking sector emulating their US peers and making fresh all-time highs. *note, buying CBA is a lot riskier than a TD, however we’re using the spread as a simple example of why equities are hot. The acronym TINA, ‘There is No Alternative’ was brought up on our morning meeting today, perhaps some Euphoria is starting bubble away…
MM remains bullish CBA.
Commonwealth Bank (CBA) Chart
Major Australian Interest Rates / Bond Yields Chart
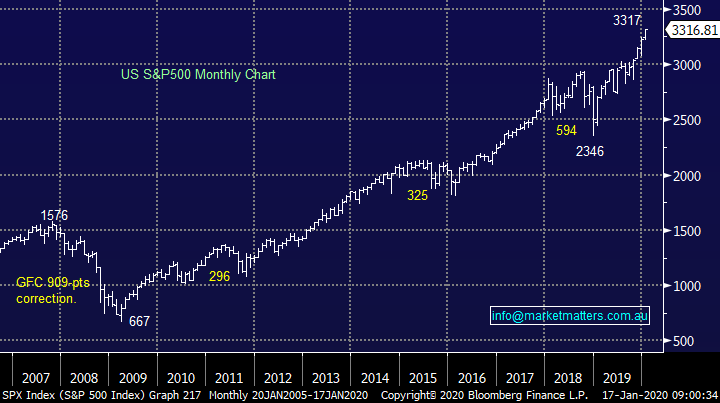
US stocks continue to surge to fresh all-time highs with arguably to strongest momentum since the post GFC bull market commenced in 2009, if we stand back and look at the US market over the last decade a couple of things catch our eye:
1 – As touched on above stocks are accelerating higher with the most gusto in over a decade but as we can see below “tops” in equities are commonly formed when the index losses momentum and rolls over i.e. 2007, 2011 and 2015, not so much in 2018.
2 – The previous 3 legs higher by US stocks lasted ~2 .5-years, 4-years and 3-years but the current breakout is only 1-year old implying it could relatively be in its infancy.
MM remains bullish US stocks with an initial target 6-8% higher.
US S&P500 Index Chart
The 5 stocks we’ve looked at today have all experienced pullbacks in recent times making them somewhat more attractive, the hot money has probably left.
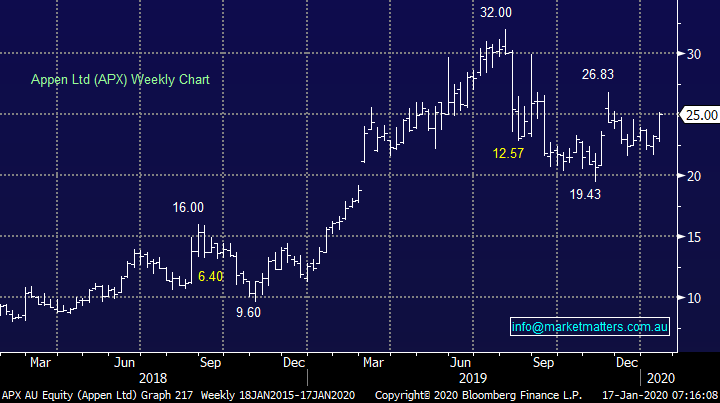
1 Appen Ltd (APX) $25.00
APX is an international leader in human automated data for machine learning and Artificial Intelligence (AI), the chart below shows the aggressive rotation between excessive optimism and pessimism the stocks experienced over the last 6-months. The business has been going from strength to strength leading to an upgrade to its FY 2019 guidance for EBITDA of just under $100m implying impressive annual growth of ~35%.
The stocks clearly in a hot space but the almost 40% correction illustrates both volatility and of course potential opportunity. The major risk is the market is almost expecting regular upgrades from this $3bn business however in the tech sector, this is actually a business that is looking reasonable value on an Est P/E of 47.8x for a company growing earnings at ~35% in FY20.
Sales momentum is also strong here as continued investment in AI algorithms recently led to a 60% jump in H1 revenue and a 33% increase in NPAT to $18.6m, more solid numbers – this business is no pipe dream, it’s more a case of what price to pay.
We can see ongoing strong performance from the company and technically the stock looks good with stops below $23.30, good risk / reward for this exciting stock.
MM likes APX with stops below $23.30.
Appen Ltd (APX) Chart
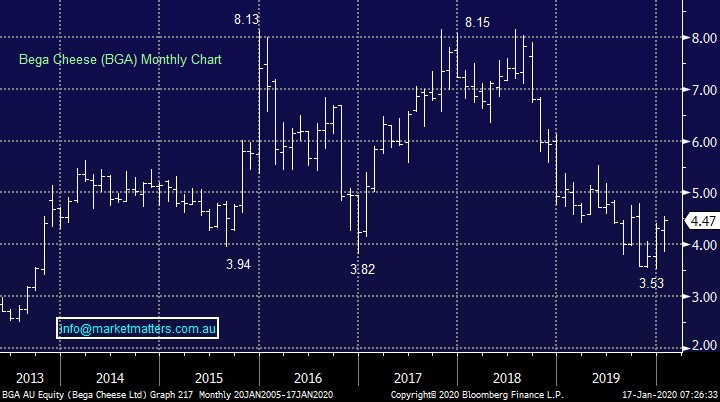
2 Bega Cheese (BGA) $4.47
BGA endured a tough few years but below $5 we see solid value returning to the dairy food business. Earnings will be weaker in FY20 due to a squeeze in margins while they are also accelerating a planned restructure of manufacturing operations and that (all things going to plan) should improve earnings from FY21 onwards. The markets expectation for earnings decline of ~25% into FY20 is overcome in FY21 with growth of 50%. Tacking some liberty and looking at it on a 3-year basis, net profit of $38m in FY19 will jump to $55m by FY22.
Interestingly, shares have held firm this year as the bushfires ravaged our country implying fund managers had drawn a line in the sand where they would start accumulating the stock.
The company has been fortunate to avoid any major impact from the devastating fires with amazingly no diary sheds lost.
An Est P/E 48x for FY20 is a result of the expected week earnings while it is still expected to yield 2.46% fully franked
MM likes BGA with stops below $4.
Bega Cheese (BGA) Chart
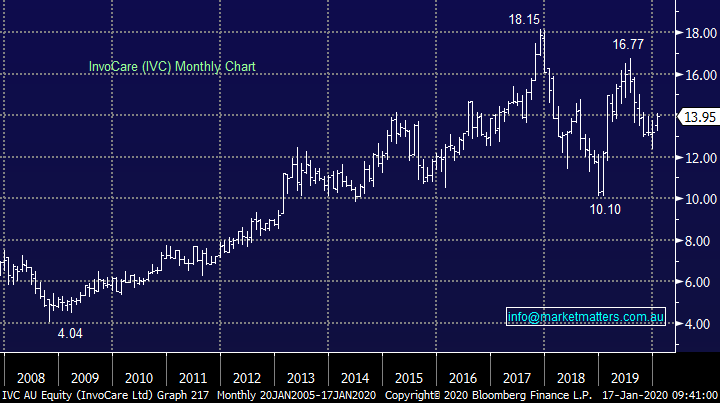
3 InvoCare Ltd (IVC) $13.95
Australia’s largest funeral operator IVC had a tough few years as increased competition reduced margins but as the company renovates many of its parlours it feels like the worst might be well behind this business. Unfortunately, death volumes are forecast to grow by almost 1.5% pa up until 2025 providing a solid tailwind for the business.
The stock, like much of the market is not overly cheap trading on an Est P/E for 2020 of 28.4x but a sustainable dividend of 2.65% fully franked is not to be sneezed at in today’s ultra-low interest rate environment. Earnings consistency / predictability is also high in this business and it typically trades around 26x making it only marginally expensive. As investors appear prepared to push stocks up the value curve relatively low risk businesses like IVC are likely to garner more attention.
Technically MM likes IVC with stops below $13.20, a 5.5% risk feels relatively palatable in the current market.
MM likes IVC with stops below $13.20.
InvoCare Ltd (IVC) Chart
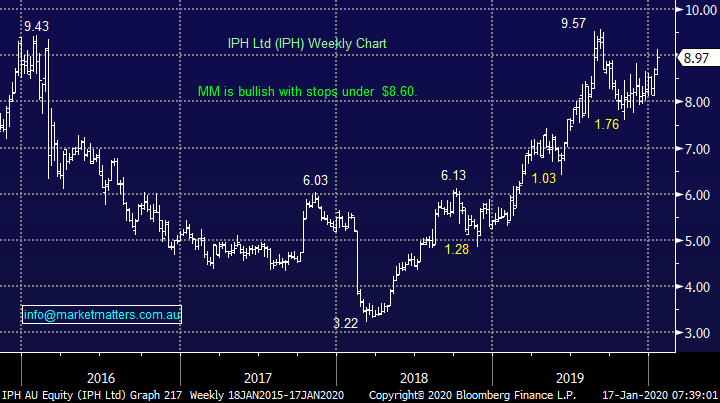
4 IPH Ltd (IPH) $8.97
Intellectual property (IP) services firm IPH was on our radar a few times in 2019 although we’ve not pressed the buy button to-date. We like the resolution on US-China trade as it appears global IP will be given far more respect from China, potential solid upside here for IPH. The stocks reasonably priced in today’s market trading on an Est P/E for 2020 of 24x while it yields 2.8% part franked.
Technically MM likes IPH with stops below $8.60, around 5% risk at current prices while our target is fresh highs up towards $10 not great risk / reward, but we are confident with our upside target.
MM is bullish IPH with stops below $8.60.
IPH Ltd (IPH) Chart
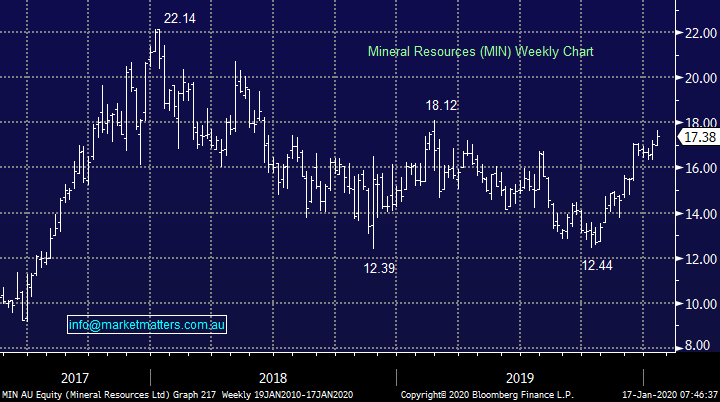
5. Mineral Resources (MIN) $17.38
A struggling lithium price may have pressured the MIN share price, but we believe this is overshadowing the valuation of its mining services division creating opportunity in the stock. The shares are trading on an Est P/E for 2020 of sub 8x while the stock yields 2.5% fully franked, not scary to us.
Technically investors should be open to a pullback towards $16.50 hence we would be leaving some $$ to average if such a move unfolded. I enjoyed the presentation from Emma Fisher of Airlie Funds at Sohn Hearts & Minds recently – click here to view
MM likes MIN here and would average ~$16.50.
Mineral Resources (MIN) Chart
Conclusion
MM likes the 5 stock covered today with our order of preference if forced at today’s prices : APX, IVC, BGA, MIN and IPH.
Overnight Market Matters Wrap
- The US equity markets continues its all-time record high momentum with Morgan Stanley driving the financial sector after smashing expectations, pushing the stock up 6.61%.
· Promising economic data overnight also cheered investors, with the latest set of jobless claims lower than expected, falling 10,000 to 204,000, while retail sales rose 0.3%, in line with expectations. Investors appear unfazed and rightly so by the threat of impeachment of President Trump. The Republican Party have the numbers to vote against Trump being impeached.
- On the commodities front, crude oil broke its 2-week slide and gained 1.35% higher at US$58.59/bbl. while gold lost some of its lustre.
- The March SPI Futures is indicating the ASX 200 to open 50 points higher the end the week at record highs testing the 7100 level this morning.
Have a great day!
James & the Market Matters Team
Disclosure
Market Matters may hold stocks mentioned in this report. Subscribers can view a full list of holdings on the website by clicking here. Positions are updated each Friday, or after the session when positions are traded.
Disclaimer
All figures contained from sources believed to be accurate. All prices stated are based on the last close price at the time of writing unless otherwise noted. Market Matters does not make any representation of warranty as to the accuracy of the figures or prices and disclaims any liability resulting from any inaccuracy.
Reports and other documents published on this website and email (‘Reports’) are authored by Market Matters and the reports represent the views of Market Matters. The Market Matters Report is based on technical analysis of companies, commodities and the market in general. Technical analysis focuses on interpreting charts and other data to determine what the market sentiment about a particular financial product is or will be. Unlike fundamental analysis, it does not involve a detailed review of the company’s financial position.
The Reports contain general, as opposed to personal, advice. That means they are prepared for multiple distributions without consideration of your investment objectives, financial situation and needs (‘Personal Circumstances’). Accordingly, any advice given is not a recommendation that a particular course of action is suitable for you and the advice is therefore not to be acted on as investment advice. You must assess whether or not any advice is appropriate for your Personal Circumstances before making any investment decisions. You can either make this assessment yourself, or if you require a personal recommendation, you can seek the assistance of a financial advisor. Market Matters or its author(s) accepts no responsibility for any losses or damages resulting from decisions made from or because of information within this publication. Investing and trading in financial products are always risky, so you should do your own research before buying or selling a financial product.
The Reports are published by Market Matters in good faith based on the facts known to it at the time of their preparation and do not purport to contain all relevant information with respect to the financial products to which they relate. Although the Reports are based on information obtained from sources believed to be reliable, Market Matters does not make any representation or warranty that they are accurate, complete or up to date and Market Matters accepts no obligation to correct or update the information or opinions in the Reports. Market Matters may publish content sourced from external content providers.
If you rely on a Report, you do so at your own risk. Past performance is not an indication of future performance. Any projections are estimates only and may not be realised in the future. Except to the extent that liability under any law cannot be excluded, Market Matters disclaims liability for all loss or damage arising as a result of any opinion, advice, recommendation, representation or information expressly or impliedly published in or in relation to this report notwithstanding any error or omission including negligence.