5 MM Holdings Moving Into the Sell Cross Hairs (WEB, IGO, SUN, CYB, IFL)
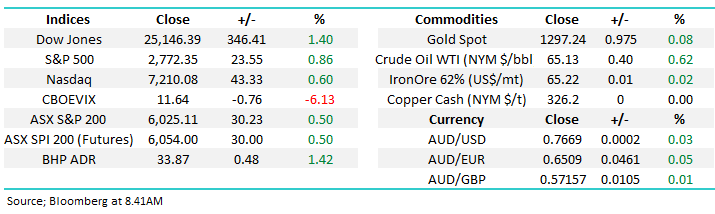
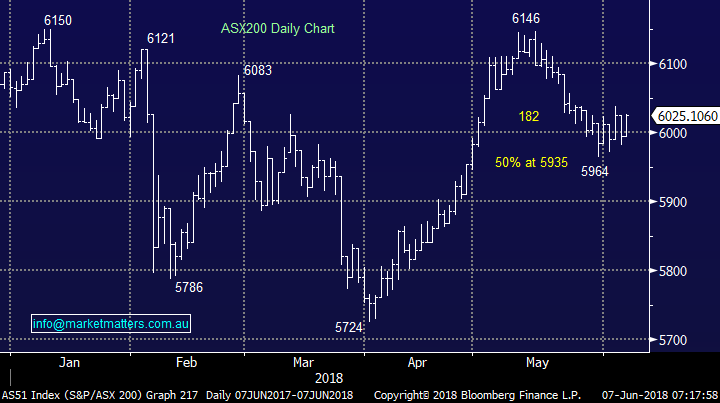
The ASX200 put in a solid performance yesterday closing up +0.5%, on the highs of the day – the more time the market can rotate between 6000 and 6100 the greater our confidence becomes that we can see a final push to fresh decade highs. What our market is currently lacking is coordinated strength, as opposed to different sectors taking it in turns to drag the market kicking and screaming higher e.g. yesterday the resources were strong but the banks fell -0.8% stifling any chance of an explosive advance.
Overnight stocks soared in the States led by the Dow which rallied 346-points. With the financials leading in the S&P500, up +1.8%, and resources looking poised for gains with BHP closing up over +1.4% in the US perhaps today we can muster a strong assault back towards the 6100 area. So far June has been in a very tight range between 5972 and 6038, perhaps todays open at fresh highs for June will cause some fund managers to consider that this May-June is going to be different and press “the buy button” before prices get away from them – remember the latest Bank of American fund manager survey showed their allocations to stocks was at an 18-month low, not ideal for performance when stocks are rallying.
- Medium term MM remains mildly bullish targeting 6250 but the risk / reward is no longer compelling for the buyers. – we remain in “sell mode”.
Today’s report is going to focus on 5 MM holdings which are moving into our sell cross hairs, especially as the EOFY is looming fast, unfortunately they are not all winners but that’s reality as opposed to theoretical investing. At MM we like to ensure our subscribers have prior insight to our potential buys / sells whenever possible so they can decide to follow suit (or not) with a high degree of understanding around our views.
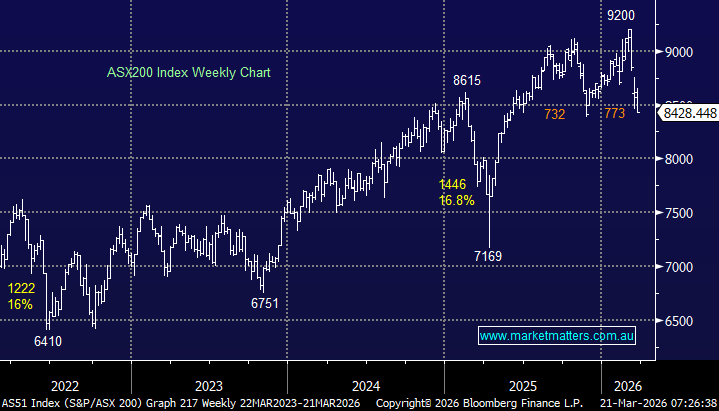
ASX200 Chart
At a glance yesterday’s Australia’s GDP figures looked solid coming in slightly above expectations but the average Australian is not enjoying the warm feeling. The issue was the growth in household spending over the quarter was basically on essential items but worryingly at the same time, households' savings rate fell to 2.1 per cent, its lowest since late 2007. So rather than saving less in order to spoil ourselves it appears Aussies are being forced to do it in order to buy essentials – a clearly concerning trend that feels destined to remain in play into 2019.
The high level of domestic household debt is starting to bite, clearly bad news for the likes of Harvey Norman (HVN).
- This is a great example of a potentially positive chart pattern not coinciding with our macro view hence the decision is easy, do nothing – we will not be buying HVN although it looks tempting technically.
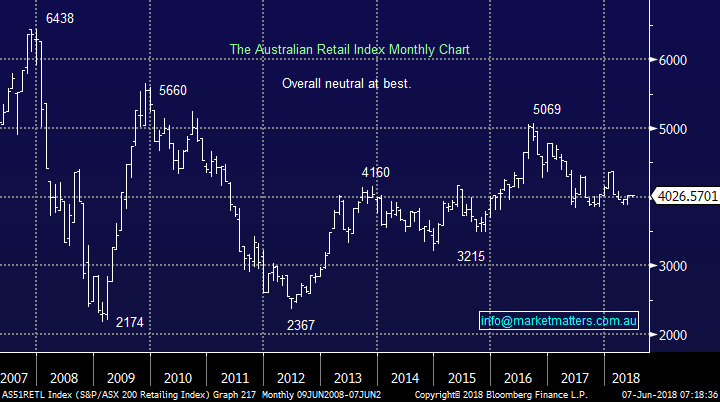
However, the overall local retailing index is actually neutral / bearish another reason to avoid the trading opportunity in HVN.
Australian Retailing Chart
Now let’s move onto 5 stocks who are looking the most likely to be in our sell sights into EOFY as we look to increase our cash levels.
1 Webjet (WEB) $12.76
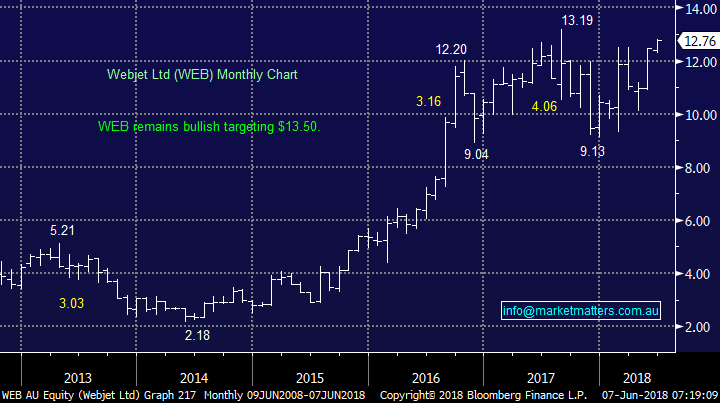
Webjet (WEB) has rallied over 30% since we went long in November as it enjoys more Australians traveling overseas plus the trend away from traditional bricks and mortar travel agents. These tailwinds and Webjet’s successful overall business implementation led to its latest 45% increase in half-year net profit after tax. The market clearly is confident this growth will continue into 2019 with the stock up +22% this calendar year as it trades on a forward PE of 30.7x while yielding 1.4% fully franked, we believe another 5% higher and the risk / reward will warrant a move to cash especially as Aussies are currently feeling the pinch in their pockets.
- At MM we continue to target ~$13.50 to take profit in Webjet (WEB).
Webjet (WEB) Chart
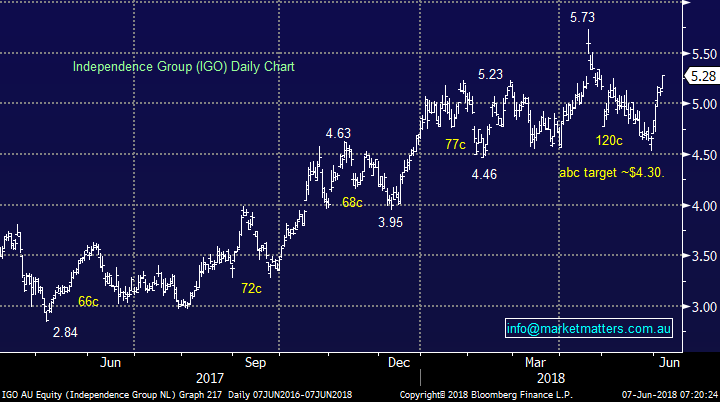
2 Independence Group (IGO) $5.28
IGO has surged +16.6% in the last 6-trading days as the nickel price continues to rally back towards its panic April high, caused at the time by concerns of potential sanctions between the US and Russia. Nickel is used in steelmaking and batteries hence a nice tailwind from the perceived boom in electric cars. The x-factor in this position is the 10.67% short position which cannot be enjoying the recent strength, especially with EOFY looming, any covering could propel the stock towards $6 in the blink of an eye.
- At this stage our target for IGO remains above $5.80, around 10% higher, but in this volatile stock we should be prepared.
Independence Group (IGO) Chart
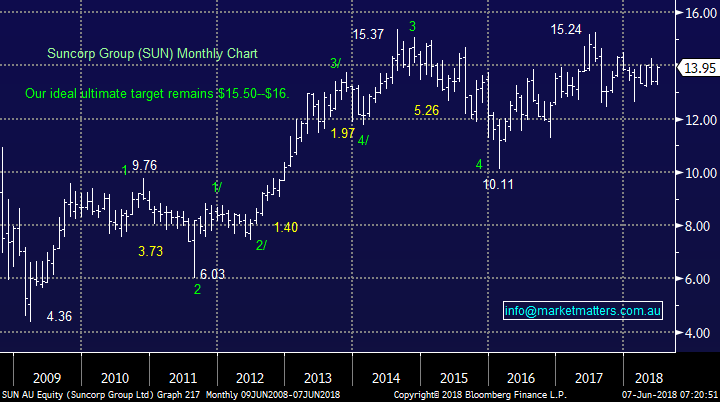
3 Suncorp (SUN) $13.95
Suncorp (SUN) has caught our eye over the last 5-days rallying +3.5% while the sector struggled to gain 1%. Insurers are another sector which will notice any significant cut back to discretionary spending as it’s nice to have but not regarded as a necessity by many. Just to throw uncertainty into the mix we had proposed changes to life insurance rules in the latest federal budget, historically industry rarely enjoys too much government intervention.
- While MM has a $15.50 target for SUN we will likely trim the weighting back on a move towards $15
Suncorp (SUN) Chart
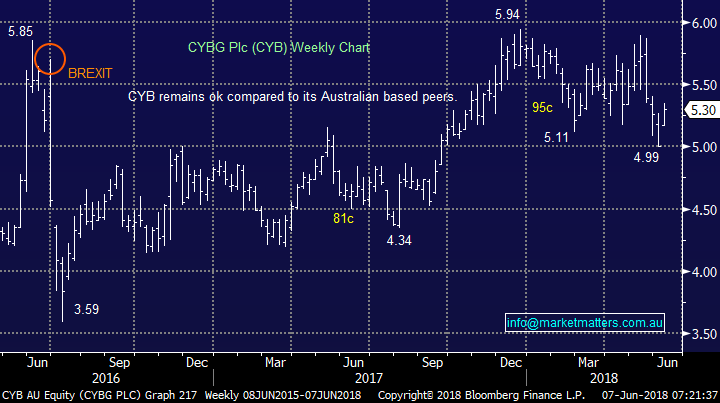
4 CYBG Plc (CYB) $5.30
CYB had an average performance since announcing its intention to buy Virgin Money last month leading to a painful 15% drop in the stock – our paper profits vanished and we are now down 2%. However CYB has bounced 7% over the last 4-days, catching our eye as you would expect. We actually believe the deal makes sense as both financial institutions are challenging the more established UK banks and together they are stronger. The combined entity would become the 6th largest UK bank.
Any continued strength above $5.60 and we will be tempted to let this volatile position go.
- We still have a target for CYB around $6 but due to our intention to increase cash levels +$5.60 may be considered at the time.
CYBG Plc (CYB) Chart
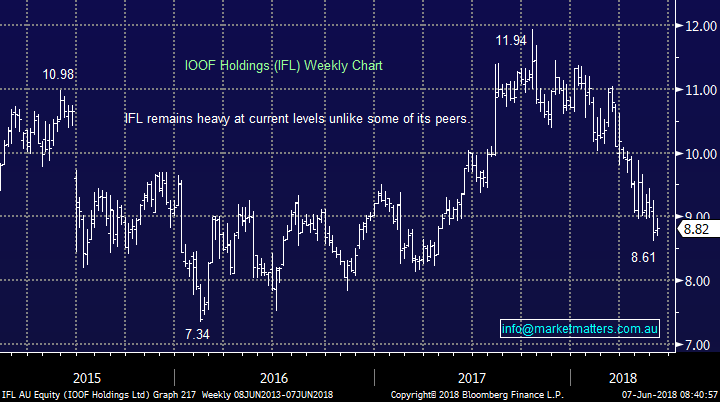
5 IOOF Holdings (IFL) $8.82
IOOF (IFL) has had an awful 2018 suffering at the hand of the Hayne royal commission with only AMP and Magellan having a tougher time in the sector. On top of this there are rumours IFL may be the focus of a class action involving an incident back in 2015. We are pleased that we didn’t average IFL even while it continues to look cheap but it’s obviously starting to hurt us on paper. We are looking to cut the loss into a bounce, from its $11.94 top its bounced $1 three times and another bounce feels a distinct possibility.
We prefer Janus (JHG) in the sector due to its overseas exposure and product mix, but if it bounces significantly harder than IFL it will also become a sell candidate as we look to reduce our sector exposure into any short term strength.
- IFL is clearly struggling, MM is looking for a ~$1 bounce to cut / reduce our position.
IFL Holdings (IFL) Chart
Conclusion
At MM we are looking to increase our cash positions moving forward and the above 5 examples are very much in our sights as areas to satisfy this goal.
Overseas Indices
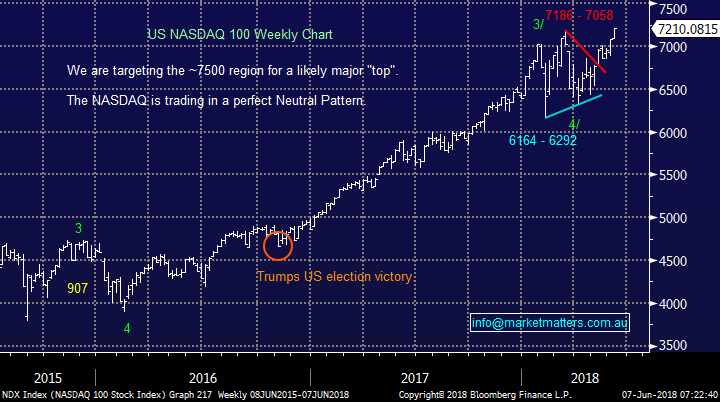
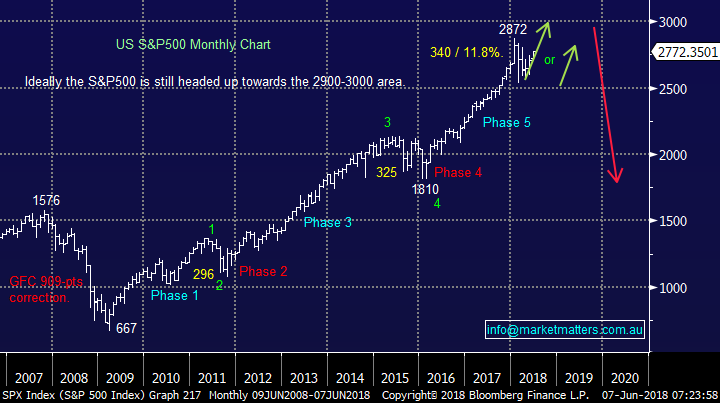
The tech-based NASDAQ made / closed at fresh all-time highs last night with the broader S&P500 now only 3.6% below its same milestone. Most pundits I read, and I love to read, expect the S&P500 to fail below its 2018 highs, however at MM we are leaning the other way until further notice expecting US stocks to rally another ~6%.
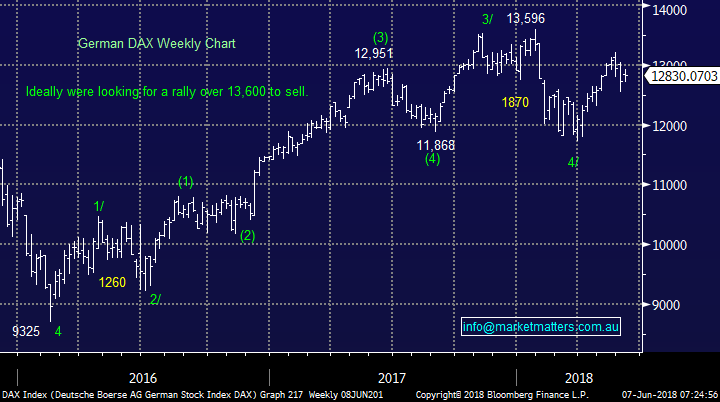
In Europe the UK FTSE is threatening to fail after achieving its same milestone 2-weeks ago and the German DAX remains 6% below its 2018 high, again our preferred scenario is European indices follow the NASDAQ to fresh all-time highs creating a degree of euphoria for global equity investors.
No change, we are on alert for a decent market correction and are still looking to increase our cash position into strength.
US NASDAQ Chart
US S&P500 Chart
German DAX Chart
Overnight Market Matters Wrap
· The US markets rallied overnight, as investors take risk on in hopes that the ‘trade war’ has dissipated and we are back in business ahead of the G7 meet this week.
· This was seen with both the materials and financial sector outperforming the broader market overnight.
· BHP is expected to outperform the broader market after ending its US session up an equivalent of 1.43% from Australia’s close.
· The June SPI Futures is indicating the ASX 200 to open 25 points higher towards the 6050 level this morning.
Have a great day!
James & the Market Matters Team
Disclosure
Market Matters may hold stocks mentioned in this report. Subscribers can view a full list of holdings on the website by clicking here. Positions are updated each Friday, or after the session when positions are traded.
Disclaimer
All figures contained from sources believed to be accurate. Market Matters does not make any representation of warranty as to the accuracy of the figures and disclaims any liability resulting from any inaccuracy. Prices as at 07/06/2018.
Reports and other documents published on this website and email (‘Reports’) are authored by Market Matters and the reports represent the views of Market Matters. The MarketMatters Report is based on technical analysis of companies, commodities and the market in general. Technical analysis focuses on interpreting charts and other data to determine what the market sentiment about a particular financial product is, or will be. Unlike fundamental analysis, it does not involve a detailed review of the company’s financial position.
The Reports contain general, as opposed to personal, advice. That means they are prepared for multiple distributions without consideration of your investment objectives, financial situation and needs (‘Personal Circumstances’). Accordingly, any advice given is not a recommendation that a particular course of action is suitable for you and the advice is therefore not to be acted on as investment advice. You must assess whether or not any advice is appropriate for your Personal Circumstances before making any investment decisions. You can either make this assessment yourself, or if you require a personal recommendation, you can seek the assistance of a financial advisor. Market Matters or its author(s) accepts no responsibility for any losses or damages resulting from decisions made from or because of information within this publication. Investing and trading in financial products are always risky, so you should do your own research before buying or selling a financial product.
The Reports are published by Market Matters in good faith based on the facts known to it at the time of their preparation and do not purport to contain all relevant information with respect to the financial products to which they relate. Although the Reports are based on information obtained from sources believed to be reliable, Market Matters does not make any representation or warranty that they are accurate, complete or up to date and Market Matters accepts no obligation to correct or update the information or opinions in the Reports.
If you rely on a Report, you do so at your own risk. Any projections are estimates only and may not be realised in the future. Except to the extent that liability under any law cannot be excluded, Market Matters disclaims liability for all loss or damage arising as a result of any opinion, advice, recommendation, representation or information expressly or impliedly published in or in relation to this report notwithstanding any error or omission including negligence.
To unsubscribe. Click Here