5 ETF’s Market Matters are considering in 2018/9.
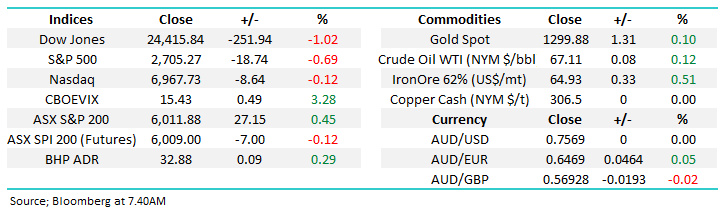
The ASX200 managed to close above 6000 yesterday and in the process, it bucked the usual weak May fears closing up +0.5% for the month, although unfortunately still -1.6% below the months high. Banks were yet again the weakest link for the index falling -2.5% while CSL, the markets 6th largest company, surged over 9% which helped address the imbalance.
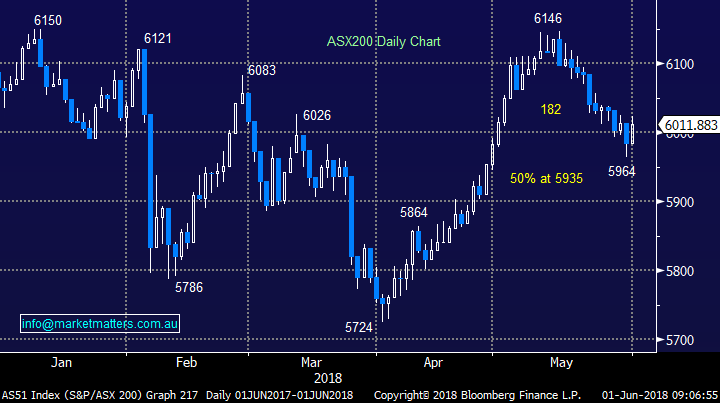
Over the last 10-years the local markets combined correction in May / June is -4.7%, to put that into perspective if we assume the 6146 May high holds it implies the ASX200 is likely to close around the 5850-area. While at MM we still believe the market “feels” ok we are not losing sight of our medium-term bearish outlook for global stocks.
- MM remains mildly bullish ideally targeting ~6250 for the ASX200 BUT we remain in “sell mode”.
Overnight global markets were weak as Donald Trump inevitably sprang back into the news finally actually imposing tariffs on steel / aluminium Canada, Mexico and the EU. If the US continues with this “hammer” style approach to make “America Great Again” the potential ramifications for global growth are huge hence our first thought is stocks held up ok, the Dow and EuroStoxx only fell -1% while the SPI futures are calling the ASX200 down less than 10-points early on.
Today’s report is going to follow of from an excellent question in Mondays morning report and look at 5 Australian ETF’s we are considering using in 2018 /9. Wikipedia shows the 82 ETF’s they currently recognise, many of which are available in Australia – we certainly feel spoilt for choice! Click here to view
ASX200 Chart
5 Australian ETF’s we may use in 2018/9
Today we have obviously only touched the tip of the iceberg in the relatively new / growing ETF world but the following 5 ETF’s that I have discussed give MM the potential investment flexibility we are searching for moving forward. In reality we may not even have mentioned the next ETF we use but we have to start somewhere to explore this relatively new culture towards investing.
When we selected these 5 we were looking for tried and tested ETF’s that exhibited excellent liquidity, had reasonable costs and covered markets / opportunities that potentially interested us moving forward. Importantly, ETFs are often discussed as a ‘passive investment’, often by active fund managers. While we like the concept of ETFs and will likely use them in the future, we will certainly have an active rather than a passive bias.
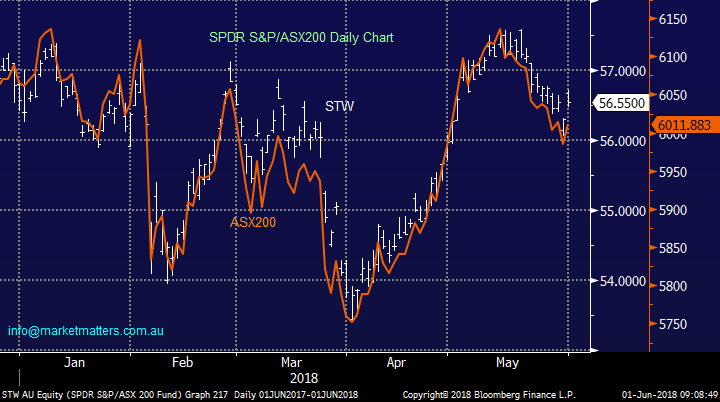
1 State Street SPDR S&P/ASX200 (STW) 56.56
SPDR funds (pronounced spider) are a family of exchange-traded global funds managed by State Street. The STW ETF is the perfect vehicle to invest and also trade the ASX200. The current $$ invested in the STX is $3.67bn, a lot more than most of us invest daily!
- Hence when we are holding a significant cash position moving forward but expect a quick 5-10% bounce by the ASX200 the STW would be perfect instrument to add some value / alpha to the MM portfolio’s without taking on stock specific risks.
Starting with the important $$ meaning of the 56.56 last price - it’s pleasantly simple, just like buying a stock for $56.56 if it goes up a dollar you make a dollar and vice-versa.
- Hence yesterday the ETF rallied 0.25 to 56.55, up 0.44% just like the ASX200 which rallied +0.45%, basically identical within rounding errors.
Yesterday the ETF only traded ~$10m in value but its depth would be significantly greater simply tracking the ASX200 and the ASX200 Share Price Index (SPI) where the market makers would hedge their positions.
The below chart illustrates the very high correlation between the STW and the ASX200.
SPDR S&P/ASX200 (STW) v ASX200 Chart
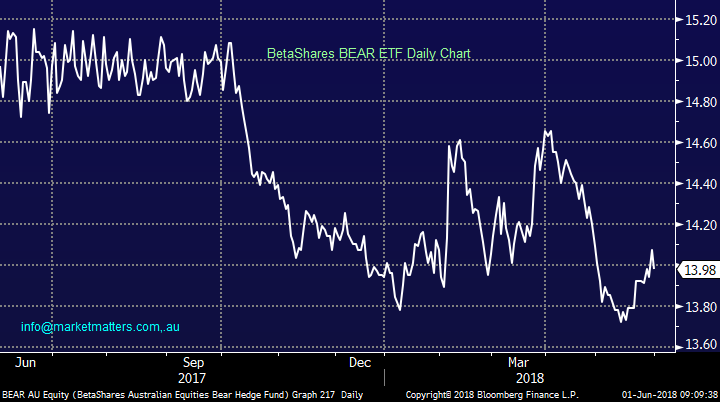
2 BetaShares Australian Equities Bear Fund (BEAR) $13.98
The BEAR has a market cap of only $51m while being designed to generate returns negatively correlated to the ASX200. Similar to the above STW its actual depth is determined by the ASX200 stocks and SPI futures hence no issues for investors.
The fund is on the expensive end of the scale costing 1.38% p.a. to administer but we believe this is fair for an ETF that allows us to easily short the ASX200.
Buying the BEAR is like purchasing shares in a company for $13.98 that benefits from the ASX200 falling, two examples:
- The ASX200 rallied +7.4% from early April into Mays 6146 high while the BEAR fell -7.2%, good enough correlation for us.
- In January / February the BEAR rallied 6% when the ASX200 corrected -5.9%, again excellent correlation.
One of the positions that MM is considering when we believe a significant pullback for global stocks is close at hand is holding say CBA for its 6.2% fully franked yield and buying the BEAR to protect against any market downturn.
BetaShares Australian Equities Bear Fund (BEAR) Chart
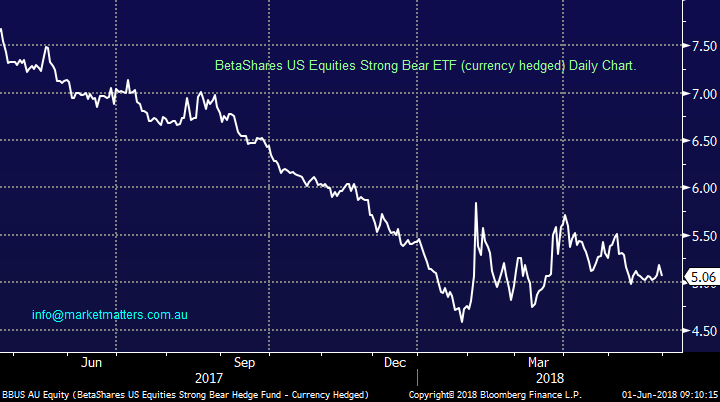
3 BetaShares US Equities Strong Bear Hedge Fund – currency hedged (BBUS) $5.06
The BBUS is designed to be negatively correlated to the US share market (using the S&P500) while being hedged to the $A. The ETF currently only has a market cap of $57m but its liquidity is determined by the S&P futures where the depth makes our own ASX200 feel like a child’s toy hence no issues there for MM.
Like the BEAR this fund is on the expensive end of the scale costing 1.38% p.a. to administer but we again believe this is fair for an ETF that allows us to easily short the US stock market.
Its important investors understand the leverage in this ETF, which is implied by the “Strong” in its title:
- The BBUS at one stage rallied over 30% in January when the actual S&P500 only fell -12% at its worst.
- Similarly, from the S&P500’s low in February 2016 to its top in January 2018 the BBUS fell by over 70% while the US Index only rallied by 59%.
At MM we can see ourselves using the BBUS in a similar manner to the BEAR when we feel that US equities will underperform our local market but we will remain mindful of the leverage / currency adjustment skew in this ETF.
BetaShares US Equities Strong Bear ETF – currency hedged (BBUS) Chart
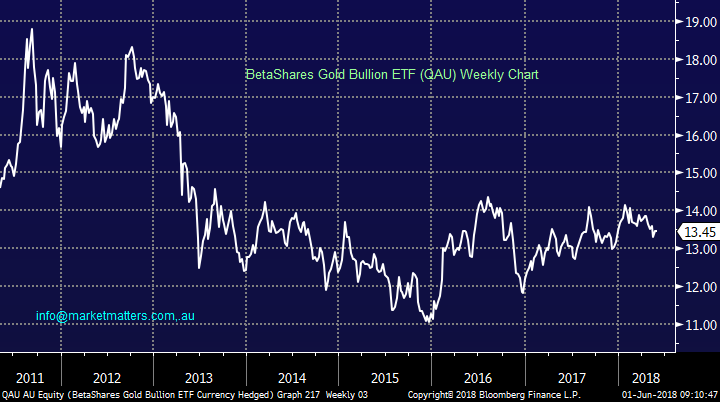
4 BetaShares Gold Bullion ETF (QAU) $13.45
Importantly the QAU represents gold hedged for any AUDUSD moves e.g. if gold remains unchanged in $US but the AUDUSD falls the QAU will rise – potentially ideal for MM as we are bearish the $A in the years ahead.
The ETF only has current market cap of $58m but its liquidity is determined by gold itself hence again no concerns there for MM. The fund is relatively cheap only costing 0.49% p.a. to administer.
MM can envisage ourselves using QAU in the future if / when stocks have a major downturn as gold often comes into favour during these periods of uncertainty plus the hedging for $A moves appeals to us as mentioned earlier.
BetaShares Gold Bullion ETF (QAU) Chart
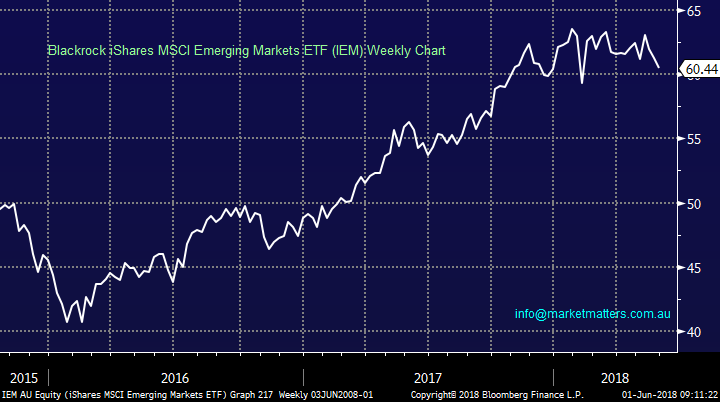
5 Blackrock iShares MSCI Emerging Markets ETF (IEM) $60.44
The IEM traded $1.275m yesterday while holding assets of over $US30bn, clearly no liquidity issues here.
The ETF holds emerging market stocks that are predominantly large and mid-cap in size.
The significant correlation between the IEM and our resources sector gives MM an alternative to specific stocks when we expect a short but quick move in the sector, we will generally use stocks but sometimes it’s just easier to use a broad index.
NB This would have been a far more exciting option in previous years when Australian resource stocks paid poor dividends, however this has changed and we expect stocks will remain our main focus.
Blackrock iShares MSCI Emerging Markets ETF (IEM) Chart
Conclusion (s)
No change, we remain short-term positive stocks but sellers into strength as we believe a ~20% correction for stocks is looming on the horizon.
When we believe it’s time to be out / short equities MM anticipates using some of the mentioned 5 ETF’s – it’s all about preparation.
We are currently long the US Dollar ETF in the Growth Portfolio
Global indices
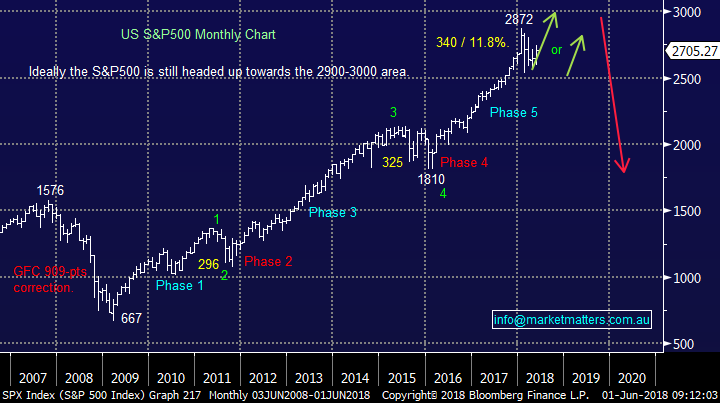
Overnight markets were weak as Italy concerns were replaced with Trump and trade worries, our short-term bullish view towards US stocks remains intact for now.
We remain short-term bullish US stocks targeting ~6% upside for the S&P500.
US S&P500 Chart
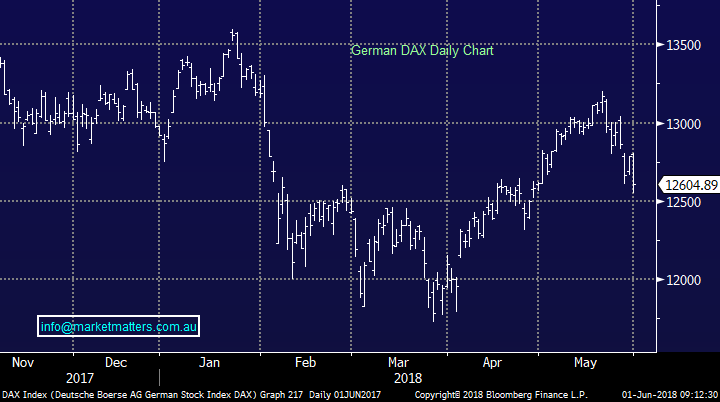
European stocks remain ok but the latest bout of weakness will concern us if it continues much further e.g. the DAX below 12,400 would trigger sell signals technically.
German DAX Chart
Overnight Market Matters Wrap
· The SPI is down 7 points as US and European equities fell overnight. The DJIA closed down 1%, while the NASDAQ fared the best, but still closed 0.3% in the red.
· The US announced that it would reimpose tariffs on steel and aluminium from the EU, Canada and Mexico. Investors are worried that this could ignite a trade war that will impact profits and push up inflation.
· Despite the chances of higher inflation, the yield on the US 10 year bonds barely moved to 2.86% as investors piled into safe havens. Initial jobless claims dropped more than expected, while personal spending and the Chicago PMI beat expectations, increasing the chances that the Fed will lift rates next month.
· Oil was flat, iron ore fell while all metals on the LME bar zinc made small gains.
Have a great day
James & the Market Matters Team
Disclosure
Market Matters may hold stocks mentioned in this report. Subscribers can view a full list of holdings on the website by clicking here. Positions are updated each Friday, or after the session when positions are traded.
Disclaimer
All figures contained from sources believed to be accurate. Market Matters does not make any representation of warranty as to the accuracy of the figures and disclaims any liability resulting from any inaccuracy. Prices as at 01/06/2018. 9.24AM
Reports and other documents published on this website and email (‘Reports’) are authored by Market Matters and the reports represent the views of Market Matters. The MarketMatters Report is based on technical analysis of companies, commodities and the market in general. Technical analysis focuses on interpreting charts and other data to determine what the market sentiment about a particular financial product is, or will be. Unlike fundamental analysis, it does not involve a detailed review of the company’s financial position.
The Reports contain general, as opposed to personal, advice. That means they are prepared for multiple distributions without consideration of your investment objectives, financial situation and needs (‘Personal Circumstances’). Accordingly, any advice given is not a recommendation that a particular course of action is suitable for you and the advice is therefore not to be acted on as investment advice. You must assess whether or not any advice is appropriate for your Personal Circumstances before making any investment decisions. You can either make this assessment yourself, or if you require a personal recommendation, you can seek the assistance of a financial advisor. Market Matters or its author(s) accepts no responsibility for any losses or damages resulting from decisions made from or because of information within this publication. Investing and trading in financial products are always risky, so you should do your own research before buying or selling a financial product.
The Reports are published by Market Matters in good faith based on the facts known to it at the time of their preparation and do not purport to contain all relevant information with respect to the financial products to which they relate. Although the Reports are based on information obtained from sources believed to be reliable, Market Matters does not make any representation or warranty that they are accurate, complete or up to date and Market Matters accepts no obligation to correct or update the information or opinions in the Reports.
If you rely on a Report, you do so at your own risk. Any projections are estimates only and may not be realised in the future. Except to the extent that liability under any law cannot be excluded, Market Matters disclaims liability for all loss or damage arising as a result of any opinion, advice, recommendation, representation or information expressly or impliedly published in or in relation to this report notwithstanding any error or omission including negligence.
To unsubscribe. Click Here


