4 stocks we might sell in the weeks / months ahead (APX, AAPL US, MQG, BPT, XRO, BBOZ)
The ASX200 enjoyed another strong day at the office yesterday rallying almost 50-points to close just shy of the psychological 6000 level. The buying was fairly broad based with over 60% of the index closing positive but IT stocks were the clear winners gaining over +2% - remember what MM is looking for moving forward - “If US stocks in particular are going to make another assault on fresh all-time highs under the steam of a reinvigorated Fed we feel it’s the large cap tech stocks like Apple (AAPL US) and Microsoft (MSFT US) who will do the heavy lifting.” Importantly if the growth stocks enjoy another burst of outperformance over value MM will be paying extremely close attention to what we believe then comes next i.e. plan your trade & trade your plan!
1 – MM expects equities to make fresh post COVID-19 highs led by the IT Sector, if this move unfolds MM plans to again increase cash levels, including potentially taking some money off the table across our respective portfolios from the likes of the Healthcare & IT Sectors.
2 – Also we might consider taking a negative facing ETF position to hedge part of our equity exposure, the leveraged BBOZ ETF which MM often follows rallied almost 20% during the ASX200’s recent pullback from 6198.
3 – Importantly we will be looking for increased cash levels to allow us to again be aggressive buyers if the market fails above 6200, in-line with our medium-term bullish outlook i.e. sell strength and buy weakness.
We’re not trying to read tea leaves here it’s just tweaking portfolios when stocks get too stretched in both directions - MM believes 2020/2021 will see an ongoing choppy ascent to fresh all-time highs. Remember the average annual return over the last 20-years is less than 9% hence adding some alpha / value if the markets going to keep swinging as the newswires continue to hum makes total sense to us – since the March low the ASX200 has already corrected 7.7%, 8.3% and 7.7% respectively which equates to a decent pullback every month in these nervous and uncertain times.
For the record we believe the next pullback will probably be over 10% just to catch out the traders who are complacently buying dips of more than say 5%.
US S&P500 Value & Growth Indices Chart
To clarify our preferred scenario is the current Fed induced optimism will take the ASX200 above the June 6200 swing high before investors again realise, probably driven by another catalyst of news, that stocks are overvalued considering the economic risks / uncertainties which continue to lurk beneath the surface. As we said previously our “Gut Feel” is the next pullback will be deeper than the one this month.
MM remains bullish equities short & medium-term.
ASX200 Index Chart
MM talked about Appen Ltd (APX), prominent local IT sector on Tuesday, calling it up towards $35. Unfortunately we cannot buy the whole market but already this “call” looking on the money, technically we would then become very wary from a risk / reward basis – this ties in with both our sector and index view for the Australian market.
MM remains bullish APX short-term looking for another ~10% upside.
Appen (APX) Chart
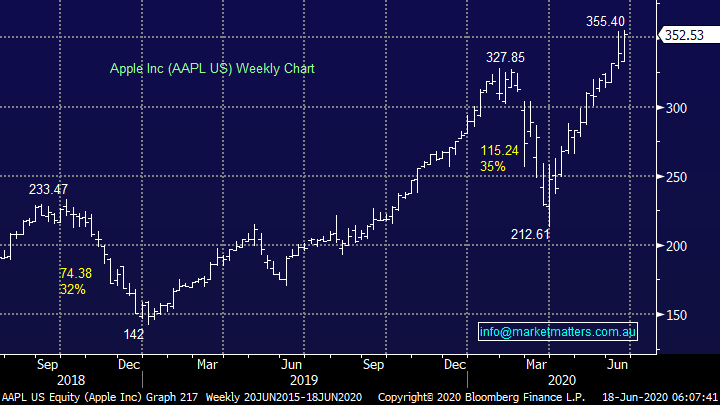
Similarly, when we cast our eyes over the heavyweight members of the US tech-based NASDAQ things might look a touch stretched on the upside but they are undoubtedly still bullish. Household name Apple made fresh all-time highs this week with the NASDAQ only 1% behind, it’s certainly not an aggressive call to forecast the FANG’s and friends will make all-time highs in the weeks ahead but for the broad based indices like the S&P500 another 3-5% is required to reach their equivalent milestone.
MM remains bullish Apple medium-term, but we are again becoming slowly cautious short-term.
Apple Inc (AAPL US) Chart
Global Markets.
US stocks have followed the Feds recent bullish rhetoric recovering strongly from last week’s sell-off initially sparked by concerns around the economic recovery in the US and then compounded by a secondary COVID-19 breakout in Beijing. At this stage of the cycle record low interest rates / bond yields are definitely trumping any worrying uncertainty concerning the global economic recession post the mass virus pandemic – perhaps we are again becoming slowly but surely too optimistic & complacent.
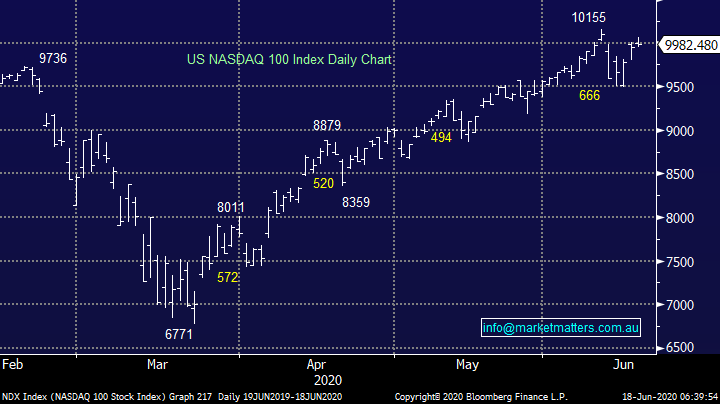
From a technical perspective the NASDAQ 100 has already corrected between 5 and 7% four times since its panic March 23rd low, an awesome recovery but again not without a few clear bumps in the road – my “Gut Feel” here is after another clear break above the psychological 10,000 level we will see a pullback of greater magnitude next time, there’s certainly plenty of meat in the sandwich after the index has soared 50% in under 3-months.
MM remains bullish US stocks very short-term.
US NASDAQ 100 Index Chart
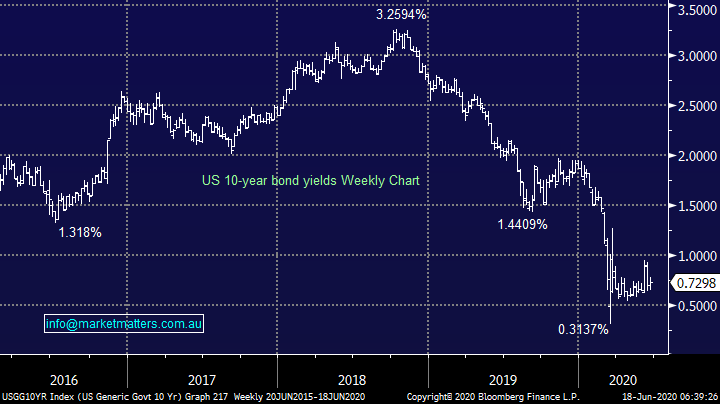
Following the Feds announcement to start buying “a portfolio of corporate bonds immediately” US bond yields have understandably been subdued i.e. when bond prices go up their yields fall. However, MM remains bullish US 10-year bond yields with an initial target of 1%, a move which is likely to require some fresh encouraging economic statistics out of the US.
MM remains bullish bond yields medium-term.
US 10-year Bond Yield Chart
Four potential sells into a market rally.
Great stock market investing needs to follow that scouting mantra of “always be prepared” and while it might feel to some readers that MM have become too active our opinion is that the current market volatility must be taken into account - MM are not traders but active investors. When markets are swinging around in a normal year range every few months plenty of opportunities will be definition be created.
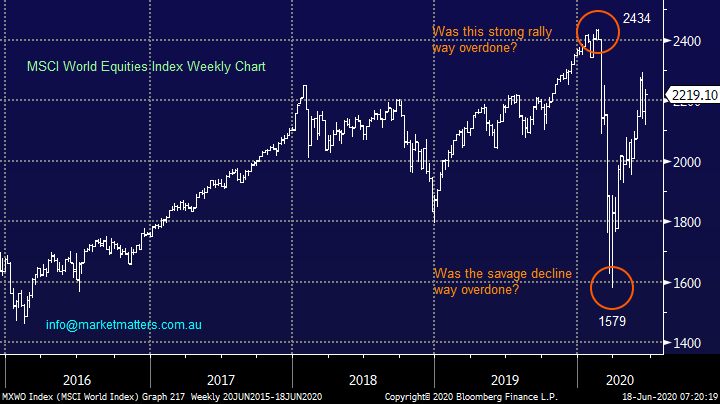
MM have increased our market exposure as planned into the latest 7.7% pullback and as discussed we are now considering tweaking back the other way into fresh highs for global stocks – when markets are providing opportunities to add value / alpha our view at MM is why not take advantage!
MSCI World Equities Index Chart
Today I have looked at 4 stocks / positions which MM are already considering if we see a strong performance by stocks in the coming weeks.
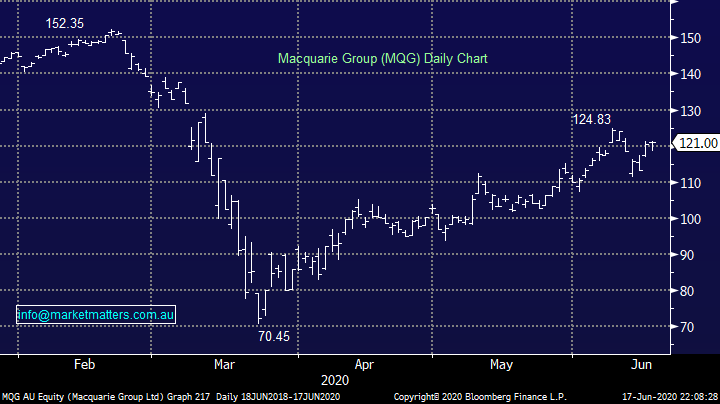
1 Macquarie Group (MQG) $121.
MM averaged our long Macquarie Group (MQG) position back in May which has proved fruitful so far although in hindsight the IT sector would have proved a better proxy to US market strength this time around. This week we bought National Australia Bank (NAB) into the market sell-off following our general bullish outlook for banks into 2021 hence I can image many subscribers wondering why MQG is in today’s list. A couple of simple points:
1 – We are looking to take some $$ from the table ~5% higher after buying NAB into weakness i.e. tweaking value around the edges.
2 – MQG has a decent portion of its revenue generated in $US plus it is highly correlated to the US market, two things we believe will become headwinds in H2 of this year.
3 – We regard MQG as a market proxy and a stock to be more active in
MM is considering taking profit on all / part of our holding ~5% higher.
Macquarie Group (MQG) Chart
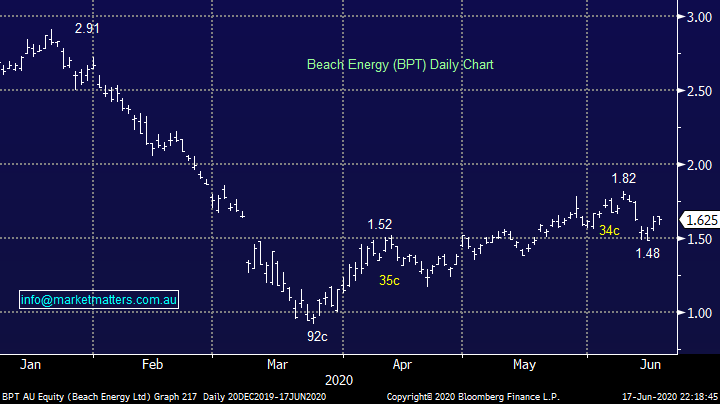
2 Beach Energy (BPT) $1.62.
BPT has corrected 23% and 19% during its journey up from its panic March low, an impressive bounce which has seen the oil stock almost double while illustrating its penchant for volatility. This week MM moved up the risk curve by increasing our oil exposure via Woodside (WPL), if we see a ~15% pop higher by BPT we feel this will provide a good opportunity to again par back our exposure to this volatile sector.
MM is considering cutting its BPT position above its June high.
Beach Energy (BPT) Chart
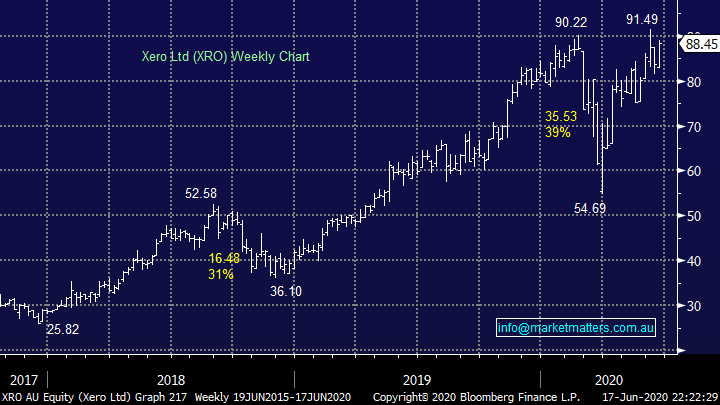
3 Xero Ltd (XRO) $88.45.
New Zealand based Xero is an impressive business but at what price is the question, we have been reticent to sell this stock previously above $90 but never say never and into a strong rally above its all-time high MM will again be tempted to sell all / part of this overweight position.
MM is considering take some $$ on XRO above $92, or 5% higher.
Xero Ltd (XRO) Chart
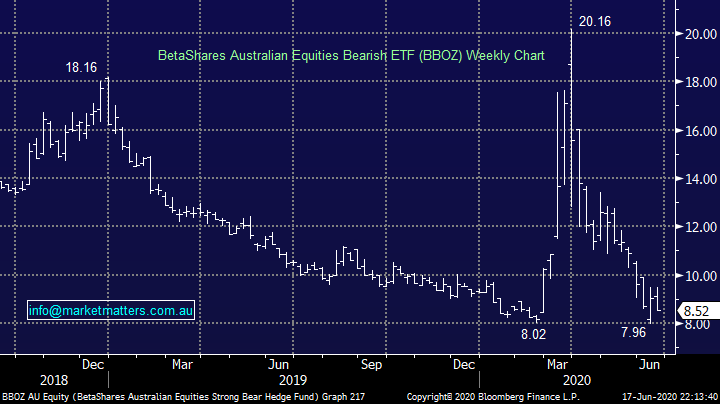
4 BetaShares Leveraged ASX Bearish ETF (BBOZ) $8.52.
This leveraged negative facing ETF gives excellent downside protection for an ASX portfolio, especially if we decide the MM portfolio mix is about right hence this would become a solid option as opposed to selling individual stocks. E.g. if we allocate 10% of the MM Growth Portfolio into the BBOZ it will theoretically insulate ~23% of the stock holdings against future declines while of course capping the upside on a similar portion of the portfolio.
MM likes the BBOZ into fresh 2020 lows.
BetaShares Leveraged ASX Bearish ETF (BBOZ) Chart
Conclusion
MM is considering moving back down the risk curve if / when we see the ASX200 break above its June 6198 high.
Overnight Market Matters Wrap
- Stocks were mostly lower overnight, although Tech still managed a small gain - COVID-19 headlines increasingly negative.
- US corporate bond sales have already surpassed all of last year's issuance with the companies borrowing US$1.2t so far this year alone, tapping fed liquidity
- Crude oil fell after the EIA reported a rise in US stockpiles
- Locally, Employment data out today which will be key
- The September SPI Futures is indicating the ASX 200 to continue follow the US lead and open 0.5% lower this morning along with a volatile open on June Index expiry.
Have a great day!
James & the Market Matters Team
Disclosure
Market Matters may hold stocks mentioned in this report. Subscribers can view a full list of holdings on the website by clicking here. Positions are updated each Friday, or after the session when positions are traded.
Disclaimer
All figures contained from sources believed to be accurate. All prices stated are based on the last close price at the time of writing unless otherwise noted. Market Matters does not make any representation of warranty as to the accuracy of the figures or prices and disclaims any liability resulting from any inaccuracy.
Reports and other documents published on this website and email (‘Reports’) are authored by Market Matters and the reports represent the views of Market Matters. The Market Matters Report is based on technical analysis of companies, commodities and the market in general. Technical analysis focuses on interpreting charts and other data to determine what the market sentiment about a particular financial product is, or will be. Unlike fundamental analysis, it does not involve a detailed review of the company’s financial position.
The Reports contain general, as opposed to personal, advice. That means they are prepared for multiple distributions without consideration of your investment objectives, financial situation and needs (‘Personal Circumstances’). Accordingly, any advice given is not a recommendation that a particular course of action is suitable for you and the advice is therefore not to be acted on as investment advice. You must assess whether or not any advice is appropriate for your Personal Circumstances before making any investment decisions. You can either make this assessment yourself, or if you require a personal recommendation, you can seek the assistance of a financial advisor. Market Matters or its author(s) accepts no responsibility for any losses or damages resulting from decisions made from or because of information within this publication. Investing and trading in financial products are always risky, so you should do your own research before buying or selling a financial product.
The Reports are published by Market Matters in good faith based on the facts known to it at the time of their preparation and do not purport to contain all relevant information with respect to the financial products to which they relate. Although the Reports are based on information obtained from sources believed to be reliable, Market Matters does not make any representation or warranty that they are accurate, complete or up to date and Market Matters accepts no obligation to correct or update the information or opinions in the Reports. Market Matters may publish content sourced from external content providers.
If you rely on a Report, you do so at your own risk. Past performance is not an indication of future performance. Any projections are estimates only and may not be realised in the future. Except to the extent that liability under any law cannot be excluded, Market Matters disclaims liability for all loss or damage arising as a result of any opinion, advice, recommendation, representation or information expressly or impliedly published in or in relation to this report notwithstanding any error or omission including negligence.


