3 switches on our radar for the weeks ahead (AMP, CBA, ANZ, ASL, TLS, HLS, SIG, NHF, SKC)
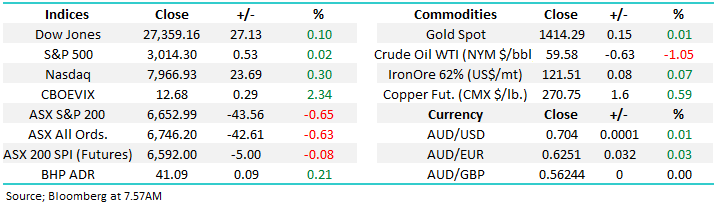
The ASX200 had a bad day at the office to kick off its third week of the new financial year, suddenly were only up +0.5% for July as downgrades keep rolling over the index, the looming Augusts reporting season must scarring a few fund managers. The damage yesterday came from a few different angles with almost 70% of the ASX200 closing in the red with the Banks, Utilities, Industrials, IT and Telcos all noticeably weighing on the index. There were a few patches of optimism with the resources the clear standout as iron ore remained firm, golds rallied on an apparent flight to safety and nickel stocks bounced in line with the base metal on Friday night.
We will touch on yet another disaster by AMP a little later but it certainly put a dampener on Mondays sentiment, however the Software & Services stocks (IT) caught my eye as they fell well over 2% to be the worst sector on the day, in the process totally ignoring the NASDAQ’s multi-year high on Friday night. This remains a sector we believe is currently “dangerous” with elevated valuations, no doubt some will soar but riding the wrong horse we feel will be expensive e.g. over the last 5-days Nearmap (NEA) -s down -9.6% and Afterpay Touch (APT) -10.6%.
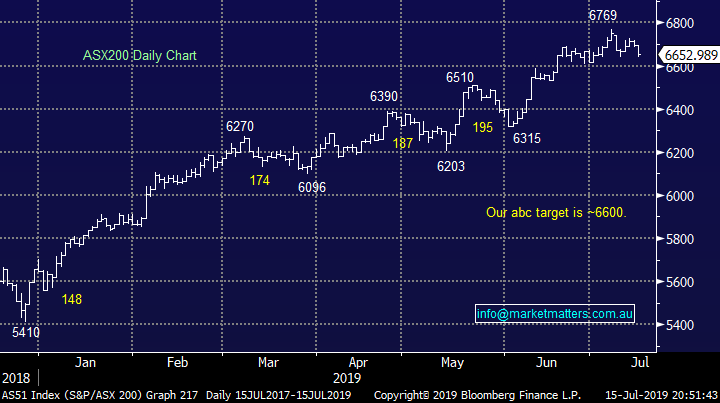
We have been calling the ASX200 to test below 6600 in the coming weeks but on reflection we feel the 6600 area should hold unless the markets in some potential trouble. There still appears to be plenty of money of the sidelines looking for yield which was illustrated perfectly by GPT’s corporate bond issue which was 4x oversubscribed even when it was only yielding 2.525% - its great news for companies when they can borrow money at such low interest rates. Why doesn’t the Australian Government take more advantage of this and build critical infrastructure.
MM remains comfortable to adopt a more conservative stance over the next 6-months.
Overnight US stocks were quiet closing basically unchanged after again touching intra-day all-time highs. The SPI futures are calling the ASX200 to open down around 10-points this morning taking our pullback to ~2%. Today market action is likely to be dictated by Fed members, including Jerome Powell, speaking later today on monetary policy while the RBA board meeting minutes will be closely scrutinised by local analysts.
Today we are going to look at another 3 switches MM is considering in the weeks ahead as we move our Portfolio’s to a more defensive stance.
ASX200 Chart
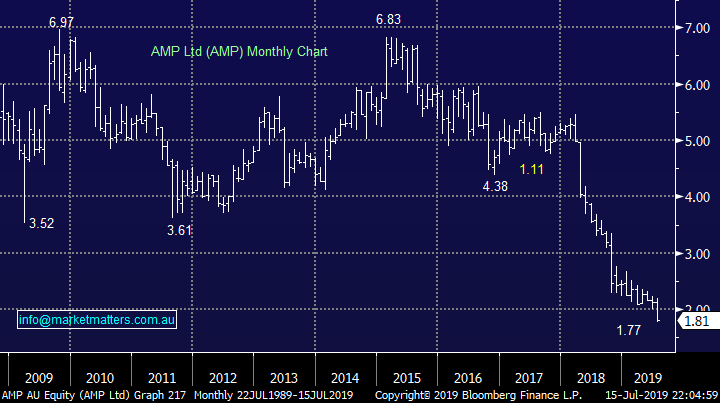
Yesterday AMP again felt the wrath of investors as it was smashed -18.%, taking its loss for the year to ~50% = yuk!
Not only has the sale of the Australian and New Zealand life insurance been canned but the interim dividend has disappeared making it the worst example of a yield trap I can remember since Myer (MYR). My analyst in the sector Brett Le Mesurier who is ranked No1 in Australia by Bloomberg cut 2020 earnings by 7% and a whopping 12% for 2021, and still calls it a sell, target $1.50 or 25% lower - perhaps its new trading range will be $1-$2 with the lower boundary equalling its NTA.
MM has no interest in AMP, it’s too hard.
AMP Ltd (AMP) Chart
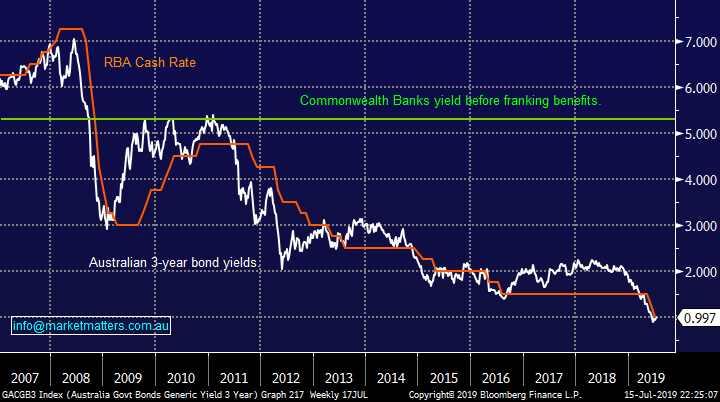
In Australia as we all know interest rates are an all-time low with the RBA cash rate at a previously un-comprehendible 1% and many pundits expect it to fall further! Term deposits have fallen below 2% which is putting pressure on both our Banking sector and importantly retirees who are living from savings which in many cases were more than adequate prior to the recent plunge in rates.
At MM we often use the acronym “KISS”, keep it simple stupid, and it applies perfectly to the stock market today, it’s extremely attractive on a comparative yield basis with interest rates at current levels – even Warren Buffett agrees with this prognosis.
The chart below illustrates perfectly the value differential between cash rates and the yield from Australia’s largest stock CBA.
MM believes stocks with sustainable yield will be well supported unless a significant recession hits our shores.
Interest Rate comparisons Chart
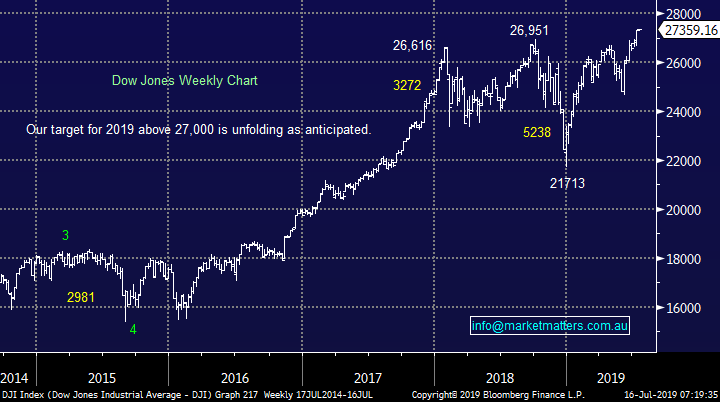
Overnight US stocks traded to another all-time high, which is starting to sound like a recorded message. We have been targeting a pop above 27,000 to potentially complete the 2019 rally hence we cannot become too excited by this rally.
Also, our favourite US sentiment indicator is becoming more bullish usually an excellent reverse indicator. We are cautious US stocks, not bearish yet, with a close below 26,600 required to trigger alarm bells i.e. 2.5% lower.
https://www.aaii.com/sentimentsurvey
Dow Jones Chart
Three switches MM is considering moving forward.
Moving onto 4 switches we are seriously considering in 2019 as we continue evolving our portfolio to a more conservative position and of course continue to strive to add value. In all cases these portfolio tweaks require further movement by the respective stocks but its all about being prepared. Also, these ideas might overlap depending on the movement of stocks in question i.e. remain flexible.
At this stage we should simply reflect back to the Weekend Report which not surprisingly forms the cornerstone of our thoughts today:
Holdings MM is considering selling - Healius (HLS), NIB Holdings (NHF) and Ausdrill (ASL).
Stocks MM is considering purchasing – Smart Group (SIQ), Sigma Healthcare (SIG), Stockland (SGP), Sky Entertainment (SKC), Resolute Mining (RSG) plus of course increasing some of our existing holdings.
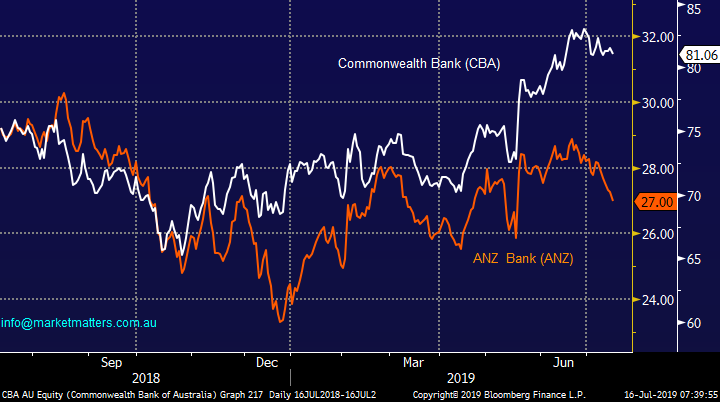
1 Commonwealth Bank (CBA) to ANZ Bank (ANZ)
This switch is more about adding value as opposed to being defensive and its probably going to be unpopular with many readers. However the below chart shows the relative value elastic band is being stretched, especially after CBA traded ex-dividend in February – over the last 3-months CBA is up +11.5% while ANZ has only gained +2.2%.
The peer group metrics below shows CBA trading on a 20% P/E premium to its historical average while ANZ is trading at an 11% discount.
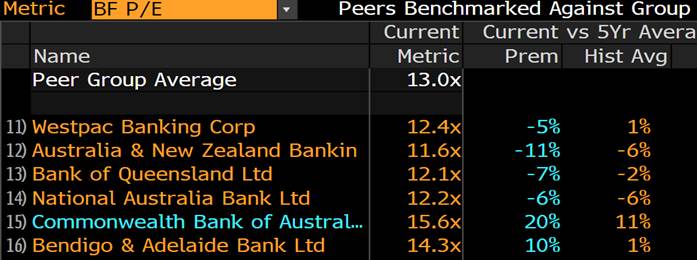
Source: Bloomberg
Their respective forecast yields are also widening with CBA ~5% and ANZ ~6%, both obviously fully franked. ANZ has more exposure to business banking which is improving while CBA has hung its hat more on the retail customer which is still struggling under the weight of household debt. ANZ does have a lower return on capital than CBA due to its failed Asian expansion, however that influence will decline rather than expand over the coming years.
In short, while CBA is a better bank, we doubt it’s ~40% better than ANZ as the relative P/E’s imply. At today’s prices the switch is tempting plus potentially it will allow us to reduce $$ allocation to the position while still enjoying the same income.
MM is considering switching from CBA to ANZ.
Commonwealth Bank (CBA) v ANZ Bank (ANZ) Chart
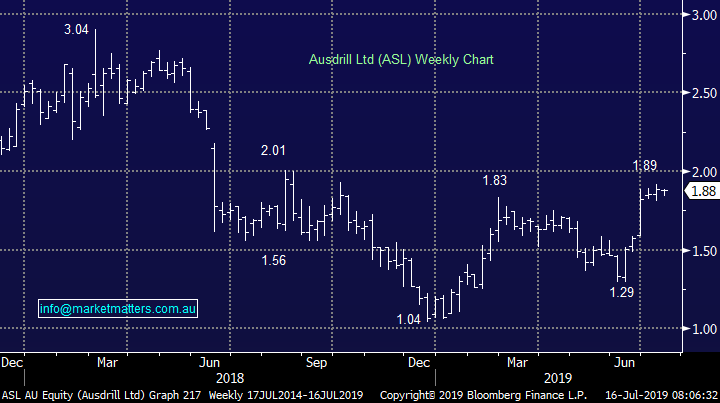
2 Ausdrill (ASL) to Telstra (TLS)
ASL has been looking after us nicely since we went long in February with the position currently showing a paper profit of ~23%. Our target for the mining services business is above $2, or 6-8% higher. Obviously its report in mid-August is likely to have a major impact on the stocks share price.
MM remains a seller of ASL above $2.
Ausdrill (ASL) Chart
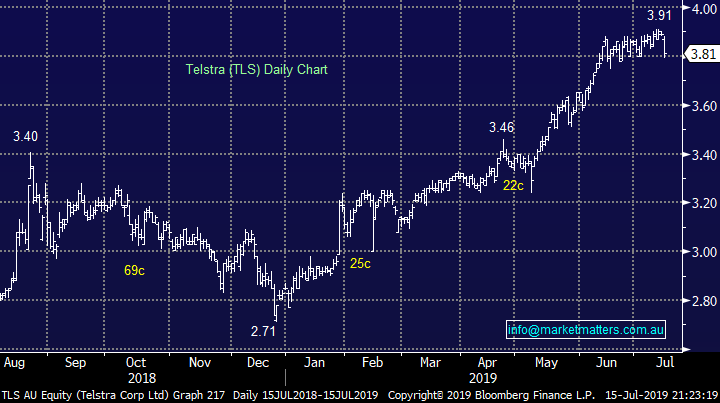
Telstra may have fallen in sympathy with AMP on Monday with nerves probably setting in ahead of is August report, they have both got a reputation for disappointing the market. We are still considering re-entering the giant Telco ~$3.70, over 5% below its recent 2019 high. This is another example of MM not being “too proud” to re-enter stocks above where we previously exited, it’s all about adding value and not ego! At these levels we feel TLS’s sustainable yield will again become attractive to investors.
We TLS is now good value ~$3.70.
Telstra (TLS) Chart
3 Healius (HLS) to Sigma Healthcare (SIG)
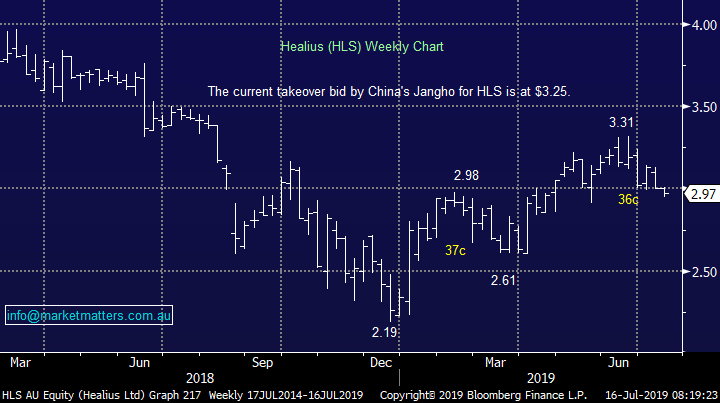
HSL has come off the boil recently and our main modus operandi to own the stock is around corporate activity. The markets now doubting this is a likely scenario.
MM will be a seller of HLS if it cannot hold current levels.
Healius (HLS) Chart
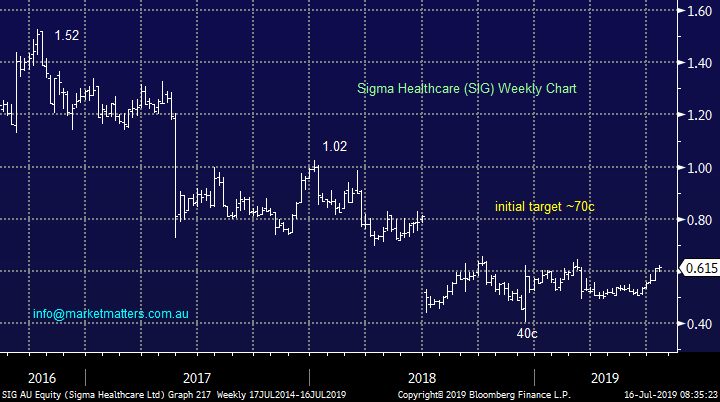
Sigma is a new stock to our watchlist but the wholesaler / distributor of pharmaceuticals is coming off a very low base while offering decent reward, basically we now believe the Chemist Warehouse news is behind the stock. The projected 6.5% yield is attractive but obviously we must all be cognisant of another AMP style “yield trap”.
We like SIG with stops below 55c (10%) but note this is a higher risk play.
MM likes SIG initially targeting ~15% upside.
Sigma Healthcare (SIG) Chart
4 NIB Holdings (NHF) to Telstra (TLS)
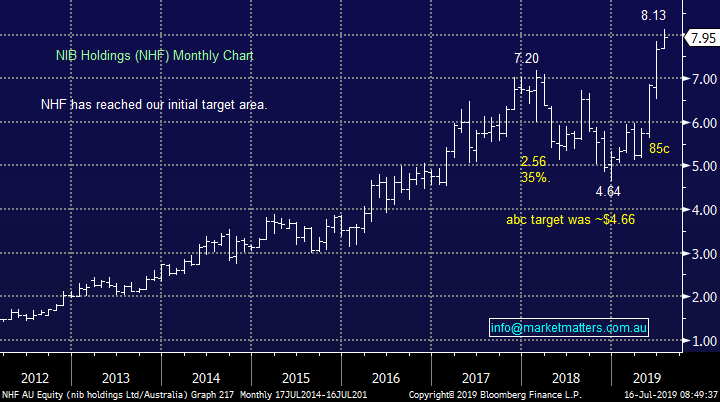
NHF has rallied strongly following the hugely favourable election result for the private health insurers but we feel most of the good news is built into the stock around $8. The fully franked yield of NHF below 3% is “better than the banks” but not as attractive as other stocks on our bourse.
MM is considering selling NHF above $8.
NIB Holdings (NHF) Chart
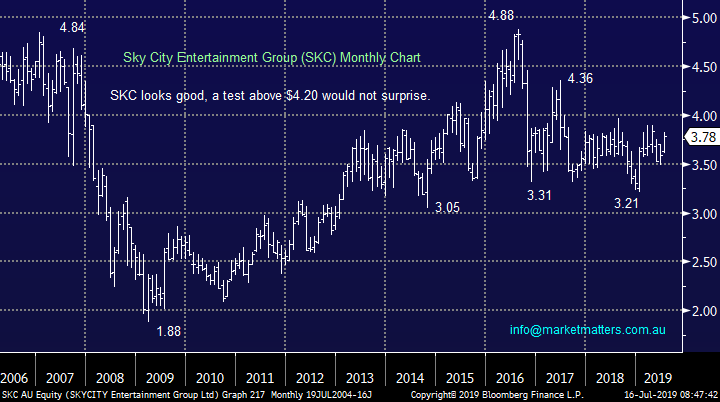
The gaming and entertainment Sky City (SKC) is coming back to life after a tough few years with its 5% unfranked dividend undoubtedly a supportive factor.
MM likes SKC initially targeting ~15% upside.
NB Stockland (SGP) could easily have occupied this space, especially for investors that benefit from franking credits. We hold SGP in the MM Income Portfolio.
Sky City Entertainment (Group (SKC) Chart
Conclusion (s)
MM likes all the portfolio tweaks considered above, as we have mentioned previously we like stocks with sustainable yield and believe it’s time for the less in your face names to perform.
Global Indices
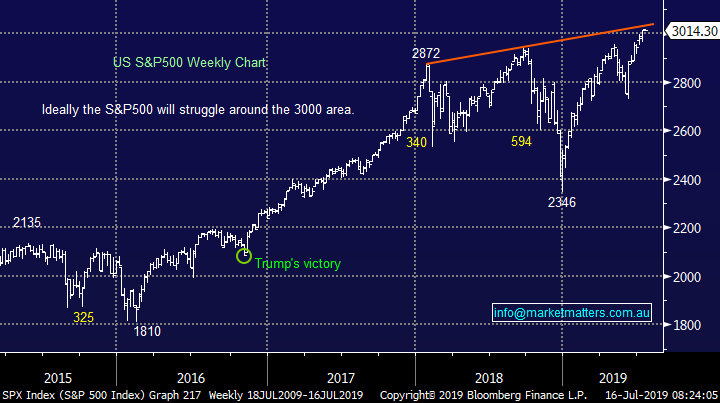
At this stage US stocks are making fresh all-time highs albeit in our target area, we need to see a break back below 2950 by the S&P500 to become seriously concerned with the markets health i.e. just over 2% lower.
We reiterate that while US stocks have reached our target area but they have not yet generated any technical sell signals.
US S&P500 Index Chart
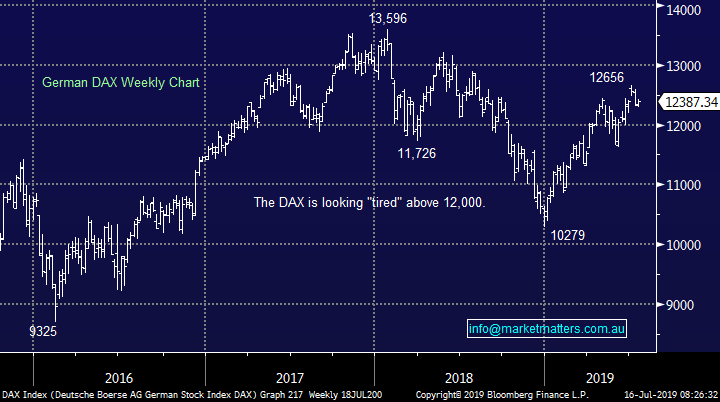
No change again with European indices, we remain cautious European stocks and their tone has become more bearish over the last few weeks.
German DAX Chart
Overnight Market Matters Wrap
· The US equity markets edged marginally higher overnight, again hitting record highs led by the tech heavy Nasdaq 100.
· US quarterly earnings kicked off overnight, starting with Citigroup which revealed tighter lending margins and led the financial sector to underperform against most peers.
· Crude oil slipped over 1% despite supply disruptions from hurricane Barry in the Gulf of Mexico as investors and traders alike see a slowing growth demand in China.
· The September SPI Futures is indicating the ASX 200 to open marginally higher, towards the 6660 level this morning.
Have a great day!
James & the Market Matters Team
Disclosure
Market Matters may hold stocks mentioned in this report. Subscribers can view a full list of holdings on the website by clicking here. Positions are updated each Friday, or after the session when positions are traded.
Disclaimer
All figures contained from sources believed to be accurate. Market Matters does not make any representation of warranty as to the accuracy of the figures and disclaims any liability resulting from any inaccuracy. Prices as at 16/07/2019
Reports and other documents published on this website and email (‘Reports’) are authored by Market Matters and the reports represent the views of Market Matters. The MarketMatters Report is based on technical analysis of companies, commodities and the market in general. Technical analysis focuses on interpreting charts and other data to determine what the market sentiment about a particular financial product is, or will be. Unlike fundamental analysis, it does not involve a detailed review of the company’s financial position.
The Reports contain general, as opposed to personal, advice. That means they are prepared for multiple distributions without consideration of your investment objectives, financial situation and needs (‘Personal Circumstances’). Accordingly, any advice given is not a recommendation that a particular course of action is suitable for you and the advice is therefore not to be acted on as investment advice. You must assess whether or not any advice is appropriate for your Personal Circumstances before making any investment decisions. You can either make this assessment yourself, or if you require a personal recommendation, you can seek the assistance of a financial advisor. Market Matters or its author(s) accepts no responsibility for any losses or damages resulting from decisions made from or because of information within this publication. Investing and trading in financial products are always risky, so you should do your own research before buying or selling a financial product.
The Reports are published by Market Matters in good faith based on the facts known to it at the time of their preparation and do not purport to contain all relevant information with respect to the financial products to which they relate. Although the Reports are based on information obtained from sources believed to be reliable, Market Matters does not make any representation or warranty that they are accurate, complete or up to date and Market Matters accepts no obligation to correct or update the information or opinions in the Reports. Market Matters may publish content sourced from external content providers.
If you rely on a Report, you do so at your own risk. Past performance is not an indication of future performance. Any projections are estimates only and may not be realised in the future. Except to the extent that liability under any law cannot be excluded, Market Matters disclaims liability for all loss or damage arising as a result of any opinion, advice, recommendation, representation or information expressly or impliedly published in or in relation to this report not withstanding any error or omission including negligence.


