3 Buys & Sells for the Technical Orientated Investor (BSL, ORI, CIM, QAN, NAN, GWA)
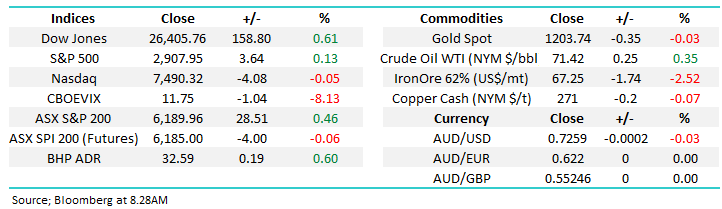
The ASX200 bounced +0.5% yesterday as the “market washing machine” continued to tumble - this time we saw resources bounce solidly but the property and telco sectors fall away. Also, heavyweight market darling CSL fell another $2.80, the current $31.18 pullback is now the stocks largest in history from a $$ perspective but as we explained in the afternoon report we are not yet ready to stand in front of this train – sub $190 and we will definitely start drawing up our plans.
In line with the weakness in CSL the $A is presently enjoying a solid bounce having rallied close to 2c from this weeks lows, we feel the market is heavily skewed to the “$US earners” which while it makes sense to MM in the bigger macro picture can lead to sharp swings against the crowded position i.e. everyone’s long hence no buyers into the selling. This is one reason we have remained patient with our planned buying of Aristocrat (ALL) whose momentum looks capable of again taking the stock back towards the $28 area.
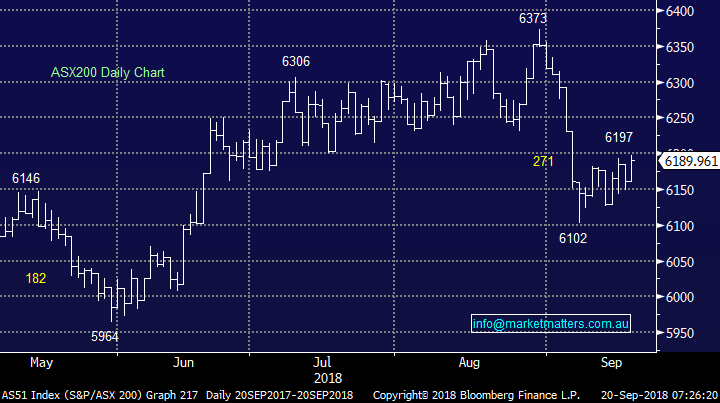
From the last day of August the ASX200 fell 271-points in 7 trading days but since it’s taken 8-trading days to retrace only 1/3 of the decline, from a technical perspective this banal recovery is bearish and often represents a simple pause before the next leg lower. After this mornings opening all the index derivatives expiring will be behind us leading to a truer indication of the markets short-term internal strength.
· MM remains negative the ASX200 with an initial target sub 6000.
Overnight stocks were mixed with Europe up around +0.5%, the Dow rallied a healthy +0.6% but the NASDAQ and Russell 2000 all closed lower. The SPI futures are pointing to an unchanged open by the ASX200.
Today’s report is going to look at 3 standout technical buys and sells in the ASX200 as sector rotation continues to dominate the market, especially this financial year with the index sitting unchanged since June 30th.
NB Generating “3 stocks to buy” per week is most definitely not our “opus operandi” at MM but occasionally a change is good
ASX200 Chart
Telco sector
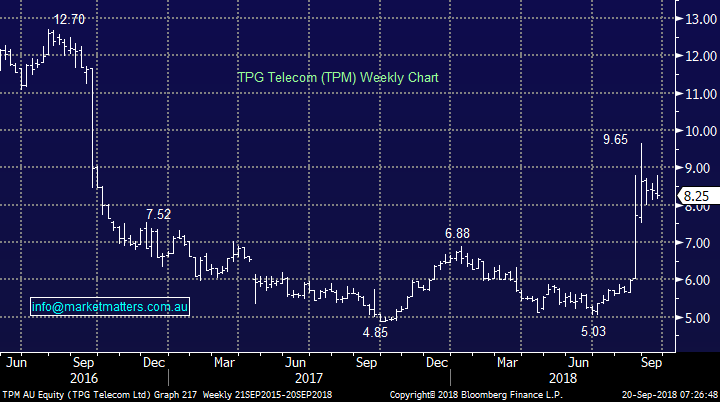
Yesterday we saw the telco sector get hit fairly hard on some rumblings that the deal between Vodafone and TPM may not proceed while TPM had also released their full year results the day before. Yesterday we saw TPG Telecom (TPM) -5.4% and Telstra (TLS) -1.6%.
This ‘merger of equals’ between TPM and Vodafone has been the primary reason for share price strength in the sector of late. Any issues that may potentially derail that merger will likely put pressure on the entire sector. It feels like a combination of weak commentary from TPM following their results, which were actually fairly positive, and the TPG Telecom – Vodafone merger playing out, could add a decent amount of volatility to the sector from here. We even saw TLS fall 2% in the last hours trade as investors appeared to grab their recent profits.
We are happy with our TLS holding but would not consider TPM until the $7-$7.50 region.
TPG Telecom (TPM) Chart
Bond yield update
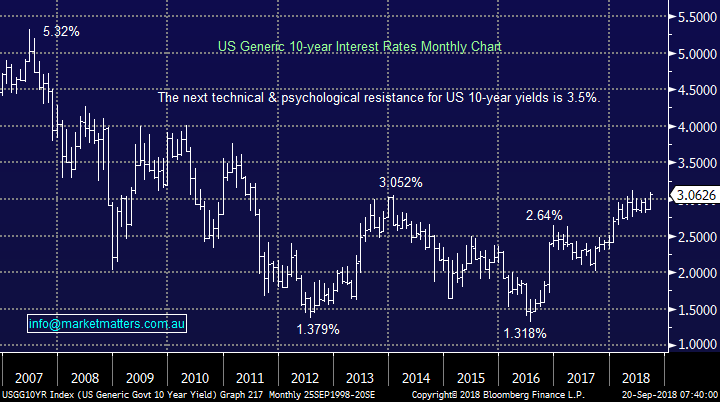
US bond yields are rallying strongly this month looking set to test 6-year highs in the coming weeks. Higher bond yields in the US are driving sector rotation in a pronounced manner and we are likely to follow suit albeit it in a diluted fashion.
Overnight the US real Estate and Utilities sectors fell -2.2% and -1% respectively while the financials gained +1.7%.
Our view at MM remains this sector trend will continue into 2019.
US 10-year bond yield Chart
Technical signals often lead company news hence at MM we believe they are ignored at your peril, why not use all the tools at your disposal to improve investment performance?
We general look for more than one piece of the puzzle to come together before we initiate / cut a position e.g. market, sector and stock views from a macro-economic, fundamental and technically perspectives.
Three technical buys.
Interestingly we found it harder to find 3 exciting buy set ups in the ASX200 than sells, although we deliberately looked outside of the major stocks regularly covered.
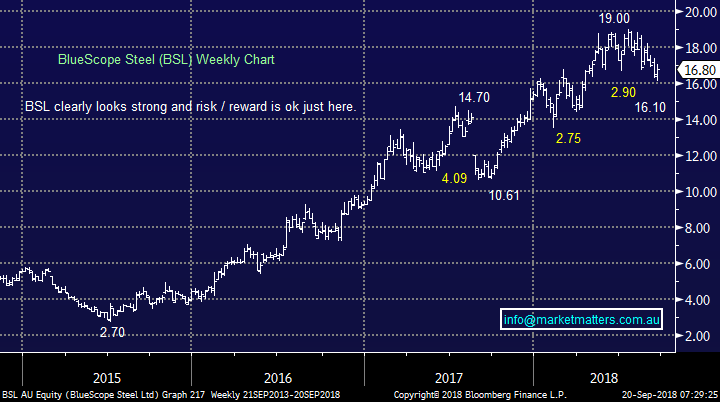
1 BlueScope Steel (BSL) $16.80
BSL has corrected 15% in an orderly fashion through 2018. Two opportunities now exists to buy BSL with decent risk / reward following the bullish medium term trend targeting ~$20.
- Buy BSL around current levels with stops below $15.60.
- Buy BSL if the stock rallies back through $17.40 with stops below $16.10 swing low.
In both cases investors will be investing with the trend having ~3-1 risk / reward in their favour.
BlueScope Steel (BSL) Chart
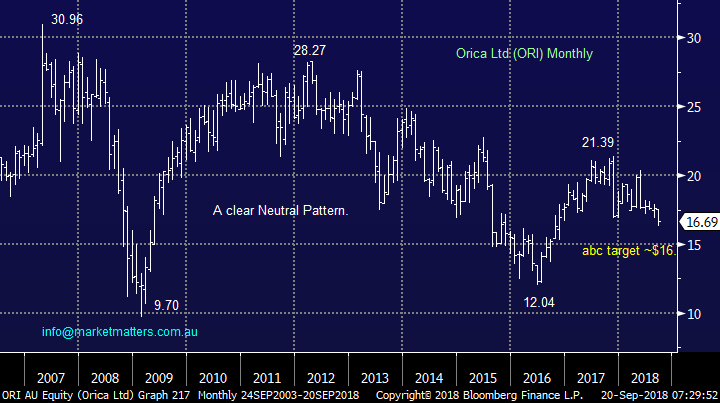
2 ORICA Ltd (ORI) $16.69
ORI clearly runs its own race trading with very little correlation to the ASX200 since 2011.
MM likes ORI below $16.40 with stops below $15.40.
This is relatively aggressive play looking for the stock to regrain its positive momentum from early 2016 targeting well over $20 hence the risk / reward justifies catching the falling knife in this case.
ORICA Ltd (ORI) Chart
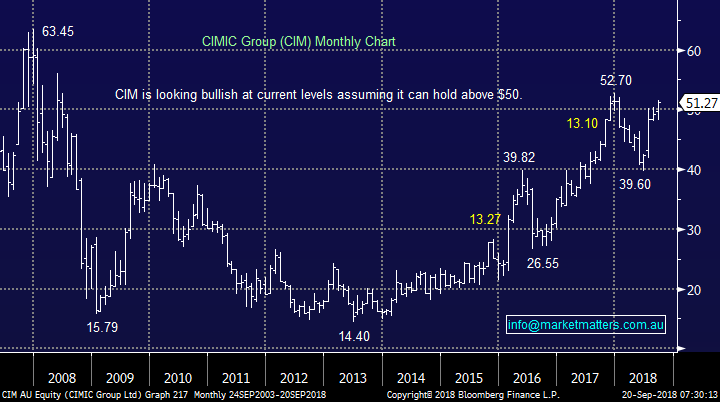
3 CIMIC Group (CIM) $51.27
We have included CIM this morning because we sent out a buy alert earlier in the year which unfortunately was not filled.
MM remains bullish CIM targeting the $55 area hence the risk / reward is still good for the aggressive trader using stops below $50.
CIMIC Group (CIM) Chart
Three technical sells.
Interestingly all 3 of these might be showing an underlying theme that may unfold on a macro level.
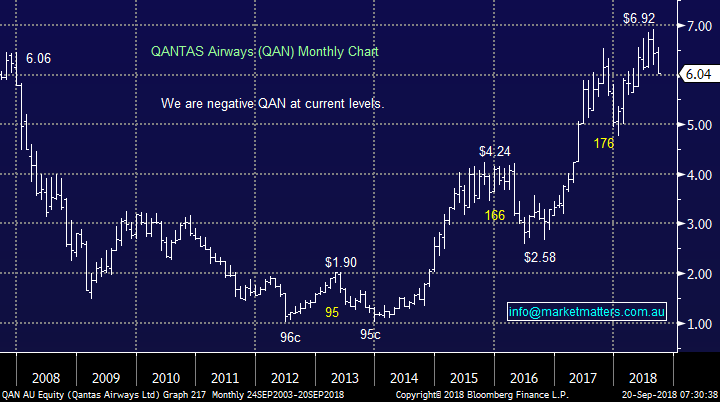
1 QANTAS (QAN) $6.04
QAN has followed our technical path very well for the last 2 years - it’s frustrating we didn’t benefit from the stocks strong advance in that time.
However, we are now bearish QAN targeting the $5 area, another ~15% lower.
This bearish picture has led us to ponder if oil prices are set to rally which fits our macro-economic outlook of rising interest rates / inflation.
QANTAS (QAN) Chart
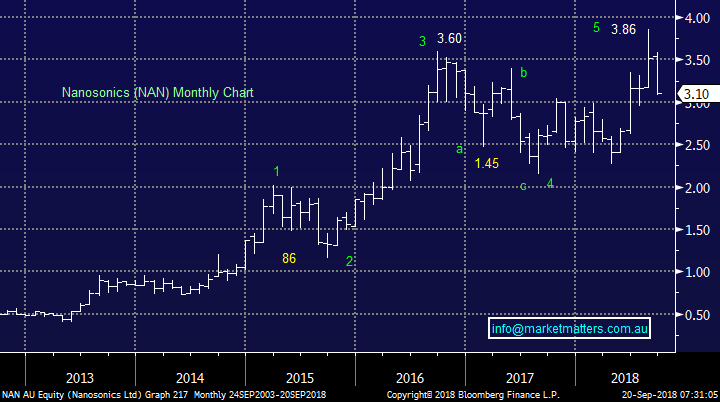
2 Nanosonics (NAN) $3.10
NAN is generating a sell signal with both the Elliott Wave and Distribution Theory technical methods plus it’s a $US earner putting it in “the wrong place at the wrong time” this week.
MM is bearish NAN eventually targeting the $2.50 area, another ~20% lower - it should be noted this is a volatile stock.
Nanosonics (NAN) Chart
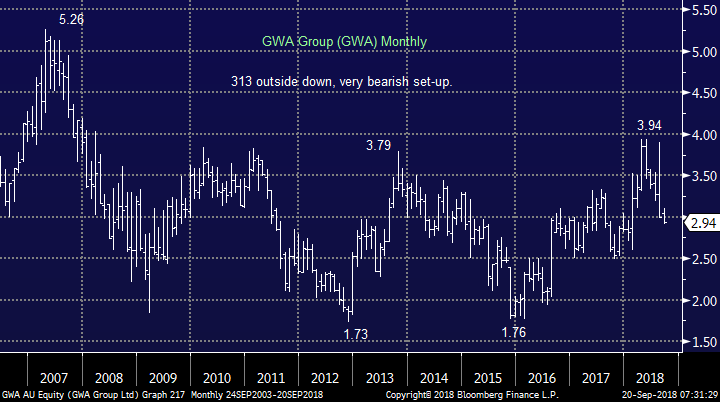
3 GWA Group (GWA) $2.94
GWA manufacturers household fittings which may be an issue if Australia’s high levels of household bites deeply i.e. the local consumer will stop spending.
Like NAN, GWA is generating a sell signal with both the Elliott Wave and Distribution Theory technical methods.
Elliott Wave is targeting a pullback to the $2.50 area.
The Distribution Method is bearish following the false breakout above $3.80 eventually targeting sub $2.
GWA Group (GWA) Chart
Conclusion
We are bullish BSL, ORI and CIM while being bearish QAN, NAN and GWA.
Overseas Indices
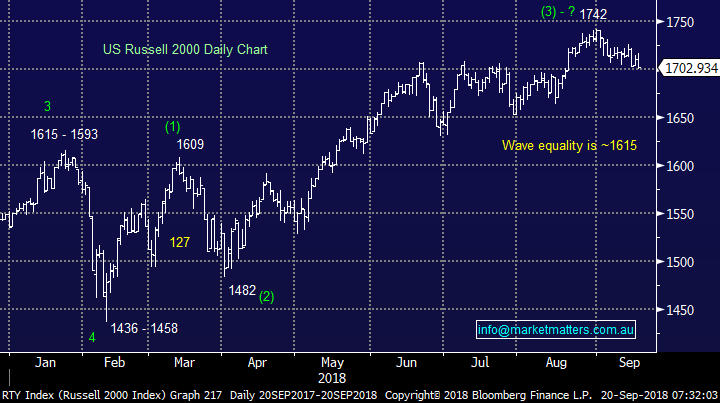
The US Russell 2000 fell -0.5% last night and amongst all the recent noise from equities we still believe this index will correct ~5% in the coming month, or two.
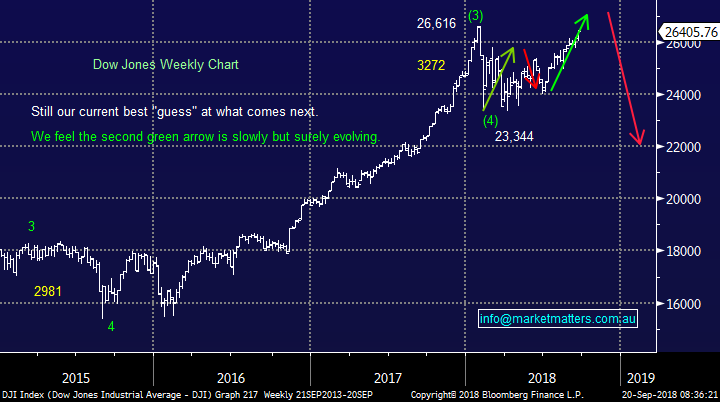
Also, the Dow continues to follow the path we forecasted many months ago, the index is now only 0.8% below its all-time high, very close to our objective before a major downturn.
US Russell 2000 Chart
US Dow Jones Chart
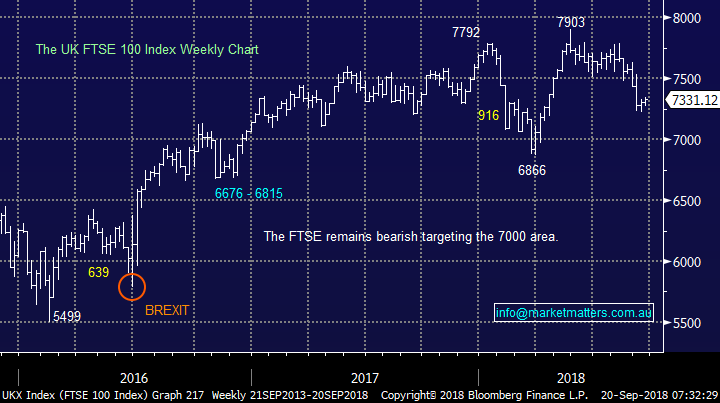
European indices remains fairly quiet like our own and we continue to target lower prices in the coming weeks.
UK FTSE Chart
Overnight Market Matters Wrap
· A mixed session was seen in the US, with the Dow outperforming its peers. US banks were better, but technology stocks fell. The US 10 year bond rate sits at 3.06%, impacting rate sensitive stocks.
· On a quiet night, most discussion was around the US-China trade tensions. The US has scope to increase the breadth of its tariffs as well as the rate from 10% to 25% in the New Year. After retaliating with tariffs on $60b of US goods, China is running out of options. For political reasons, they can’t afford to back down or risk losing face.
· Metals on the LME were mixed, with zinc up more than 3% being the highlight. Iron ore fell 0.5%, while oil is trading better.
· The December SPI Futures is indicating the ASX 200 to open with little change this morning, however a volatile open is expected due to September Index expiry.
Have a great day!
James & the Market Matters Team
Disclosure
Market Matters may hold stocks mentioned in this report. Subscribers can view a full list of holdings on the website by clicking here. Positions are updated each Friday, or after the session when positions are traded.
Disclaimer
All figures contained from sources believed to be accurate. Market Matters does not make any representation of warranty as to the accuracy of the figures and disclaims any liability resulting from any inaccuracy. Prices as at 20/09/2018
Reports and other documents published on this website and email (‘Reports’) are authored by Market Matters and the reports represent the views of Market Matters. The MarketMatters Report is based on technical analysis of companies, commodities and the market in general. Technical analysis focuses on interpreting charts and other data to determine what the market sentiment about a particular financial product is, or will be. Unlike fundamental analysis, it does not involve a detailed review of the company’s financial position.
The Reports contain general, as opposed to personal, advice. That means they are prepared for multiple distributions without consideration of your investment objectives, financial situation and needs (‘Personal Circumstances’). Accordingly, any advice given is not a recommendation that a particular course of action is suitable for you and the advice is therefore not to be acted on as investment advice. You must assess whether or not any advice is appropriate for your Personal Circumstances before making any investment decisions. You can either make this assessment yourself, or if you require a personal recommendation, you can seek the assistance of a financial advisor. Market Matters or its author(s) accepts no responsibility for any losses or damages resulting from decisions made from or because of information within this publication. Investing and trading in financial products are always risky, so you should do your own research before buying or selling a financial product.
The Reports are published by Market Matters in good faith based on the facts known to it at the time of their preparation and do not purport to contain all relevant information with respect to the financial products to which they relate. Although the Reports are based on information obtained from sources believed to be reliable, Market Matters does not make any representation or warranty that they are accurate, complete or up to date and Market Matters accepts no obligation to correct or update the information or opinions in the Reports. Market Matters may publish content sourced from external content providers.
If you rely on a Report, you do so at your own risk. Past performance is not an indication of future performance. Any projections are estimates only and may not be realised in the future. Except to the extent that liability under any law cannot be excluded, Market Matters disclaims liability for all loss or damage arising as a result of any opinion, advice, recommendation, representation or information expressly or impliedly published in or in relation to this report notwithstanding any error or omission including negligence.


